Shropshire Council election, 2017
|
| |||||||||||||||||
| |||||||||||||||||
All 74 seats to Shropshire Council 38 seats needed for a majority | |||||||||||||||||
|---|---|---|---|---|---|---|---|---|---|---|---|---|---|---|---|---|---|
| |||||||||||||||||
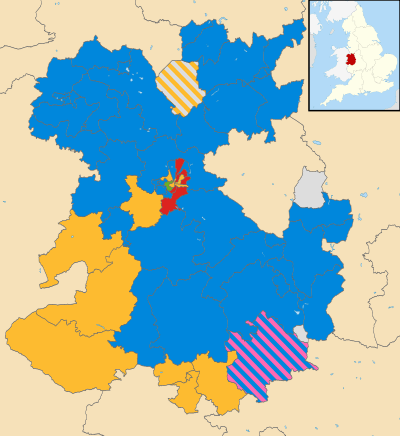 Map showing the results of the 2017 elections. Striped divisions have mixed representation. | |||||||||||||||||
| |||||||||||||||||
The 2017 Shropshire Council election took place on 4 May 2017 as part of the 2017 local elections in the United Kingdom.[1] All 74 councillors were elected from 63 electoral divisions which return either one, two or three councillors each by first-past-the-post voting for a four-year term of office.
Results
Summary
| Party | Seats | Gains | Losses | Net gain/loss | Seats % | Votes % | Votes | +/− | |
|---|---|---|---|---|---|---|---|---|---|
| Conservative | 49 | 3 | 2 | +1 | 48.8 | 51,215 | |||
| Liberal Democrat | 12 | - | 20.1 | 21,078 | |||||
| Labour | 8 | -1 | 16.3 | 17,083 | |||||
| Green | 1 | 1 | 0 | +1 | 7.5 | 7,850 | |||
| Independent | 3 | -1 | 5.2 | 5,426 | |||||
| Health Concern | 1 | 1.2 | 1,311 | ||||||
| UKIP | 0 | 0.9 | 994 | ||||||
| Federalist Party of the United Kingdom | 0.1 | 79 | |||||||
| Total | 104,986 | ||||||||
All wards are single seat unless otherwise stated
The results below are sourced from the Shropshire Council website.[2]
Abbey
| Party | Candidate | Votes | % | ± | |
|---|---|---|---|---|---|
| Liberal Democrat | Hannah Fraser | 790 | 55.59 | ||
| Conservative | Georgina Alison Boulger | 345 | 24.28 | ||
| Labour | Mark James Healey | 223 | 15.69 | ||
| UKIP | John Kinsey Price | 63 | 4.43 | ||
| Majority | |||||
| Turnout | 1421 | ||||
| Liberal Democrat hold | Swing | ||||
Albrighton
| Party | Candidate | Votes | % | ± | |
|---|---|---|---|---|---|
| Conservative | Malcolm Pate | 882 | 75.27 | ||
| Independent | Phillip Michael Harrison | 419 | 32.21 | ||
| Majority | |||||
| Turnout | 1301 | ||||
| Conservative hold | Swing | ||||
Alveley and Claverley
| Party | Candidate | Votes | % | ± | |
|---|---|---|---|---|---|
| Conservative | Tina Woodward | 919 | 75.27 | ||
| Liberal Democrat | Colin Taylor | 302 | 24.73 | ||
| Majority | |||||
| Turnout | 1221 | ||||
| Conservative hold | Swing | ||||
Bagley
| Party | Candidate | Votes | % | ± | |
|---|---|---|---|---|---|
| Conservative | Alexander George Phillips | 511 | 39.95 | ||
| Liberal Democrat | Beverley Baker | 385 | 30.1 | ||
| Labour | Wynn Davies | 383 | 29.95 | ||
| Majority | |||||
| Turnout | 1279 | ||||
| Conservative hold | Swing | ||||
Battlefield
| Party | Candidate | Votes | % | ± | |
|---|---|---|---|---|---|
| Conservative | Dean Spencer Carroll | 476 | 57.28 | ||
| Labour | Gianluca Cerritelli | 285 | 34.3 | ||
| Green | Chris Davenport | 70 | 8.42 | ||
| Majority | |||||
| Turnout | 831 | ||||
| Conservative hold | Swing | ||||
Bayston Hill, Column and Sutton
| Party | Candidate | Votes | % | ± | |
|---|---|---|---|---|---|
| Labour | Ted Clarke | 2318 | 20.9 | ||
| Labour | Tony Parsons | 1820 | 16.41 | ||
| Labour | Jane Mackenzie | 1720 | 15.51 | ||
| Conservative | Janine Hayter | 1315 | 11.86 | ||
| Conservative | Andrea Caroline Hall | 1206 | 10.87 | ||
| Conservative | Ryan Peter Alan Harrison | 1114 | 10.04 | ||
| Liberal Democrat | Will Coles | 474 | 4.27 | ||
| Green | Chris Lemon | 318 | 2.87 | ||
| Green | Josh Cockburn | 276 | 2.49 | ||
| UKIP | Ray Graham | 296 | 2.67 | ||
| Majority | |||||
| Majority | |||||
| Majority | |||||
| Turnout | 11092 | ||||
| Labour hold | Swing | ||||
| Labour hold | Swing | ||||
| Labour hold | Swing | ||||
Belle Vue
| Party | Candidate | Votes | % | ± | |
|---|---|---|---|---|---|
| Labour | Harry Taylor | 643 | 43.01 | ||
| Liberal Democrat | Daniel Adam Clark | 423 | 28.29 | ||
| Conservative | Simon James Wray | 362 | 24.21 | ||
| Green | Dave Latham | 67 | 4.48 | ||
| Majority | |||||
| Turnout | 1495 | ||||
| Labour hold | Swing | ||||
Bishop's Castle
| Party | Candidate | Votes | % | ± | |
|---|---|---|---|---|---|
| Liberal Democrat | Jonathan Keeley | 960 | 73.62 | ||
| Conservative | Christopher John Tyler | 273 | 20.94 | ||
| Majority | |||||
| Turnout | 1304 | ||||
| Liberal Democrat hold | Swing | ||||
Bowbrook
| Party | Candidate | Votes | % | ± | |
|---|---|---|---|---|---|
| Conservative | Peter Adams | 688 | 68.66 | ||
| Liberal Democrat | David Arwyn Ellams | 161 | 16.07 | ||
| Green | Peter John Gilbert | 153 | 15.27 | ||
| Majority | |||||
| Turnout | 1002 | ||||
| Conservative hold | Swing | ||||
Bridgnorth East and Astley Abbotts
| Party | Candidate | Votes | % | ± | |
|---|---|---|---|---|---|
| Conservative | Christian Lea | 1079 | 31.57 | ||
| Conservative | William Parr | 930 | 27.21 | ||
| Labour | Julia Buckley | 551 | 16.12 | ||
| Liberal Democrat | Naomi Vanessa Voysey | 440 | 12.87 | ||
| Labour | Richard Antony Fox | 418 | 12.23 | ||
| Majority | |||||
| Majority | |||||
| Turnout | 3418 | ||||
| Conservative hold | Swing | ||||
| Conservative hold | Swing | ||||
Bridgnorth West and Tasley
| Party | Candidate | Votes | % | ± | |
|---|---|---|---|---|---|
| Conservative | Les Winwood | 1098 | 32.42 | ||
| Conservative | Elliott Liam Lynch | 873 | 25.78 | ||
| Liberal Democrat | David Norman Cooper | 511 | 15.09 | ||
| Liberal Democrat | Stephen Golding Barras | 458 | 13.52 | ||
| Labour | Mick Lane | 312 | 9.21 | ||
| UKIP | Rod Evans | 135 | 3.99 | ||
| Majority | |||||
| Majority | |||||
| Turnout | 3387 | ||||
| Conservative hold | Swing | ||||
| Conservative hold | Swing | ||||
Broseley
| Party | Candidate | Votes | % | ± | |
|---|---|---|---|---|---|
| Conservative | Simon Christopher Harris | 892 | 60.6 | ||
| Labour | Gavin Nocholas Goodall | 580 | 39.4 | ||
| Majority | |||||
| Turnout | 1472 | ||||
| Conservative gain from Labour | Swing | ||||
Brown Clee
| Party | Candidate | Votes | % | ± | |
|---|---|---|---|---|---|
| Conservative | Robert Tindall | 887 | 79.77 | ||
| Liberal Democrat | Frederick David Voysey | 225 | 20.23 | ||
| Majority | |||||
| Turnout | 1112 | ||||
| Conservative hold | Swing | ||||
Burnell
| Party | Candidate | Votes | % | ± | |
|---|---|---|---|---|---|
| Conservative | Dan Morris | 847 | 49.1 | ||
| Liberal Democrat | Kate King | 814 | 47.19 | ||
| Green | Tereza Hayek | 64 | 3.71 | ||
| Majority | |||||
| Turnout | 1725 | ||||
| Conservative hold | Swing | ||||
Castlefields and Ditherington
| Party | Candidate | Votes | % | ± | |
|---|---|---|---|---|---|
| Labour | Alan Mosley | 857 | 74.2 | ||
| Conservative | Robert Charles Osborne | 180 | 15.58 | ||
| UKIP | Sylvia Loosley | 60 | 5.19 | ||
| Green | Claire Judith | 58 | 5.02 | ||
| Majority | |||||
| Turnout | 1155 | ||||
| Labour hold | Swing | ||||
Cheswardine
| Party | Candidate | Votes | % | ± | |
|---|---|---|---|---|---|
| Conservative | Rob Gittins | 735 | 76.01 | ||
| Labour | Len Surridge | 232 | 23.99 | ||
| Majority | |||||
| Turnout | 967 | ||||
| Conservative hold | Swing | ||||
Chirbury and Worthen
| Party | Candidate | Votes | % | ± | |
|---|---|---|---|---|---|
| Liberal Democrat | Heather Kidd | 1003 | 77.75 | ||
| Conservative | Phillip Dennis Morgan | 287 | 22.25 | ||
| Majority | |||||
| Turnout | 1290 | ||||
| Liberal Democrat hold | Swing | ||||
Church Stretton and Craven Arms
| Party | Candidate | Votes | % | ± | |
|---|---|---|---|---|---|
| Conservative | Lee Chapman | 1579 | 29.06 | ||
| Conservative | David Evans | 1536 | 28.27 | ||
| Liberal Democrat | Sam Jones | 815 | 15 | ||
| Liberal Democrat | Steve Jones | 711 | 13.09 | ||
| Green | Steve Hale | 404 | 7.44 | ||
| Green | Hilary Raborg Houchin Wendt | 388 | 7.14 | ||
| Majority | |||||
| Majority | |||||
| Turnout | 5433 | ||||
| Conservative hold | Swing | ||||
| Conservative hold | Swing | ||||
Clee
| Party | Candidate | Votes | % | ± | |
|---|---|---|---|---|---|
| Liberal Democrat | Richard Huffer | 899 | 60.99 | ||
| Conservative | James Wheeler | 575 | 39.01 | ||
| Majority | |||||
| Turnout | 1474 | ||||
| Liberal Democrat hold | Swing | ||||
Cleobury Mortimer
| Party | Candidate | Votes | % | ± | |
|---|---|---|---|---|---|
| Conservative | Gwilym Butler | 1349 | 39.43 | ||
| Health Concern | Madge Shineton | 1311 | 38.32 | ||
| Labour | John Mayers Rodgers | 315 | 9.21 | ||
| Liberal Democrat | Lucinda Faye Timmins | 255 | 7.45 | ||
| Liberal Democrat | Brett Lewis Jenkins | 191 | 5.58 | ||
| Majority | |||||
| Majority | |||||
| Turnout | 34.21 | ||||
| Conservative hold | Swing | ||||
| Health Concern hold | Swing | ||||
Clun
| Party | Candidate | Votes | % | ± | |
|---|---|---|---|---|---|
| Liberal Democrat | Nigel Hartin | 911 | 55.86 | ||
| Conservative | Sarah Jane Smith | 720 | 44.14 | ||
| Majority | |||||
| Turnout | 1631 | ||||
| Liberal Democrat hold | Swing | ||||
Copthorne
| Party | Candidate | Votes | % | ± | |
|---|---|---|---|---|---|
| Conservative | Peter Nutting | 735 | 59.85 | ||
| Liberal Democrat | Rob Lea | 287 | 23.37 | ||
| Green | Gareth Stephen Egarr | 151 | 12.3 | ||
| UKIP | Frank James Henry Burgess | 55 | 4.48 | ||
| Majority | |||||
| Turnout | 1228 | ||||
| Conservative hold | Swing | ||||
Corvedale
| Party | Candidate | Votes | % | ± | |
|---|---|---|---|---|---|
| Conservative | Cecilia Motley | 1058 | 80.4 | ||
| Labour | Manda Scott | 258 | 19.6 | ||
| Majority | |||||
| Turnout | 1316 | ||||
| Conservative hold | Swing | ||||
Ellesmere Urban
| Party | Candidate | Votes | % | ± | |
|---|---|---|---|---|---|
| Conservative | Elizabeth Hartley | 671 | 67.44 | ||
| Liberal Democrat | Rod Keyes | 324 | 32.56 | ||
| Majority | |||||
| Turnout | 995 | ||||
| Conservative hold | Swing | ||||
Gobowen, Selattyn and Weston Rhyn
| Party | Candidate | Votes | % | ± | |
|---|---|---|---|---|---|
| Conservative | Robert Macey | 826 | 26.78 | ||
| Conservative | Thomas Mark Jones | 748 | 24.25 | ||
| Labour | Craig David Emery | 397 | 12.87 | ||
| Green | Paul Herbert | 353 | 11.45 | ||
| Labour | Jack Roberts | 335 | 10.86 | ||
| Liberal Democrat | Henry John Stevens | 279 | 9.05 | ||
| Green | Stephen James Froggatt | 146 | 4.73 | ||
| Majority | |||||
| Majority | |||||
| Turnout | 3084 | ||||
| Conservative hold | Swing | ||||
| Conservative hold | Swing | ||||
Harlescott
| Party | Candidate | Votes | % | ± | |
|---|---|---|---|---|---|
| Labour | Ioan Gruffydd Jones | 552 | 57.14 | ||
| Conservative | Martin Richard Croll | 324 | 33.54 | ||
| UKIP | Marino Bernardo Pacini | 90 | 9.32 | ||
| Majority | |||||
| Turnout | 966 | ||||
| Labour hold | Swing | ||||
Highley
| Party | Candidate | Votes | % | ± | |
|---|---|---|---|---|---|
| Independent | Dave Tremellen | 427 | 43.13 | ||
| Conservative | Edward Gilliams | 282 | 28.48 | ||
| Labour | Nicki Barker | 170 | 17.17 | ||
| Independent | George Christopher Court | 111 | 11.21 | ||
| Majority | |||||
| Turnout | 990 | ||||
| Independent hold | Swing | ||||
Hodnet
| Party | Candidate | Votes | % | ± | |
|---|---|---|---|---|---|
| Conservative | Karen Calder | 716 | 82.02 | ||
| Labour | Charles Henry Warren Love | 157 | 17.98 | ||
| Majority | |||||
| Turnout | 873 | ||||
| Conservative hold | Swing | ||||
Llanymynech
| Party | Candidate | Votes | % | ± | |
|---|---|---|---|---|---|
| Conservative | Matt Lee | 671 | 62.07 | ||
| Green | Olly Rose | 249 | 23.03 | ||
| Liberal Democrat | John Alexander Thornton | 161 | 14.89 | ||
| Majority | |||||
| Turnout | 1081 | ||||
| Conservative hold | Swing | ||||
Longden
| Party | Candidate | Votes | % | ± | |
|---|---|---|---|---|---|
| Liberal Democrat | Roger Evans | 986 | 61.2 | ||
| Conservative | Catherine Angela Roberts | 560 | 34.76 | ||
| UKIP | Edward Arthur Higginbottom | 65 | 4.03 | ||
| Majority | |||||
| Turnout | 1611 | ||||
| Liberal Democrat hold | Swing | ||||
Loton
| Party | Candidate | Votes | % | ± | |
|---|---|---|---|---|---|
| Conservative | Ed Potter | 994 | 74.57 | ||
| Liberal Democrat | Lisa Michelle Walton | 213 | 15.98 | ||
| Green | Michelle Jane Sutton-Jones | 126 | 9.45 | ||
| Majority | |||||
| Turnout | 1333 | ||||
| Conservative hold | Swing | ||||
Ludlow East
| Party | Candidate | Votes | % | ± | |
|---|---|---|---|---|---|
| Liberal Democrat | Tracey Huffer | 678 | 64.2 | ||
| Conservative | Patricia Ann Price | 235 | 22.25 | ||
| Labour | Colin Eric James Sheward | 143 | 13.54 | ||
| Majority | |||||
| Turnout | 1056 | ||||
| Liberal Democrat hold | Swing | ||||
Ludlow North
| Party | Candidate | Votes | % | ± | |
|---|---|---|---|---|---|
| Liberal Democrat | Andy Boddington | 897 | 68.89 | ||
| Conservative | Simon Richard Harris | 303 | 23.27 | ||
| Green | Linda Mary Senior | 54 | 4.15 | ||
| UKIP | Chris Woodward | 48 | 3.69 | ||
| Majority | |||||
| Turnout | 1302 | ||||
| Liberal Democrat gain from Conservative | Swing | ||||
Ludlow South
| Party | Candidate | Votes | % | ± | |
|---|---|---|---|---|---|
| Liberal Democrat | Viv Parry | 918 | 65.81 | ||
| Conservative | Fiona Margaret Pizzoni | 376 | 26.95 | ||
| Labour | Michael John Penn | 101 | 7.24 | ||
| Majority | |||||
| Turnout | 1395 | ||||
| Liberal Democrat gain from Conservative | Swing | ||||
Market Drayton East
| Party | Candidate | Votes | % | ± | |
|---|---|---|---|---|---|
| Conservative | Roy Aldcroft | 829 | 73.23 | ||
| Labour | Rob Bentley | 303 | 26.77 | ||
| Majority | |||||
| Turnout | 1132 | ||||
| Conservative hold | Swing | ||||
Market Drayton West
| Party | Candidate | Votes | % | ± | |
|---|---|---|---|---|---|
| Conservative | David Minnery | 840 | 28.7 | ||
| Conservative | Roger Hughes | 835 | 28.53 | ||
| Labour | Darren Michael Taylor | 472 | 16.13 | ||
| Labour | Lin Surridge | 462 | 15.78 | ||
| Green | Rodger Sydney Bradley | 318 | 10.86 | ||
| Majority | |||||
| Majority | |||||
| Turnout | 2927 | ||||
| Conservative hold | Swing | ||||
| Conservative hold | Swing | ||||
Meole
| Party | Candidate | Votes | % | ± | |
|---|---|---|---|---|---|
| Conservative | Nic Laurens | 710 | 55.43 | ||
| Labour | Rod Turner | 352 | 27.48 | ||
| Liberal Democrat | Slawomir Adam Fejfer | 155 | 12.1 | ||
| Green | Tom Heyek | 64 | 5 | ||
| Majority | |||||
| Turnout | 1281 | ||||
| Conservative hold | Swing | ||||
Monkmoor
| Party | Candidate | Votes | % | ± | |
|---|---|---|---|---|---|
| Labour | Pam Moseley | 693 | 71.15 | ||
| Conservative | Valerie Adele Lingen-Jones | 281 | 28.85 | ||
| Majority | |||||
| Turnout | 974 | ||||
| Labour hold | Swing | ||||
Much Wenlock
| Party | Candidate | Votes | % | ± | |
|---|---|---|---|---|---|
| Conservative | David Turner | 0 | 0 | ||
| Majority | |||||
| Turnout | N/A | ||||
| Conservative hold | Swing | ||||
Oswestry East
| Party | Candidate | Votes | % | ± | |
|---|---|---|---|---|---|
| Conservative | John William Price | 778 | 25.63 | ||
| Conservative | Clare Victoria Aspinall | 605 | 19.93 | ||
| Independent | Peter Cherrington | 342 | 11.26 | ||
| Labour | Carl Hopley | 315 | 10.38 | ||
| Independent | Martin Bennett | 289 | 9.52 | ||
| Green | Mike Isherwood | 286 | 9.42 | ||
| Green | David Matthew Bennett | 254 | 8.37 | ||
| Liberal Democrat | Amanda Jane Woof | 97 | 3.19 | ||
| Liberal Democrat | Lee Kelvin Bennett | 70 | 2.31 | ||
| Majority | |||||
| Majority | |||||
| Turnout | 3036 | ||||
| Conservative gain from Independent | Swing | ||||
| Conservative hold | Swing | ||||
Oswestry South
| Party | Candidate | Votes | % | ± | |
|---|---|---|---|---|---|
| Conservative | David Paul Milner | 703 | 52.35 | ||
| Green | Duncan Kerr | 640 | 47.65 | ||
| Majority | |||||
| Turnout | 1343 | ||||
| Conservative hold | Swing | ||||
Oswestry West
| Party | Candidate | Votes | % | ± | |
|---|---|---|---|---|---|
| Conservative | Vince Hunt | 432 | 46.75 | ||
| Green | Barry John Edwards | 421 | 45.56 | ||
| Liberal Democrat | Romer Wilfred Hoseason | 71 | 7.68 | ||
| Majority | |||||
| Turnout | 924 | ||||
| Conservative hold | Swing | ||||
Porthill
| Party | Candidate | Votes | % | ± | |
|---|---|---|---|---|---|
| Green | Julian David Geoffrey Dean | 662 | 41.69 | ||
| Liberal Democrat | David Craddock | 431 | 27.14 | ||
| Conservative | Judie McCoy | 495 | 31.17 | ||
| Majority | |||||
| Turnout | 1588 | ||||
| Green gain from Liberal Democrat | Swing | ||||
Prees
| Party | Candidate | Votes | % | ± | |
|---|---|---|---|---|---|
| Conservative | Paul Wynn | 722 | 62.13 | ||
| Independent | Andrew Gordon Whyte | 440 | 37.87 | ||
| Majority | |||||
| Turnout | 1162 | ||||
| Conservative hold | Swing | ||||
Quarry and Coton Hill
| Party | Candidate | Votes | % | ± | |
|---|---|---|---|---|---|
| Liberal Democrat | Nat Green | 625 | 56.36 | ||
| Conservative | Arlinda Ballcaj | 356 | 32.1 | ||
| Green | Huw Richard Wystan Peach | 128 | 11.54 | ||
| Majority | |||||
| Turnout | 1109 | ||||
| Liberal Democrat hold | Swing | ||||
Radbrook
| Party | Candidate | Votes | % | ± | |
|---|---|---|---|---|---|
| Conservative | Keith Roberts | 809 | 58.62 | ||
| Liberal Democrat | Ian Edward Cartwright | 367 | 26.59 | ||
| Green | John Patrick Newnham | 204 | 14.78 | ||
| Majority | |||||
| Turnout | 1380 | ||||
| Conservative hold | Swing | ||||
Rea Valley
| Party | Candidate | Votes | % | ± | |
|---|---|---|---|---|---|
| Conservative | Nick Hignett | 803 | 55.23 | ||
| Liberal Democrat | Susan Catherine Lockwood | 565 | 38.86 | ||
| Green | Jonathan Colin Brown | 86 | 5.91 | ||
| Majority | |||||
| Turnout | 1454 | ||||
| Conservative hold | Swing | ||||
Ruyton and Baschurch
| Party | Candidate | Votes | % | ± | |
|---|---|---|---|---|---|
| Conservative | Nick Bardsley | 852 | 73.64 | ||
| Labour | Graeme Rodger Currie | 166 | 14.35 | ||
| Federalist Party | Robert John Jones | 79 | 6.83 | ||
| Liberal Democrat | Alex Jones | 60 | 5.19 | ||
| Majority | |||||
| Turnout | 1157 | ||||
| Conservative hold | Swing | ||||
Severn Valley
| Party | Candidate | Votes | % | ± | |
|---|---|---|---|---|---|
| Conservative | Claire Wild | 1077 | 80.01 | ||
| Green | Emma Bullard | 142 | 10.55 | ||
| Liberal Democrat | Fred Smith | 127 | 9.44 | ||
| Majority | |||||
| Turnout | 1346 | ||||
| Conservative hold | Swing | ||||
Shawbury
| Party | Candidate | Votes | % | ± | |
|---|---|---|---|---|---|
| Conservative | Simon Jones | 786 | 76.46 | ||
| Green | Steve Boulding | 242 | 23.54 | ||
| Conservative hold | Swing | ||||
Shifnal North
| Party | Candidate | Votes | % | ± | |
|---|---|---|---|---|---|
| Independent | Kevin Turley | 992 | 81.18 | ||
| Conservative | William Colin Cundy | 230 | 18.82 | ||
| Majority | |||||
| Turnout | 1222 | ||||
| Independent hold | Swing | ||||
Shifnal South and Cosford
| Party | Candidate | Votes | % | ± | |
|---|---|---|---|---|---|
| Conservative | Stuart West | 668 | 57.14 | ||
| Independent | Andy Mitchell | 368 | 31.48 | ||
| Liberal Democrat | Jolyon Thomas Hartin | 133 | 11.38 | ||
| Majority | |||||
| Turnout | 1169 | ||||
| Conservative hold | Swing | ||||
St Martin's
| Party | Candidate | Votes | % | ± | |
|---|---|---|---|---|---|
| Conservative | Steve Davenport | 674 | 66.54 | ||
| Labour | Neil Graham | 339 | 33.46 | ||
| Majority | |||||
| Turnout | 1013 | ||||
| Conservative hold | Swing | ||||
St Oswald
| Party | Candidate | Votes | % | ± | |
|---|---|---|---|---|---|
| Conservative | Joyce Barrow | 682 | 59.36 | ||
| Independent | Len Evans | 467 | 40.64 | ||
| Majority | |||||
| Turnout | 1149 | ||||
| Conservative hold | Swing | ||||
Sundorne
| Party | Candidate | Votes | % | ± | |
|---|---|---|---|---|---|
| Labour | Kevin Pardy | 618 | 73.92 | ||
| Conservative | Kayleigh Sarah Gough | 218 | 26.08 | ||
| Majority | |||||
| Turnout | 836 | ||||
| Labour hold | Swing | ||||
Tern
| Party | Candidate | Votes | % | ± | |
|---|---|---|---|---|---|
| Conservative | Lezley May Picton | 816 | 62.62 | ||
| Liberal Democrat | Helen Woodman | 205 | 15.73 | ||
| Labour Co-op | John Olaf Lewis | 204 | 15.66 | ||
| Green | Tony Newby | 78 | 5.99 | ||
| Majority | |||||
| Turnout | 1303 | ||||
| Conservative hold | Swing | ||||
The Meres
| Party | Candidate | Votes | % | ± | |
|---|---|---|---|---|---|
| Conservative | Brian Williams | 905 | 65.58 | ||
| Independent | Patrick James Manners | 193 | 13.99 | ||
| Liberal Democrat | Julian Marion Bushell | 165 | 11.96 | ||
| Green | Carlo Umberto Ferri | 117 | 8.48 | ||
| Majority | |||||
| Turnout | 1380 | ||||
| Conservative hold | Swing | ||||
Underdale
| Party | Candidate | Votes | % | ± | |
|---|---|---|---|---|---|
| Liberal Democrat | David George Vasmer | 339 | 36.37 | ||
| Labour | Peter Liebich | 272 | 29.18 | ||
| Conservative | Ken Vine | 257 | 27.58 | ||
| Green | Charlie Bell | 64 | 6.87 | ||
| Majority | |||||
| Turnout | 932 | ||||
| Liberal Democrat hold | Swing | ||||
Wem
| Party | Candidate | Votes | % | ± | |
|---|---|---|---|---|---|
| Liberal Democrat | John Mellings | 1444 | 35.13 | ||
| Independent | Pauline Dee | 1202 | 29.25 | ||
| Conservative | Peter Broomhall | 813 | 19.78 | ||
| Conservative | Mark Whittle | 396 | 9.64 | ||
| Green | Mel Draycott | 255 | 6.2 | ||
| Majority | |||||
| Majority | |||||
| Turnout | 4110 | ||||
| Liberal Democrat hold | Swing | ||||
| Independent hold | Swing | ||||
Whitchurch North
| Party | Candidate | Votes | % | ± | |
|---|---|---|---|---|---|
| Conservative | Peggy Mullock | 1016 | 41.66 | ||
| Conservative | Thomas Biggins | 681 | 27.92 | ||
| Green | Liz Lever | 421 | 17.36 | ||
| Liberal Democrat | Benedict John Alexander Jephcott | 188 | 7.71 | ||
| Green | William Lloyd Jones | 133 | 5.45 | ||
| Majority | |||||
| Majority | |||||
| Turnout | 2439 | ||||
| Conservative hold | Swing | ||||
| Conservative hold | Swing | ||||
Whitchurch South
| Party | Candidate | Votes | % | ± | |
|---|---|---|---|---|---|
| Conservative | Gerald Dakin | 422 | 52.62 | ||
| Liberal Democrat | Tom Thornhill | 156 | 19.45 | ||
| UKIP | Andrea Christabel Allen | 132 | 16.46 | ||
| Independent | William Morris Hilton | 92 | 11.47 | ||
| Majority | |||||
| Turnout | 802 | ||||
| Conservative hold | Swing | ||||
Whittington
| Party | Candidate | Votes | % | ± | |
|---|---|---|---|---|---|
| Conservative | Steve Charmley | 613 | 53.44 | ||
| Liberal Democrat | David Walker | 298 | 25.98 | ||
| Green | Edward David Goff | 152 | 13.25 | ||
| Independent | Christopher Lee Jones | 84 | 7.32 | ||
| Majority | |||||
| Turnout | 1147 | ||||
| Conservative hold | Swing | ||||
Worfield
| Party | Candidate | Votes | % | ± | |
|---|---|---|---|---|---|
| Conservative | Michael Wood | 754 | 76.78 | ||
| Labour | Ann Rochelle | 117 | 11.91 | ||
| Liberal Democrat | Helen Elizabeth Howell | 111 | 11.3 | ||
| Majority | |||||
| Turnout | 76.78 | ||||
| Conservative hold | Swing | ||||
References
- ↑ "Upcoming elections & referendums". Electoral Commission. Retrieved 15 September 2016.
- ↑ "Unitary results - May 4 2017". Shropshire Council. Retrieved 6 May 2017.
| Shropshire Council | |
|---|---|
| Telford and Wrekin Council | |
| Bridgnorth District Council |
|
| North Shropshire District Council |
|
| Oswestry Borough Council |
|
| Shrewsbury & Atcham Borough Council |
|
| South Shropshire District Council |
|
| |
This article is issued from
Wikipedia.
The text is licensed under Creative Commons - Attribution - Sharealike.
Additional terms may apply for the media files.