West Sussex County Council election, 2017
|
| |||||||||||||||||||||
| |||||||||||||||||||||
All 70 seats to West Sussex County Council 36 seats needed for a majority | |||||||||||||||||||||
|---|---|---|---|---|---|---|---|---|---|---|---|---|---|---|---|---|---|---|---|---|---|
| |||||||||||||||||||||
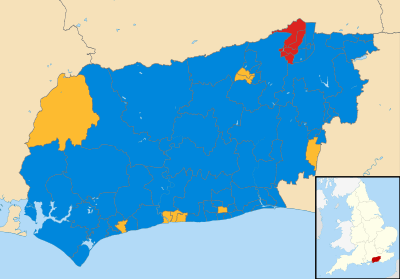 Map showing the results of the 2017 West Sussex County Council elections. | |||||||||||||||||||||
| |||||||||||||||||||||
The 2017 West Sussex County Council election took place as part of the 2017 local elections in the UK.[1] All councillors were elected for single-member electoral divisions for a four-year term. The voting system used was first-past-the-post.
Boundary changes to the electoral divisions took effect following a review by the Local Government Boundary Commission for England.[2]
The result was Conservative councillors formed an increased, 20-seat, majority on the council at the loss of the ten UKIP seats. The second-largest party grouping of councillors remained Liberal Democrats, gaining one seat to have nine seats and the balance of the council was formed by five Labour Party councillors, having lost one seat, net.
Results summary
| Party | Seats | Gains | Losses | Net gain/loss | Seats % | Votes % | Votes | +/− | |
|---|---|---|---|---|---|---|---|---|---|
| Conservative | 56 | 13 | 3 | +10 | 51.1 | 110,427 | |||
| Liberal Democrat | 9 | 3 | 2 | +1 | 19.2 | 41,428 | |||
| Labour | 5 | 0 | 1 | -1 | 15.7 | 33,915 | |||
| Green | 0 | - | 5.1 | 10,983 | |||||
| UKIP | 0 | 0 | 10 | -10 | 6.3 | 13,584 | |||
| Other parties | 0 | - | 2.6 | 5,674 | |||||
References
- ↑ "Upcoming elections & referendums". Electoral Commission. Retrieved 16 September 2016.
- ↑ "West Sussex County Council". Local Government Boundary Commission for England. Retrieved 16 September 2016.
- ↑ "West Sussex County Council election results 2017". West Sussex County Council. 2017-05-05. Retrieved 2017-05-10.
| West Sussex County Council | |
|---|---|
| Adur District Council | |
| Arun District Council | |
| Chichester District Council | |
| Crawley Borough Council | |
| Horsham District Council |
|
| Mid Sussex District Council | |
| Worthing Borough Council | |
| |
This article is issued from
Wikipedia.
The text is licensed under Creative Commons - Attribution - Sharealike.
Additional terms may apply for the media files.