Cambridgeshire County Council election, 2017
|
| |||||||||||||||||
| |||||||||||||||||
All 61 seats to Cambridgeshire County Council 31 seats needed for a majority | |||||||||||||||||
|---|---|---|---|---|---|---|---|---|---|---|---|---|---|---|---|---|---|
| |||||||||||||||||
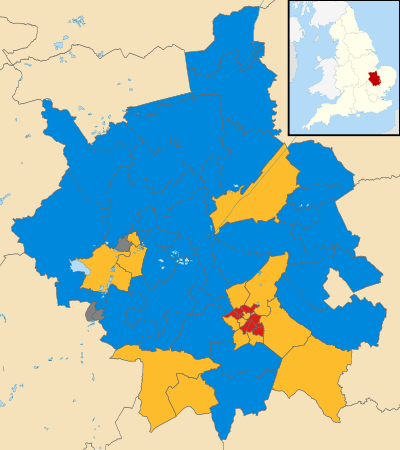 Map showing the results of the 2017 Cambridgeshire County Council elections. | |||||||||||||||||
| |||||||||||||||||
The 2017 Cambridgeshire County Council election was held on 4 May 2017 as part of the 2017 local elections in the United Kingdom.[1] All 61 councillors were elected from 59 electoral divisions, which returned either one or two county councillors each by first-past-the-post voting for a four-year term of office.
Boundary changes to the electoral divisions took effect at this election after a review of the county by the Local Government Boundary Commission for England,[2][3] reducing the number of county councillors from 69 to 61, and the number of electoral divisions from 60 to 59.
The election took place on the same day as the first direct mayoral election for the newly created Cambridgeshire and Peterborough Combined Authority.
The Conservative Party won a majority on the council, while the United Kingdom Independence Party lost all their seats.[4]
Results summary
| Party | Seats | Gains | Losses | Net gain/loss | Seats % | Votes % | Votes | +/− | |
|---|---|---|---|---|---|---|---|---|---|
| Conservative | 36 | +8[lower-alpha 1] | 59.0 | 40.6 | 73,145 | +7% | |||
| Liberal Democrat | 15 | +2 | 24.6 | 29.7 | 53,485 | +10% | |||
| Labour | 7 | +1 | 11.5 | 18.2 | 32,864 | +0.8% | |||
| Independent | 3[lower-alpha 2] | +1 | 4.9 | 4.2 | 7,487 | 0% | |||
| Green | 0 | 0 | 0 | 3.7 | 6,744 | +0.4% | |||
| UKIP | 0 | −12 | 0 | 3.7 | 6,555 | −17.6% | |||
Results by district
All electoral divisions elected one councillor unless stated otherwise.
Cambridge (12 seats)
| Party | Candidate | Votes | % | ± | |
|---|---|---|---|---|---|
| Labour | Joan Whitehead | 1,022 | 40.6 | -12.8 | |
| Liberal Democrat | Nicky Shepard | 947 | 37.6 | +26.5 | |
| Conservative | Kevin Francis | 336 | 13.3 | -3.8 | |
| Green | Monica Hone | 212 | 8.4 | -10.1 | |
| Turnout | 2,517 | ||||
| Labour hold | Swing | -19.2 | |||
| Party | Candidate | Votes | % | ± | |
|---|---|---|---|---|---|
| Labour | Jocelynne Scutt | 1,331 | 44.8 | -4.6 | |
| Liberal Democrat | Cecilia Liszka | 919 | 30.9 | +14.1 | |
| Conservative | Henry Collins | 542 | 18.3 | +6.8 | |
| Green | Lucas Ruzowitzky | 177 | 5.9 | -4.0 | |
| Turnout | 2,969 | ||||
| Labour hold | Swing | ||||
| Party | Candidate | Votes | % | ± | |
|---|---|---|---|---|---|
| Labour | Claire Richards | 777 | 29.8 | +13.1 | |
| Independent | John Hipkin | 750 | 28.7 | -12.3 | |
| Liberal Democrat | Paul Sagar | 736 | 28.2 | -4.4 | |
| Conservative | Edward MacNaghten | 199 | 7.6 | +1.9 | |
| Green | Gareth Bailey | 147 | 5.6 | N/A | |
| Turnout | 2,609 | ||||
| Labour gain from Independent | Swing | ||||
| Party | Candidate | Votes | % | ± | |
|---|---|---|---|---|---|
| Labour | Sandra Crawford | 1,555 | 48.8 | -9.7 | |
| Conservative | James Mathieson | 718 | 22.5 | -0.4 | |
| Liberal Democrat | John Oakes | 699 | 21.9 | +14.1 | |
| Green | Maximilian Fries | 215 | 6.7 | -4.1 | |
| Turnout | 3,187 | ||||
| Labour hold | Swing | ||||
| Party | Candidate | Votes | % | ± | |
|---|---|---|---|---|---|
| Liberal Democrat | Ian Manning | 1,715 | 44.1 | N/A | |
| Labour | Kelley Green | 1,407 | 36.2 | N/A | |
| Conservative | Connor MacDonald | 481 | 12.4 | N/A | |
| Green | Stephen Lawrence | 199 | 5.1 | N/A | |
| UKIP | Peter Burkinshaw | 88 | 2.3 | N/A | |
| Turnout | 3,890 | ||||
| Liberal Democrat win (new seat) | |||||
| Party | Candidate | Votes | % | ± | |
|---|---|---|---|---|---|
| Labour | Elisa Meschini | 1,247 | 40.1 | -8.8 | |
| Liberal Democrat | Jamie Dalzell | 1,056 | 33.9 | +14.7 | |
| Conservative | Anette Karimi | 427 | 13.7 | -1.6 | |
| Green | Angela Ditchfield | 211 | 6.8 | N/A | |
| UKIP | David Corn | 170 | 5.5 | N/A | |
| Turnout | 3,111 | ||||
| Labour hold | Swing | ||||
| Party | Candidate | Votes | % | ± | |
|---|---|---|---|---|---|
| Liberal Democrat | Nichola Harrison | 965 | 41.9 | +8.8 | |
| Labour | Nick Gay | 678 | 29.4 | -0.8 | |
| Green | Jeremy Caddick | 425 | 18.4 | -0.3 | |
| Conservative | Henry Mitson | 237 | 10.3 | -7.7 | |
| Turnout | 2,305 | ||||
| Liberal Democrat hold | Swing | ||||
| Party | Candidate | Votes | % | ± | |
|---|---|---|---|---|---|
| Liberal Democrat | Lucy Nethsingha | 1,221 | 51.2 | +8.0 | |
| Labour | Joe Dale | 673 | 28.2 | -7.6 | |
| Conservative | Julius Carrington | 299 | 12.5 | 0.0 | |
| Green | Mark Slade | 193 | 8.1 | -0.5 | |
| Turnout | 2,386 | ||||
| Liberal Democrat hold | Swing | ||||
| Party | Candidate | Votes | % | ± | |
|---|---|---|---|---|---|
| Labour | Linda Jones | 1,410 | 41.2 | -14.7 | |
| Liberal Democrat | Emma Bates | 1,161 | 33.9 | +17.9 | |
| Green | Virgil Ierubino | 467 | 13.6 | -2.2 | |
| Conservative | Linda Yeatman | 388 | 11.3 | -0.9 | |
| Turnout | 3,426 | ||||
| Labour hold | Swing | ||||
| Party | Candidate | Votes | % | ± | |
|---|---|---|---|---|---|
| Liberal Democrat | Amanda Taylor | 1,678 | 46.4 | +1.6 | |
| Labour | Adam Pounds | 962 | 26.6 | -8.5 | |
| Conservative | Manas Deb | 752 | 20.8 | +7.2 | |
| Green | Joel Chalfen | 226 | 6.2 | +0.3 | |
| Turnout | 3,618 | ||||
| Liberal Democrat hold | Swing | ||||
| Party | Candidate | Votes | % | ± | |
|---|---|---|---|---|---|
| Labour | Noel Kavanagh | 1,633 | 44.7 | +13.0 | |
| Liberal Democrat | Simon Cooper | 1,359 | 37.2 | -10.7 | |
| Conservative | Simon Lee | 335 | 9.2 | +4.8 | |
| Green | Caitlin Patterson | 329 | 8.9 | +3.0 | |
| Turnout | 3,656 | ||||
| Labour gain from Liberal Democrat | Swing | ||||
| Party | Candidate | Votes | % | ± | |
|---|---|---|---|---|---|
| Liberal Democrat | Donald Adey | 1,116 | 39.0 | +2.0 | |
| Labour | Katie Thornburrow | 847 | 29.6 | +13.7 | |
| Conservative | Shapour Meftah | 694 | 24.3 | -11.3 | |
| Green | Ceri Galloway | 204 | 7.1 | -4.3 | |
| Turnout | 2,861 | ||||
| Liberal Democrat hold | Swing | ||||
East Cambridgeshire (8 seats)
| Party | Candidate | Votes | % | ± | |
|---|---|---|---|---|---|
| Conservative | Josh Schumann | 1,557 | 53.9 | +7.8 | |
| Liberal Democrat | Charlotte Cane | 642 | 22.2 | +1.9 | |
| Labour | Liz Swift | 381 | 13.2 | -1.1 | |
| Green | FloraMay Waterhouse | 309 | 10.7 | N/A | |
| Turnout | 2,889 | ||||
| Conservative hold | Swing | ||||
| Party | Candidate | Votes | % | ± | |
|---|---|---|---|---|---|
| Conservative | Lis Every | 1,192 | 49.3 | N/A | |
| Liberal Democrat | Alison Whelan | 855 | 35.4 | N/A | |
| Labour | Mark Hucker | 370 | 15.3 | N/A | |
| Turnout | 2,417 | ||||
| Conservative win (new seat) | |||||
| Party | Candidate | Votes | % | ± | |
|---|---|---|---|---|---|
| Conservative | Anna Bailey | 1,627 | 46.1 | N/A | |
| Liberal Democrat | Christine Whelan | 1,368 | 38.7 | N/A | |
| Labour | Rebecca Denness | 536 | 15.2 | N/A | |
| Turnout | 3,531 | ||||
| Conservative win (new seat) | |||||
| Party | Candidate | Votes | % | ± | |
|---|---|---|---|---|---|
| Conservative | David Ambrose Smith | 863 | 57.2 | +27.9 | |
| Labour | Jane Frances | 335 | 22.2 | +7.0 | |
| Liberal Democrat | Martin Seidel | 310 | 20.6 | +1.0 | |
| Turnout | 1,508 | ||||
| Conservative gain from UKIP | Swing | ||||
| Party | Candidate | Votes | % | ± | |
|---|---|---|---|---|---|
| Conservative | Paul Raynes | 1,504 | 66.2 | N/A | |
| Liberal Democrat | Rupert Moss-Eccardt | 396 | 17.4 | N/A | |
| Labour | Isobel Morris | 371 | 16.3 | N/A | |
| Turnout | 2,271 | ||||
| Conservative win (new seat) | |||||
| Party | Candidate | Votes | % | ± | |
|---|---|---|---|---|---|
| Conservative | Bill Hunt | 1,828 | 57.7 | ||
| Liberal Democrat | Pauline Wilson | 826 | 26.1 | ||
| Labour | Lydia Hill | 320 | 10.1 | ||
| Green | Andy Cogan | 193 | 6.1 | ||
| Turnout | 3,167 | ||||
| Conservative win | |||||
| Party | Candidate | Votes | % | ± | |
|---|---|---|---|---|---|
| Liberal Democrat | Lorna Dupre | 1,441 | 45.8 | ||
| Conservative | Michael Bradley | 1,353 | 42.9 | ||
| Labour | Christopher Horne | 355 | 11.3 | ||
| Turnout | 3,149 | ||||
| Liberal Democrat win | |||||
| Party | Candidate | Votes | % | ± | |
|---|---|---|---|---|---|
| Conservative | Mathew Shuter | 1,676 | 67.4 | ||
| Liberal Democrat | John Trapp | 767 | 30.9 | ||
| Labour | Steven O'Dell | 426 | |||
| Turnout | 2,485 | ||||
| Conservative win | |||||
Fenland (9 seats)
| Party | Candidate | Votes | % | ± | |
|---|---|---|---|---|---|
| Conservative | Anne Hay | 1,086 | 48.5 | ||
| UKIP | Dick Mandley | 429 | 19.1 | ||
| Independent | Steve Nicholson | 201 | 8.9 | ||
| Labour | David Lewis | 178 | 7.9 | ||
| Liberal Democrat | John Freeman | 176 | 7.9 | ||
| Independent | Daniel Divine | 171 | 7.6 | ||
| Turnout | 2,241 | ||||
| Conservative gain from UKIP | Swing | ||||
| Party | Candidate | Votes | % | ± | |
|---|---|---|---|---|---|
| Conservative | Steve Count | 2,263 | 26.7 | ||
| Conservative | Jan French | 2,094 | 24.7 | ||
| Labour | Katharine Bultitude | 856 | 10.1 | ||
| Labour | Martin Field | 850 | 10.0 | ||
| Liberal Democrat | Stephen Court | 605 | 7.1 | ||
| UKIP | Caroline Smith | 561 | 6.6 | ||
| UKIP | Robin Talbot | 481 | 5.7 | ||
| Liberal Democrat | Scott Lansdell-Hill | 340 | 4.0 | ||
| Green | Ruth Johnson | 248 | 2.9 | ||
| Green | Andrew Crawford | 191 | 2.3 | ||
| Turnout | 8,489 | ||||
| Conservative win | |||||
| Conservative win | |||||
| Party | Candidate | Votes | % | ± | |
|---|---|---|---|---|---|
| Conservative | John Gowing | 969 | 39.8 | ||
| Independent | Rob Skoulding | 910 | 37.3 | ||
| Labour | Steven Smith | 174 | 7.1 | ||
| UKIP | Daniel Spencer | 157 | 6.4 | ||
| Liberal Democrat | Neil Morrison | 126 | 5.2 | ||
| Green | Elizabeth Wright | 102 | 4.2 | ||
| Turnout | 2,438 | ||||
| Conservative win | |||||
| Party | Candidate | Votes | % | ± | |
|---|---|---|---|---|---|
| Conservative | Simon King | 1,455 | 54.2 | ||
| Liberal Democrat | Gavin Booth | 615 | 22.9 | ||
| UKIP | Chris Schooling | 364 | 13.6 | ||
| Labour | Jes Hibbert | 252 | 9.4 | ||
| Turnout | 2,686 | ||||
| Conservative gain from UKIP | Swing | ||||
| Party | Candidate | Votes | % | ± | |
|---|---|---|---|---|---|
| Conservative | Christopher Boden | 1,365 | 65.7 | ||
| Labour | Steve Jansky | 279 | 13.4 | ||
| UKIP | Dawn Rhys-Owain | 244 | 11.7 | ||
| Green | Alex Oates | 97 | 4.7 | ||
| Liberal Democrat | Frank Bellard | 93 | 4.5 | ||
| Turnout | 2,078 | ||||
| Conservative win | |||||
| Party | Candidate | Votes | % | ± | |
|---|---|---|---|---|---|
| Conservative | David Connor | 1,692 | 66.4 | ||
| UKIP | Dai Rhys-Owain | 266 | 10.4 | ||
| Labour | Martin Lodziak | 247 | 9.7 | ||
| Liberal Democrat | Graham Kitchen | 192 | 7.5 | ||
| Green | Karen Alexander | 150 | 5.9 | ||
| Turnout | 2,547 | ||||
| Conservative win | |||||
| Party | Candidate | Votes | % | ± | |
|---|---|---|---|---|---|
| Conservative | Samantha Hoy | 1,284 | 63.2 | ||
| Labour | Sue Marshall | 306 | 15.1 | ||
| UKIP | Susan Carson | 243 | 11.9 | ||
| Independent | Fay Allen | 135 | 6.6 | ||
| Liberal Democrat | Gareth Wilson | 64 | 3.2 | ||
| Turnout | 2,032 | ||||
| Conservative win | |||||
| Party | Candidate | Votes | % | ± | |
|---|---|---|---|---|---|
| Conservative | Steve Tierney | 1,076 | 61.0 | ||
| UKIP | Paul Clapp | 211 | 11.9 | ||
| Labour | Tina Eyres | 190 | 10.8 | ||
| Independent | Sharon Home | 119 | 6.8 | ||
| Green | Jane Feaviour-Clarke | 70 | 3.9 | ||
| Liberal Democrat | Christopher Ross | 61 | 3.5 | ||
| Independent | Jonathan Miller | 37 | 2.1 | ||
| Turnout | 1,764 | ||||
| Conservative gain from UKIP | Swing | ||||
Huntingdonshire (17 seats)
| Party | Candidate | Votes | % | ± | |
|---|---|---|---|---|---|
| Conservative | Ian Gardener | 1,943 | 61.7 | ||
| Liberal Democrat | Michael Baker | 973 | 30.9 | ||
| Labour | Kevin Goddard | 231 | 7.3 | ||
| Turnout | 3,147 | ||||
| Conservative win | |||||
| Party | Candidate | Votes | % | ± | |
|---|---|---|---|---|---|
| Liberal Democrat | Peter Downes | 1,536 | 48.6 | ||
| Conservative | Hamish Masson | 1,422 | 44.9 | ||
| Labour | Sue Foster | 205 | 6.5 | ||
| Turnout | 3,163 | ||||
| Liberal Democrat win | |||||
| Party | Candidate | Votes | % | ± | |
|---|---|---|---|---|---|
| Liberal Democrat | Graham Wilson | 1,194 | 52.3 | ||
| Conservative | Bill Hensley | 656 | 28.7 | ||
| Labour | Samuel Sweek | 282 | 12.4 | ||
| UKIP | Dan Morris | 152 | 6.7 | ||
| Turnout | 2,284 | ||||
| Liberal Democrat win | |||||
| Party | Candidate | Votes | % | ± | |
|---|---|---|---|---|---|
| Liberal Democrat | Michael Shellens | 882 | 35.0 | ||
| Conservative | Emily Barley | 838 | 33.3 | ||
| Labour | Nik Johnson | 532 | 21.1 | ||
| UKIP | Peter Ashcroft | 265 | 10.5 | ||
| Turnout | 2,517 | ||||
| Liberal Democrat gain from UKIP | Swing | ||||
| Party | Candidate | Votes | % | ± | |
|---|---|---|---|---|---|
| Independent | Tom Sanderson | 1,018 | 48.6 | ||
| Conservative | Peter Brown | 532 | 25.4 | ||
| Liberal Democrat | Joe Jordan | 299 | 14.3 | ||
| Labour | Patrick Kadewere | 247 | 11.8 | ||
| Turnout | 2,096 | ||||
| Independent gain from Conservative | Swing | ||||
| Party | Candidate | Votes | % | ± | |
|---|---|---|---|---|---|
| Conservative | Adela Costello | 1,296 | 45.1 | ||
| UKIP | Peter Reeve | 1,152 | 40.1 | ||
| Labour | Kevin Minnette | 260 | 9.1 | ||
| Liberal Democrat | Alex Wasyliw | 163 | 5.7 | ||
| Turnout | 2,871 | ||||
| Conservative gain from UKIP | Swing | ||||
| Party | Candidate | Votes | % | ± | |
|---|---|---|---|---|---|
| Conservative | Simon Bywater | 2,022 | 68.8 | ||
| Labour | Margaret Cochrane | 405 | 13.8 | ||
| UKIP | Roger Henson | 269 | 9.2 | ||
| Liberal Democrat | Geoff Harvey | 244 | 8.3 | ||
| Turnout | 2,940 | ||||
| Conservative win | |||||
| Party | Candidate | Votes | % | ± | |
|---|---|---|---|---|---|
| Conservative | Steve Criswell | 1,862 | 68.2 | ||
| Liberal Democrat | Tony Jebson | 393 | 14.4 | ||
| Labour | Iain Ramsbottom | 299 | 10.9 | ||
| UKIP | Callum Duffy | 178 | 6.5 | ||
| Turnout | 2,732 | ||||
| Conservative win | |||||
| Party | Candidate | Votes | % | ± | |
|---|---|---|---|---|---|
| Conservative | Ryan Fuller | 1,223 | 54.2 | ||
| Liberal Democrat | David Hodge | 404 | 17.9 | ||
| Labour | Sam Feeney | 391 | 17.3 | ||
| UKIP | Margaret King | 238 | 10.5 | ||
| Turnout | 2,256 | ||||
| Conservative gain from UKIP | Swing | ||||
| Party | Candidate | Votes | % | ± | |
|---|---|---|---|---|---|
| Conservative | Kevin Reynolds | 1,491 | 59.3 | ||
| Labour | John Watson | 537 | 21.3 | ||
| Liberal Democrat | Lakkana Yalagala | 488 | 19.4 | ||
| Turnout | 2,516 | ||||
| Conservative win | |||||
| Party | Candidate | Votes | % | ± | |
|---|---|---|---|---|---|
| Conservative | Julie Wisson | 865 | 52.6 | ||
| Liberal Democrat | James Catmur | 375 | 22.8 | ||
| Your Community my priority | James Corley | 218 | 13.2 | ||
| Labour | Stephen Hinchley | 188 | 11.4 | ||
| Turnout | 1,646 | ||||
| Conservative win | |||||
| Party | Candidate | Votes | % | ± | |
|---|---|---|---|---|---|
| St Neots Independent Group | Simone Taylor | 818 | 43.4 | ||
| Conservative | Robert Moores | 649 | 34.5 | ||
| Liberal Democrat | Claire Piper | 228 | 12.1 | ||
| Labour | Sam Wakeford | 189 | 10.0 | ||
| Turnout | 1,884 | ||||
| St Neots Independent Group win | |||||
| Party | Candidate | Votes | % | ± | |
|---|---|---|---|---|---|
| Conservative | David Wells | 1,069 | 42.9 | ||
| Liberal Democrat | Carol McMahon | 599 | 24.1 | ||
| Your Community my priority | Paul Davies | 565 | 22.7 | ||
| Labour | Christine Green | 255 | 10.3 | ||
| Turnout | 2,488 | ||||
| Conservative win | |||||
| Party | Candidate | Votes | % | ± | |
|---|---|---|---|---|---|
| St Neots Independent Group | Derek Giles | 1,506 | 46.3 | ||
| Conservative | Beth Hughes | 893 | 27.4 | ||
| Independent | Bob Farrer | 388 | 11.9 | ||
| Liberal Democrat | James Bartrick | 250 | 7.7 | ||
| Labour | Rob Gardiner | 217 | 6.7 | ||
| Turnout | 3,254 | ||||
| St Neots Independent Group win | |||||
| Party | Candidate | Votes | % | ± | |
|---|---|---|---|---|---|
| Conservative | Ian Bates | 1,766 | 62.2 | ||
| Liberal Democrat | David Priestman | 785 | 27.6 | ||
| Labour | Robert Leach | 289 | 10.2 | ||
| Turnout | 2,840 | ||||
| Conservative win | |||||
| Party | Candidate | Votes | % | ± | |
|---|---|---|---|---|---|
| Conservative | Terry Rogers | 1,142 | 62.4 | ||
| UKIP | Paul Bullen | 273 | 14.9 | ||
| Liberal Democrat | Tony Hulme | 248 | 13.6 | ||
| Labour Co-op | Graeme Watkins | 166 | 9.1 | ||
| Turnout | 1,829 | ||||
| Conservative win | |||||
| Party | Candidate | Votes | % | ± | |
|---|---|---|---|---|---|
| Conservative | Mac McGuire | 1,118 | 52.4 | ||
| Labour | Jonathan Orchard | 558 | 26.2 | ||
| UKIP | Paul Richardson | 457 | 21.4 | ||
| Turnout | 2,133 | ||||
| Conservative win | |||||
South Cambridgeshire (15 seats)
| Party | Candidate | Votes | % | ± | |
|---|---|---|---|---|---|
| Conservative | Lynda Harford | 1,202 | 40.1 | ||
| Liberal Democrat | Mark Argent | 836 | 27.9 | ||
| Labour | Stuart Hilpert | 550 | 18.4 | ||
| Green | Teal Riley | 252 | 8.4 | ||
| UKIP | Helena Green | 158 | 5.3 | ||
| Turnout | 2,998 | 42.4 | |||
| Conservative win | |||||
| Party | Candidate | Votes | % | ± | |
|---|---|---|---|---|---|
| Conservative | Mark Howell | 1,145 | 43.3 | ||
| Liberal Democrat | Peter Hedges | 721 | 27.3 | ||
| Labour | Gavin Clayton | 590 | 22.3 | ||
| Green | Marcus Pitcaithly | 190 | 7.2 | ||
| Turnout | 2,646 | 33.3 | |||
| Conservative win | |||||
| Party | Candidate | Votes | % | ± | |
|---|---|---|---|---|---|
| Conservative | Timothy Wotherspoon | 1,207 | 35.3 | ||
| Liberal Democrat | Neil Gough | 1,205 | 35.3 | ||
| Labour | Alex Tiley | 421 | 12.3 | ||
| Independent | Mike Mason | 412 | 12.1 | ||
| Green | Colin Coe | 173 | 5.1 | ||
| Turnout | 3,418 | 42.1 | |||
| Conservative gain from Independent | Swing | ||||
| Party | Candidate | Votes | % | ± | |
|---|---|---|---|---|---|
| Conservative | Peter Topping | 2,066 | 55.1 | ||
| Liberal Democrat | Peter McDonald | 1,248 | 33.3 | ||
| Labour | Jackie Scott | 286 | 7.6 | ||
| Green | Matthew Barton | 148 | 3.9 | ||
| Turnout | 3,748 | 46.3 | |||
| Conservative win | |||||
| Party | Candidate | Votes | % | ± | |
|---|---|---|---|---|---|
| Liberal Democrat | John Williams | 1,217 | 43.4 | ||
| Conservative | Alan Sharp | 899 | 32.1 | ||
| Labour | Tim Andrews | 548 | 19.5 | ||
| Green | Oliver Fisher | 141 | 5.0 | ||
| Turnout | 2,805 | 39.9 | |||
| Liberal Democrat win | |||||
| Party | Candidate | Votes | % | ± | |
|---|---|---|---|---|---|
| Liberal Democrat | Sebastian Kindersley | 1,505 | 42.2 | ||
| Conservative | Heather Williams | 1,448 | 40.6 | ||
| Independent | Alison Elcox | 374 | 10.5 | ||
| Labour | John Goodall | 237 | 6.7 | ||
| Turnout | 3,564 | 43.3 | |||
| Liberal Democrat win | |||||
| Party | Candidate | Votes | % | ± | |
|---|---|---|---|---|---|
| Conservative | Lina Joseph | 1,840 | 49.9 | ||
| Liberal Democrat | Philip Allen | 1,369 | 37.1 | ||
| Labour | Norman Crowther | 456 | 12.4 | ||
| Green | Anna Gomori-Woodcock | 258 | 6.6 | ||
| Turnout | 3,923 | 45.4 | |||
| Conservative win | |||||
| Party | Candidate | Votes | % | ± | |
|---|---|---|---|---|---|
| Liberal Democrat | John Jenkins | 1,938 | 53.9 | ||
| Conservative | Othman Cole | 834 | 23.2 | ||
| Labour | Beccy Talmy | 602 | 16.7 | ||
| Green | Darren Cotterell | 224 | 6.2 | ||
| Turnout | 3,598 | 43.6 | |||
| Liberal Democrat win | |||||
| Party | Candidate | Votes | % | ± | |
|---|---|---|---|---|---|
| Liberal Democrat | Henry Batchelor | 1,957 | 47.6 | ||
| Conservative | John Bald | 1,579 | 38.4 | ||
| Green | Paul Richardson | 293 | 7.1 | ||
| Labour | Ernie Turkington | 282 | 6.7 | ||
| Turnout | 4,111 | 48.4 | |||
| Liberal Democrat gain from Conservative | Swing | ||||
| Party | Candidate | Votes | % | ± | |
|---|---|---|---|---|---|
| Conservative | Peter Hudson | 1,112 | 45.9 | ||
| Liberal Democrat | Sarah Cheung Johnson | 965 | 39.8 | ||
| Labour | Simon Down | 226 | 9.3 | ||
| Green | Sandra Archer | 119 | 4.9 | ||
| Turnout | 2,422 | 40.8 | |||
| Conservative win | |||||
| Party | Candidate | Votes | % | ± | |
|---|---|---|---|---|---|
| Liberal Democrat | Susan van de Ven | 1,693 | 56.2 | ||
| Conservative | Joshua Huntingfield | 773 | 25.7 | ||
| UKIP | Adrian Dent | 199 | 6.6 | ||
| Green | Simon Saggers | 174 | 5.8 | ||
| Labour | Chris Coleridge | 173 | 5.7 | ||
| Turnout | 3,012 | 38.8 | |||
| Liberal Democrat win | |||||
| Party | Candidate | Votes | % | ± | |
|---|---|---|---|---|---|
| Conservative | Mandy Smith | 1,495 | 55.9 | ||
| Liberal Democrat | Peter Sandford | 660 | 24.7 | ||
| Labour | Darren Macey | 305 | 11.4 | ||
| Green | Gaynor Clements | 211 | 7.9 | ||
| Turnout | 2,671 | 36.9 | |||
| Conservative win | |||||
| Party | Candidate | Votes | % | ± | |
|---|---|---|---|---|---|
| Conservative | Kevin Cuffley | 2,698 | 21.4 | −2.0 | |
| Conservative | Roger Hickford | 2,584 | 20.0 | −2.9 | |
| Liberal Democrat | Peter Fane | 2,528 | 20.0 | +11.3 | |
| Liberal Democrat | Brian Milnes | 2,427 | 19.2 | +10.5 | |
| Labour | Mike Nettleton | 1,194 | 9.5 | −1.4 | |
| Labour | Sue Whitney | 1,186 | 9.4 | −1.5 | |
| Turnout | 12,617 | 45.5 | +13.3 | ||
| Conservative win | |||||
| Conservative win | |||||
| Party | Candidate | Votes | % | ± | |
|---|---|---|---|---|---|
| Liberal Democrat | Anna Bradnam | 1,706 | 46.4 | ||
| Conservative | George Walker | 1,184 | 32.2 | ||
| Labour | Gareth Wright | 591 | 16.1 | ||
| Green | Eleanor Crane | 196 | 5.3 | ||
| Turnout | 3,677 | 43.6 | |||
| Liberal Democrat win | |||||
References
- ↑ "Upcoming elections & referendums". Electoral Commission. Retrieved 16 September 2016.
- ↑ "Cambridgeshire County Council". Local Government Boundary Commission for England. Retrieved 16 September 2016.
- ↑ UK Parliament. The Cambridgeshire (Electoral Changes) Order 2016 as made, from legislation.gov.uk.
- ↑ Paul Brackley (2017-05-05). "Cambridgeshire County Council election results: Conservatives take control and UKIP wiped out". Cambridge Independent. Retrieved 2017-05-05.
- ↑ "Cambridgeshire County Council election results 2017". Cambridgeshire County Council. 2017-05-05. Retrieved 2017-05-05.
- ↑ "Cambridgeshire County Council". BBC News. 5 May 2017. Retrieved 6 May 2017.
- 1 2 3 4 5 6 7 8 9 10 11 12 "Statement of Persons Nominated" (PDF). Cambridge City Council. 4 April 2017. Retrieved 4 April 2017.
- ↑ "Statement of Persons Nominated - Burwell Division" (PDF). East Cambridgeshire District Council. 5 April 2017. Retrieved 5 April 2017.
- ↑ "Statement of Persons Nominated - Ely North Division" (PDF). East Cambridgeshire District Council. 5 April 2017. Retrieved 5 April 2017.
- ↑ "Statement of Persons Nominated - Ely South Division" (PDF). East Cambridgeshire District Council. 5 April 2017. Retrieved 5 April 2017.
- ↑ "Statement of Persons Nominated - Littleport Division" (PDF). East Cambridgeshire District Council. 5 April 2017. Retrieved 5 April 2017.
- ↑ "Statement of Persons Nominated - Soham North & Isleham Division" (PDF). East Cambridgeshire District Council. 5 April 2017. Retrieved 5 April 2017.
- ↑ "Statement of Persons Nominated - Soham South & Haddenham Division" (PDF). East Cambridgeshire District Council. 5 April 2017. Retrieved 5 April 2017.
- ↑ "Statement of Persons Nominated - Sutton Division" (PDF). East Cambridgeshire District Council. 5 April 2017. Retrieved 5 April 2017.
- ↑ "Statement of Persons Nominated - Woodditton Division" (PDF). East Cambridgeshire District Council. 5 April 2017. Retrieved 5 April 2017.
- ↑ "Statement of Persons Nominated - Chatteris Electoral Division of Cambridgeshire County Council". Fenland District Council. 4 April 2017. Retrieved 4 April 2017.
- ↑ "Statement of Persons Nominated - March North & Waldersey Electoral Division of Cambridgeshire County Council". Fenland District Council. 4 April 2017. Retrieved 4 April 2017.
- ↑ "Statement of Persons Nominated - March South & Rural Electoral Division of Cambridgeshire County Council". Fenland District Council. 4 April 2017. Retrieved 4 April 2017.
- ↑ "Statement of Persons Nominated - Roman Bank & Peckover Electoral Division of Cambridgeshire County Council". Fenland District Council. 4 April 2017. Retrieved 4 April 2017.
- ↑ "Statement of Persons Nominated - Whittlesey North Electoral Division of Cambridgeshire County Council". Fenland District Council. 4 April 2017. Retrieved 4 April 2017.
- ↑ "Statement of Persons Nominated - Whittlesey South Electoral Division of Cambridgeshire County Council". Fenland District Council. 4 April 2017. Retrieved 4 April 2017.
- ↑ "Statement of Persons Nominated - Wisbech East Electoral Division of Cambridgeshire County Council". Fenland District Council. 4 April 2017. Retrieved 4 April 2017.
- ↑ "Statement of Persons Nominated - Wisbech West Electoral Division of Cambridgeshire County Council". Fenland District Council. 4 April 2017. Retrieved 4 April 2017.
- 1 2 3 4 5 6 7 8 9 10 11 12 13 14 15 16 17 "Statement of Persons Nominated" (PDF). Huntingdonshire District Council. 5 April 2017. Retrieved 5 April 2017.
- 1 2 3 4 5 6 7 8 9 10 11 12 13 14 "Statement of Persons Nominated" (PDF). South Cambridgeshire District Council. 4 April 2017. Retrieved 4 April 2017.
| Cambridgeshire County Council | |
|---|---|
| Peterborough City Council | |
| Cambridge City Council | |
| East Cambridgeshire District Council |
|
| Fenland District Council | |
| Huntingdonshire District Council | |
| South Cambridgeshire District Council | |
| Isle of Ely County Council |
|
| Huntingdon & Peterborough County Council |
|
| Mayor of Cambridgeshire and Peterborough | |
| |