Liverpool City Council election, 2018
|
| |||||||||||||||||||||||||||||||||||||||||||||||||||||||||||||||||||||||||||||
| |||||||||||||||||||||||||||||||||||||||||||||||||||||||||||||||||||||||||||||
31 of 90 seats (One Third and one by-election) to Liverpool City Council 46 seats needed for a majority | |||||||||||||||||||||||||||||||||||||||||||||||||||||||||||||||||||||||||||||
|---|---|---|---|---|---|---|---|---|---|---|---|---|---|---|---|---|---|---|---|---|---|---|---|---|---|---|---|---|---|---|---|---|---|---|---|---|---|---|---|---|---|---|---|---|---|---|---|---|---|---|---|---|---|---|---|---|---|---|---|---|---|---|---|---|---|---|---|---|---|---|---|---|---|---|---|---|---|
| |||||||||||||||||||||||||||||||||||||||||||||||||||||||||||||||||||||||||||||
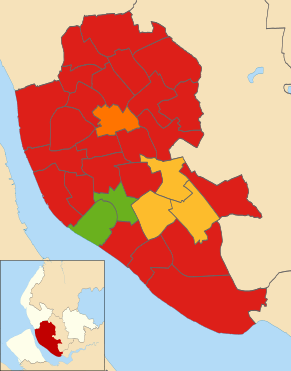 Map of results of 2018 election | |||||||||||||||||||||||||||||||||||||||||||||||||||||||||||||||||||||||||||||
| |||||||||||||||||||||||||||||||||||||||||||||||||||||||||||||||||||||||||||||
The 2018 Liverpool City Council election took place on 3 May 2018 to elect members of Liverpool City Council in England. This was on the same day as other local elections.
Election Results
Overall election result
Overall result compared with 2016.
| Liverpool City Council election result, 2018 | |||||||||||||||
|---|---|---|---|---|---|---|---|---|---|---|---|---|---|---|---|
| Party | Candidates | Votes | |||||||||||||
| Stood | Elected | Gained | Unseated | Net | % of total | % | № | Net % | |||||||
| Labour | 31 | 25 | 0 | 3 | 80.0 | 63.8 | 60,272 | ||||||||
| Liberal Democrat | 31 | 3 | 3 | 0 | 10.0 | 16.7 | 15,742 | ||||||||
| Green | 31 | 2 | 0 | 0 | 6.7 | 9.4 | 8,839 | ||||||||
| Conservative | 31 | 0 | 0 | 0 | 0.0 | 5.6 | 5,254 | ||||||||
| Liberal | 18 | 1 | 0 | 0 | 3.3 | 4.2 | 3,932 | ||||||||
| Independent | 2 | 0 | 0 | 0 | 0.0 | 0.3 | 253 | ||||||||
| TUSC | 1 | 0 | 0 | 0 | 0.0 | 0.2 | 197 | ||||||||
| Old Swan Against the Cuts | 1 | 0 | 0 | 0 | 0.0 | 0.2 | 157 | ||||||||
Ward Results
Allerton and Hunts Cross
| Party | Candidate | Votes | % | ± | |
|---|---|---|---|---|---|
| Labour | Kimberley Berry | 1,885 | 44.3 | ||
| Liberal Democrat | Steve Brauner | 1,811 | 42.6 | ||
| Conservative | Denise Nuttall | 325 | 7.6 | ||
| Green | Maggi Williams | 232 | 5.5 | ||
| Majority | 74 | 1.7 | N/A | ||
| Registered electors | 11,589 | ||||
| Turnout | 4,259 | 36.8 | |||
| Rejected ballots | 6 | 0.1 | |||
| Labour hold | Swing | ||||
Anfield
| Party | Candidate | Votes | % | ± | |
|---|---|---|---|---|---|
| Labour | Billy Marrat | 1,777 | 80.0 | ||
| Conservative | Christopher Smith | 140 | 6.3 | ||
| Liberal Democrat | Wiebke Rüterjans | 134 | 6.0 | ||
| Green | Rachel Burcher | 114 | 5.1 | ||
| Liberal | James Richardson | 56 | 2.5 | ||
| Majority | 1,721 | 73.7 | |||
| Registered electors | 9,212 | ||||
| Turnout | 2,228 | 24.2 | |||
| Rejected ballots | 7 | 0.3 | |||
| Labour hold | Swing | ||||
Belle Vale
| Party | Candidate | Votes | % | ± | |
|---|---|---|---|---|---|
| Labour | Pauline Walton | 2,574 | 82.6 | ||
| Liberal Democrat | Stephen Atkinson | 227 | 7.3 | ||
| Conservative | Wendy Hine | 181 | 5.8 | ||
| Green | Hilary McDonagh | 94 | 3.0 | ||
| Liberal | Marjorie Peel | 40 | 1.3 | ||
| Majority | 2,347 | 75.3 | |||
| Registered electors | 11,547 | ||||
| Turnout | 3,132 | 27.1 | |||
| Rejected ballots | 16 | 0.5 | |||
| Labour hold | Swing | ||||
Central
| Party | Candidate | Votes | % | ± | |
|---|---|---|---|---|---|
| Labour | Nick Small | 1,066 | 67.9 | ||
| Green | Jayne Clough | 182 | 11.6 | ||
| Liberal Democrat | Greg Howard | 119 | 7.6 | ||
| Conservative | Lee Berry | 118 | 7.5 | ||
| Independent | John Leadbeater | 84 | 5.4 | New | |
| Majority | 884 | 56.3 | |||
| Registered electors | 9,766 | ||||
| Turnout | 1,572 | 16.1 | |||
| Rejected ballots | 3 | 0.2 | |||
| Labour hold | Swing | ||||
Childwall
| Party | Candidate | Votes | % | ± | |
|---|---|---|---|---|---|
| Liberal Democrat | Carole Storey | 2,200 | 48.6 | ||
| Labour | Frank Hont | 1,956 | 43.2 | ||
| Green | Phil Williamson | 179 | 4.0 | ||
| Conservative | David Jeffery | 150 | 3.3 | ||
| Liberal | Lindsey Wood | 40 | 0.9 | New | |
| Majority | 244 | 5.4 | N/A | ||
| Registered electors | 10,804 | ||||
| Turnout | 4,536 | 42.0 | |||
| Rejected ballots | 11 | 0.2 | |||
| Liberal Democrat gain from Labour | Swing | ||||
Church
| Party | Candidate | Votes | % | ± | |
|---|---|---|---|---|---|
| Liberal Democrat | Liz Makinson | 2,706 | 58.0 | ||
| Labour | Nigel Parsons | 1,474 | 31.6 | ||
| Green | Julie Birch-Holt | 321 | 6.9 | ||
| Conservative | Thomas Burton | 166 | 3.6 | ||
| Majority | 1,232 | 26.4 | |||
| Registered electors | 10,594 | ||||
| Turnout | 4,672 | 44.1 | |||
| Rejected ballots | 5 | 0.1 | |||
| Liberal Democrat gain from Labour | Swing | ||||
Thomas Burton, the Conservative party candidate for Church ward was ineligible to sit as a councillor as he was a Liverpool City Council employee.[7]
Clubmoor
| Party | Candidate | Votes | % | ± | |
|---|---|---|---|---|---|
| Labour | Roz Gladden | 2,136 | 83.1 | ||
| Liberal | Paul Jones | 129 | 5.0 | ||
| Conservative | Peter Andrew | 127 | 4.9 | ||
| Green | Esther Cosslett | 104 | 4.0 | ||
| Liberal Democrat | Paul Childs | 75 | 2.9 | ||
| Majority | 2,007 | 78.1 | |||
| Registered electors | 11,243 | ||||
| Turnout | 2,583 | 23.0 | |||
| Rejected ballots | 12 | 0.5 | |||
| Labour hold | Swing | ||||
County
| Party | Candidate | Votes | % | ± | |
|---|---|---|---|---|---|
| Labour | Gerard Woodhouse | 2,023 | 86.6 | ||
| Liberal Democrat | Robert McAllister-Bell | 147 | 6.3 | ||
| Conservative | Olivia Lever | 85 | 3.6 | ||
| Green | Ceri Jones | 80 | 3.4 | ||
| Majority | 1,876 | 80.3 | |||
| Registered electors | 9,427 | ||||
| Turnout | 2,345 | 24.9 | |||
| Rejected ballots | 10 | 0.4 | |||
| Labour hold | Swing | ||||
Cressington
| Party | Candidate | Votes | % | ± | |
|---|---|---|---|---|---|
| Labour | Lynnie Hinnigan | 2,444 | 52.4 | ||
| Liberal Democrat | Norman Mills | 1,566 | 33.6 | ||
| Green | Elke Weissmann | 342 | 7.3 | ||
| Conservative | Jade Marsden | 309 | 6.6 | ||
| Majority | 878 | 18.8 | |||
| Registered electors | 11,578 | ||||
| Turnout | 4,665 | 40.3 | |||
| Rejected ballots | 4 | 0.1 | |||
| Labour hold | Swing | ||||
Croxteth
| Party | Candidate | Votes | % | ± | |
|---|---|---|---|---|---|
| Labour | Peter Mitchell | 2,120 | 82.9 | ||
| Conservative | Alice Day | 172 | 6.7 | ||
| Green | Martin Randall | 99 | 3.9 | ||
| Liberal Democrat | Richard Bentall | 91 | 3.6 | ||
| Liberal | Raymond Catesby | 76 | 3.0 | ||
| Majority | 1,984 | 76.2 | |||
| Registered electors | 10,558 | ||||
| Turnout | 2,567 | 24.3 | |||
| Rejected ballots | 9 | 0.4 | |||
| Labour hold | Swing | ||||
Everton
| Party | Candidate | Votes | % | ± | |
|---|---|---|---|---|---|
| Labour | Ian Byrne | 2,295 | 86.6 | ||
| Conservative | David Murray | 136 | 5.1 | ||
| Green | Noèl Little | 100 | 3.8 | ||
| Liberal | Linda Roberts | 60 | 2.3 | ||
| Liberal Democrat | Nicolas Sawyer | 59 | 2.2 | New | |
| Majority | 2,159 | 81.5 | |||
| Registered electors | 10,746 | ||||
| Turnout | 2,663 | 24.8 | |||
| Rejected ballots | 13 | 0.5 | |||
| Labour hold | Swing | ||||
Fazakerley
| Party | Candidate | Votes | % | ± | |
|---|---|---|---|---|---|
| Labour | Lindsay Melia | 2,219 | 83.2 | ||
| Conservative | Giselle McDonald | 177 | 6.6 | ||
| Green | Luke Burke | 115 | 4.3 | ||
| Liberal Democrat | Joseph Slupsky | 108 | 4.0 | ||
| Liberal | Maureen Keyes | 49 | 1.8 | New | |
| Majority | 2,042 | 76.6 | |||
| Registered electors | 11,252 | ||||
| Turnout | 2,677 | 23.8 | |||
| Rejected ballots | 9 | 0.3 | |||
| Labour hold | Swing | ||||
Greenbank
| Party | Candidate | Votes | % | ± | |
|---|---|---|---|---|---|
| Green | Lawrence Brown | 1,648 | 48.2 | ||
| Labour | Jon Morris | 1,553 | 45.5 | ||
| Liberal Democrat | Fiona McBride | 116 | 3.4 | ||
| Conservative | Nicholas Basson | 99 | 2.9 | ||
| Majority | 95 | 2.7 | N/A | ||
| Registered electors | 8,897 | ||||
| Turnout | 3,426 | 39.0 | |||
| Rejected ballots | 10 | 0.3 | |||
| Green hold | Swing | ||||
Kensington and Fairfield
| Party | Candidate | Votes | % | ± | |
|---|---|---|---|---|---|
| Labour | Sue Walker | 1,768 | 76.1 | ||
| Green | Steve Faragher | 179 | 7.7 | ||
| Independent | Joe Owens | 114 | 4.9 | New | |
| Liberal Democrat | Bill Barrow | 110 | 4.7 | ||
| Conservative | Brian Jones | 85 | 3.7 | ||
| Liberal | Damien Daly | 68 | 2.9 | ||
| Majority | 1,589 | 68.4 | |||
| Registered electors | 9,347 | ||||
| Turnout | 2,335 | 25.0 | |||
| Rejected ballots | 11 | 0.5 | |||
| Labour hold | Swing | ||||
Three days before the election, Green Candidate Steve Faragher resigned from the Green Party due to an online comment. [16] This was too late for the ballot paper to be changed. [17]
Kirkdale
| Party | Candidate | Votes | % | ± | |
|---|---|---|---|---|---|
| Labour | Malcolm Kennedy | 2,094 | 82.1 | ||
| TUSC | Roger Bannister | 149 | 5.8 | ||
| Green | Jonathan Clatworthy | 104 | 4.1 | ||
| Conservative | Daniel Nuttall | 103 | 4.0 | ||
| Liberal Democrat | Mike McAllister-Bell | 76 | 3.0 | New | |
| Liberal | Thomas Ryan | 23 | 0.9 | New | |
| Majority | 1,945 | 76.3 | |||
| Registered electors | 11,370 | ||||
| Turnout | 2,557 | 22.5 | |||
| Rejected ballots | 8 | 0.3 | |||
| Labour hold | Swing | ||||
Knotty Ash
| Party | Candidate | Votes | % | ± | |
|---|---|---|---|---|---|
| Labour | Alison Clarke | 1,978 | 70.3 | ||
| Labour | Harry Doyle | 1,895 | – | – | |
| Liberal Democrat | Graham Hughes | 329 | 11.7 | ||
| Conservative | Mark Butchard | 272 | 9.7 | ||
| Conservative | Irene Stuart | 235 | – | – | |
| Liberal Democrat | Gerard Thompson | 182 | – | – | |
| Green | Fiona Coyne | 154 | 5.5 | ||
| Green | Michael Humphrey Johnson | 116 | – | – | |
| Liberal | Kenneth Russell | 79 | 2.8 | ||
| Majority | 1,649 | 58.6 | |||
| Registered electors | 10,599 | ||||
| Turnout | 2,624 | 24.9 | |||
| Rejected ballots | 8 | 0.2 | |||
| Labour hold | Swing | ||||
| Labour hold | Swing | – | |||
Mossley Hill
| Party | Candidate | Votes | % | ± | |
|---|---|---|---|---|---|
| Labour | Elizabeth Hayden | 1,904 | 45.6 | ||
| Liberal Democrat | Alisha Lewis | 1,462 | 35.0 | ||
| Green | Ted Grant | 440 | 10.5 | ||
| Conservative | Chris Hall | 260 | 6.2% | ||
| Liberal | David Wood | 106 | 2.5 | ||
| Majority | 442 | 10.6 | |||
| Registered electors | 9,410 | ||||
| Turnout | 4,172 | 44.4 | |||
| Rejected ballots | 7 | 0.2 | |||
| Labour hold | Swing | ||||
Norris Green
| Party | Candidate | Votes | % | ± | |
|---|---|---|---|---|---|
| Labour | Barry Kushner | 2,344 | 85.8 | ||
| Green | Martyn Madeley | 142 | 5.2 | ||
| Conservative | Alma McGing | 132 | 4.8 | ||
| Liberal Democrat | Sam Buist | 62 | 2.3 | New | |
| Liberal | Brenda Jean Edwards | 51 | 1.9 | New | |
| Majority | 2,202 | 80.6 | |||
| Registered electors | 12,116 | ||||
| Turnout | 2,746 | 22.7 | |||
| Rejected ballots | 15 | 0.5 | |||
| Labour hold | Swing | ||||
Old Swan
| Party | Candidate | Votes | % | ± | |
|---|---|---|---|---|---|
| Labour | Joanne Calvert | 2,174 | 75.0 | ||
| Liberal Democrat | Chris Collins | 162 | 5.6 | ||
| Old Swan Against the Cuts | Martin Ralph | 157 | 5.4 | ||
| Conservative | Derek Nuttall | 144 | 5.0 | ||
| Green | George Maxwell | 136 | 4.7 | ||
| Liberal | Irene Morrison | 126 | 4.3 | ||
| Majority | 2,012 | 69.4 | |||
| Registered electors | 11,220 | ||||
| Turnout | 2,910 | 25.9 | |||
| Rejected ballots | 11 | 0.4 | |||
| Labour hold | Swing | ||||
Picton
| Party | Candidate | Votes | % | ± | |
|---|---|---|---|---|---|
| Labour | Paul Kenyon | 1,931 | 83.6 | ||
| Green | Paul Woodruff | 139 | 6.0 | ||
| Liberal Democrat | Alex Cottrell | 88 | 3.8 | ||
| Conservative | Johnathan Andrew | 76 | 3.3 | ||
| Independent | Adam Heatherington | 55 | 2.4 | New | |
| Liberal | Colin Edwards | 21 | 0.9 | New | |
| Majority | 1,792 | 77.6 | |||
| Registered electors | 10,002 | ||||
| Turnout | 2,322 | 23.2 | |||
| Rejected ballots | 12 | 0.5 | |||
| Labour hold | Swing | ||||
Prince's Park
| Party | Candidate | Votes | % | ± | |
|---|---|---|---|---|---|
| Labour | Anna Rothery | 2,155 | 78.8 | ||
| Green | Stephanie Pitchers | 347 | 12.7 | ||
| Liberal Democrat | Tom Sebire | 122 | 4.5 | ||
| Conservative | Beryl Pinnington | 111 | 4.1 | ||
| Majority | 1,808 | 66.1 | |||
| Registered electors | 10,715 | ||||
| Turnout | 2,753 | 25.7 | |||
| Rejected ballots | 18 | 0.7 | |||
| Labour hold | Swing | ||||
Riverside
| Party | Candidate | Votes | % | ± | |
|---|---|---|---|---|---|
| Labour | Hetty Wood | 2,601 | 79.5 | ||
| Green | Rebecca Lawson | 297 | 9.1 | ||
| Conservative | Robin Singleton | 194 | 5.9 | ||
| Liberal Democrat | Anna McCracken | 181 | 5.5 | ||
| Majority | 2,304 | 70.4 | |||
| Registered electors | 14,170 | ||||
| Turnout | 3,286 | 23.2 | |||
| Rejected ballots | 13 | 0.4 | |||
| Labour hold | Swing | ||||
St. Michael's
| Party | Candidate | Votes | % | ± | |
|---|---|---|---|---|---|
| Green | Tom Crone | 2,205 | 58.3 | ||
| Labour | Stuart Fordham | 1,395 | 36.9 | ||
| Conservative | David Patmore | 99 | 2.6 | ||
| Liberal Democrat | Norman Darbyshire | 82 | 2.2 | ||
| Majority | 810 | 21.4 | |||
| Registered electors | 9,810 | ||||
| Turnout | 3,789 | 38.6 | |||
| Rejected ballots | 8 | 0.2 | |||
| Green hold | Swing | ||||
Speke-Garston
| Party | Candidate | Votes | % | ± | |
|---|---|---|---|---|---|
| Labour | Doreen Knight | 2,634 | 82.8 | ||
| Green | Rachael Stretton | 184 | 5.8 | ||
| Liberal Democrat | Alan Tormey | 184 | 5.8 | ||
| Conservative | James Craig | 178 | 5.6 | ||
| Majority | 2,450 | 77.0 | |||
| Registered electors | 13,792 | ||||
| Turnout | 3,189 | 23.1 | |||
| Rejected ballots | 9 | 0.3 | |||
| Labour hold | Swing | ||||
Tuebrook & Stoneycroft
| Party | Candidate | Votes | % | ± | |
|---|---|---|---|---|---|
| Liberal | William Lake | 2,524 | 64.0 | ||
| Labour | Don Porter | 1,283 | 32.6 | ||
| Liberal Democrat | Pat Moloney | 50 | 1.3 | ||
| Green | Martin Dobson | 47 | 1.2 | ||
| Conservative | Elliot Craddock | 37 | 0.9 | ||
| Majority | 1,241 | 31.4 | |||
| Registered electors | 10,390 | ||||
| Turnout | 3,948 | 38.0 | |||
| Rejected ballots | 7 | 0.2 | |||
| Liberal hold | Swing | ||||
Warbreck
| Party | Candidate | Votes | % | ± | |
|---|---|---|---|---|---|
| Labour | Cheryl Didsbury | 2,321 | 80.0 | ||
| Liberal Democrat | Jerry Lonsdale | 228 | 7.9 | ||
| Conservative | McLean Wickham | 190 | 6.5 | ||
| Green | Jean Hill | 126 | 4.3 | ||
| Liberal | George Roberts | 38 | 1.3 | ||
| Majority | 2,093 | 72.1 | |||
| Registered electors | 11,122 | ||||
| Turnout | 2,916 | 26.2 | |||
| Rejected ballots | 13 | 0.4 | |||
| Labour hold | Swing | ||||
Wavertree
| Party | Candidate | Votes | % | ± | |
|---|---|---|---|---|---|
| Labour | Angela Coleman | 2,122 | 62.5 | ||
| Liberal Democrat | Graham Hulme | 653 | 19.2 | ||
| Green | David Morgan | 303 | 8.9 | ||
| Conservative | Stuart Wood | 247 | 7.3 | ||
| Liberal | Jonathan Mason | 72 | 2.1 | ||
| Majority | 1,469 | 43.3 | |||
| Registered electors | 10,510 | ||||
| Turnout | 3,409 | 32.4 | |||
| Rejected ballots | 12 | 0.4 | |||
| Labour hold | Swing | ||||
West Derby
| Party | Candidate | Votes | % | ± | |
|---|---|---|---|---|---|
| Labour | Pam Thomas | 2,243 | 69.9 | ||
| Conservative | Pauline Shuttleworth | 278 | 8.7 | ||
| Liberal | Ann Hines | 274 | 8.5 | ||
| Liberal Democrat | Paul Parr | 260 | 8.1 | ||
| Green | Ellie Pontin | 107 | 3.3 | ||
| TUSC | Ann Barbara Walsh | 48 | 1.5 | New | |
| Majority | 1,965 | 61.2 | |||
| Registered electors | 10,958 | ||||
| Turnout | 3,216 | 29.3 | |||
| Rejected ballots | 6 | 0.2 | |||
| Labour hold | Swing | ||||
Woolton
| Party | Candidate | Votes | % | ± | |
|---|---|---|---|---|---|
| Liberal Democrat | Kris Brown | 2,148 | 50.5 | ||
| Labour | Colin McAlley | 1,394 | 32.8 | ||
| Conservative | Adam Marsden | 488 | 11.5 | ||
| Green | Jennifer Brown | 226 | 5.3 | ||
| Majority | 754 | 17.7 | |||
| Registered electors | 10,636 | ||||
| Turnout | 4,264 | 40.1 | |||
| Rejected ballots | 8 | 0.2 | |||
| Liberal Democrat gain from Labour | Swing | ||||
Yew Tree
| Party | Candidate | Votes | % | ± | |
|---|---|---|---|---|---|
| Labour | Tony Conception | 2,414 | 81.3 | ||
| Conservative | Gillian Ferrigno | 244 | 8.2 | ||
| Liberal Democrat | Jacqueline Wilson | 117 | 3.9 | ||
| Liberal | Sam Hawksford | 100 | 3.4 | ||
| Green | William Ward | 93 | 3.1 | ||
| Majority | 2,170 | 73.1 | |||
| Registered electors | 11,816 | ||||
| Turnout | 2,975 | 25.2 | |||
| Rejected ballots | 7 | 0.2 | |||
| Labour hold | Swing | ||||
Notes
• italics denote a sitting councillor • bold denotes the winning candidate
- ↑ % of total refers to % of wards won.
See also
- Liverpool City Council
- Liverpool Town Council elections 1835 - 1879
- Liverpool City Council elections 1880–present
- Mayors and Lord Mayors of Liverpool 1207 to present
- History of local government in England
References
- ↑ "Allerton and Hunts Cross". Liverpool City Council. Retrieved 4 May 2018.
- ↑ "Anfield". Liverpool City Council. Retrieved 4 May 2018.
- ↑ "Belle Vale". Liverpool City Council. Retrieved 4 May 2018.
- ↑ "Central". Liverpool City Council. Retrieved 4 May 2018.
- ↑ "Childwall". Liverpool City Council. Retrieved 4 May 2018.
- ↑ "Church". Liverpool City Council. Retrieved 4 May 2018.
- ↑ "BBC news website". Retrieved 2 May 2018.
- ↑ "Clubmoor". Liverpool City Council. Retrieved 4 May 2018.
- ↑ "County". Liverpool City Council. Retrieved 4 May 2018.
- ↑ "Cressington". Liverpool City Council. Retrieved 4 May 2018.
- ↑ "Croxteth". Liverpool City Council. Retrieved 4 May 2018.
- ↑ "Everton". Liverpool City Council. Retrieved 4 May 2018.
- ↑ "Fazakerley -". Liverpool City Council. Retrieved 5 May 2018.
- ↑ "Greenbank -". Liverpool City Council. Retrieved 5 May 2018.
- ↑ "Kensington and Fairfield -". Liverpool City Council. Retrieved 5 May 2018.
- ↑ "Liverpool Green party candidate RESIGNS after 'appalling' disability comment". Liverpool Echo.
- ↑ "Candidate who resigned from Green party apologises but is still standing...for the Green party". Liverpool Echo.
- ↑ "Kirkdale -". Liverpool City Council. Retrieved 5 May 2018.
- ↑ "Knotty Ash -". Liverpool City Council. Retrieved 5 May 2018.
- ↑ "Mossley Hill -". Liverpool City Council. Retrieved 5 May 2018.
- ↑ "Norris Green -". Liverpool City Council. Retrieved 5 May 2018.
- ↑ "Old Swan -". Liverpool City Council. Retrieved 5 May 2018.
- ↑ "Picton -". Liverpool City Council. Retrieved 5 May 2018.
- ↑ "Princes Park -". Liverpool City Council. Retrieved 5 May 2018.
- ↑ "Riverside -". Liverpool City Council. Retrieved 5 May 2018.
- ↑ "St Michaels -". Liverpool City Council. Retrieved 5 May 2018.
- ↑ "Speke-Garston -". Liverpool City Council. Retrieved 5 May 2018.
- ↑ "Tuebrook and Stoneycroft -". Liverpool City Council. Retrieved 5 May 2018.
- ↑ "Warbreck -". Liverpool City Council. Retrieved 5 May 2018.
- ↑ "Wavertree -". Liverpool City Council. Retrieved 5 May 2018.
- ↑ "West Derby -". Liverpool City Council. Retrieved 5 May 2018.
- ↑ "Woolton -". Liverpool City Council. Retrieved 5 May 2018.
- ↑ "Yew Tree - -". Liverpool City Council. Retrieved 5 May 2018.
- ↑ "Liverpool City Council - Statement of Nominated Persons - Local Elections 2018". Retrieved 8 April 2018.
This article is issued from
Wikipedia.
The text is licensed under Creative Commons - Attribution - Sharealike.
Additional terms may apply for the media files.