Liverpool City Council election, 2014
2014 local election results in Liverpool
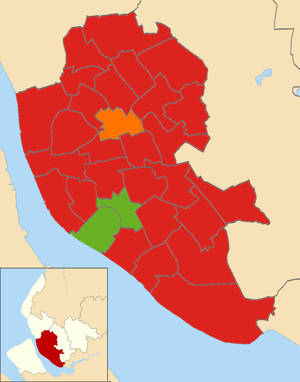
Elections to Liverpool City Council were held on 22 May 2014.[1] The election date was delayed from the usual first Thursday in May to coincide with the European Parliament election. Due to the 'in thirds' system of election, one third of the council were up for election, with direct comparisons to previous results made with the corresponding vote at the Liverpool City Council election, 2010 After the election, the composition of the council was:
| Party | Seats | ± | |
|---|---|---|---|
| Labour | 78 | +5 | |
| Green | 4 | +2 | |
| Liberal Democrats | 3 | -6 | |
| Liberal | 3 | 0 | |
| Independent | 2 | -1 | |
Election result in 2014
| Party | Seats | Gains | Losses | Net gain/loss | Seats % | Votes % | Votes | +/− | |
|---|---|---|---|---|---|---|---|---|---|
| Labour | 27 | 5 | 0 | +5 | 90% | 58.09% | 57,354 | -4.45% | |
| Green | 2 | 2 | 0 | +2 | 4.44% | 10.72% | 10,581 | + | |
| Liberal | 1 | 0 | 0 | 0 | 3.33% | 4.51% | 4,450 | +0.88% | |
| UKIP | 0 | 0 | 0 | 0 | 0 | 9.74% | 9,612 | +8.27% | |
| Liberal Democrat | 0 | 0 | 6 | -6 | 0 | 9.45% | 9,325 | -3.69% | |
| Conservative | 0 | 0 | 0 | 0 | 0 | 5.14% | 5,070 | +0.57% | |
| TUSC | 0 | 0 | 0 | 0 | 0 | 1.22% | 1,201 | ||
| Independent | 0 | 0 | 0 | 0 | 0 | 0.60% | 595 | ||
| National Health Action | 0 | 0 | 0 | 0 | 0 | 0.36% | 360 | ||
| English Democrat | 0 | 0 | 0 | 0 | 0 | 0.18% | 178 | ||
Ward results
* - Existing Councillor seeking re-election.
(PARTY) - Party of former Councillor
Allerton and Hunts Cross
| Party | Candidate | Votes | % | ± | |
|---|---|---|---|---|---|
| Labour | Rachael O'Byrne | 1,991 | 51.12% | +13% | |
| Liberal Democrat | Mirna Juarez (PARTY) | 990 | 25.42% | -19% | |
| Conservative | Christopher Halligan | 427 | 10.96% | -3% | |
| Green | Maggi Williams | 403 | 10.35% | +7% | |
| Liberal | Irene Morrison | 84 | 2.16% | ||
| Majority | 1,001 | ||||
| Registered electors | 11,285 | ||||
| Turnout | 3,895 | 34.51 | -30% | ||
| Rejected ballots | 26 | ||||
| Labour gain from Liberal Democrat | Swing | ||||
Anfield
| Party | Candidate | Votes | % | ± | |
|---|---|---|---|---|---|
| Labour | Ian Francis * | 1,850 | 74.51% | +20% | |
| National Health Action | Louise Boothroyd | 245 | 9.87% | ||
| Liberal | James Richardson | 146 | 5.88% | -0.5% | |
| Green | Jean Hartrick Hill | 145 | 5.84% | +4% | |
| Conservative | Thomas Roberts | 97 | 3.91% | -0.3% | |
| Majority | 1,605 | ||||
| Registered electors | 9,229 | ||||
| Turnout | 2,483 | 26.90% | -27% | ||
| Rejected ballots | 25 | ||||
| Labour hold | Swing | ||||
Belle Vale
| Party | Candidate | Votes | % | ± | |
|---|---|---|---|---|---|
| Labour | Pauline Walton * | 2,307 | 67.16% | +2% | |
| UKIP | Karl Sullivan | 611 | 17.79% | ||
| TUSC | Roy Dixon | 176 | 5.12% | ||
| Green | Julie Birch-Holt | 141 | 4.10% | +2% | |
| Conservative | Maria Prayle | 125 | 3.64% | -1% | |
| Liberal | Damien Patrick Daly | 75 | 2.18% | -29% | |
| Majority | 1,696 | ||||
| Registered electors | 13,905 | ||||
| Turnout | 3,435 | 30.57% | -28% | ||
| Rejected ballots | 21 | ||||
| Labour hold | Swing | ||||
Central
| Party | Candidate | Votes | % | ± | |
|---|---|---|---|---|---|
| Labour | Nick Small * | 1,208 | 63.11% | +10% | |
| Green | Hannah Ellen Clare | 365 | 19.07% | +13% | |
| Conservative | Lee Berry | 151 | 7.89% | -2% | |
| UKIP | Tony Power | 149 | 7.78% | ||
| Liberal | Michele Leigh Williams | 41 | 2.14% | 0% | |
| Majority | 843 | ||||
| Registered electors | 11,093 | ||||
| Turnout | 1,914 | 13.76% | -19% | ||
| Rejected ballots | 13 | ||||
| Labour hold | Swing | ||||
Childwall
| Party | Candidate | Votes | % | ± | |
|---|---|---|---|---|---|
| Labour | Frank Hont | 1,755 | 45.10% | +6% | |
| Liberal Democrat | Pat Moloney * | 1,033 | 26.55% | -15% | |
| UKIP | Adam Heatherington | 593 | 15.24% | ||
| Green | Rebecca Lawson | 215 | 5.53% | +2% | |
| Conservative | Elizabeth Pearson | 209 | 5.37% | +3.5% | |
| Liberal | Jonathan Mason | 86 | 2.21% | -5% | |
| Majority | 722 | ||||
| Registered electors | 10,796 | ||||
| Turnout | 3,891 | 35.08% | -32% | ||
| Rejected ballots | 16 | ||||
| Labour gain from Liberal Democrat | Swing | ||||
Church
| Party | Candidate | Votes | % | ± | |
|---|---|---|---|---|---|
| Labour | Dr Richard Wenstone | 1,906 | 39.17% | +9% | |
| Liberal Democrat | Andrew Makinson (PARTY) | 1,805 | 39.17% | -7% | |
| Conservative | James Pearson | 286 | 6.21% | +4% | |
| Green | Eleanor Martin | 522 | 11.33% | +5% | |
| Liberal | John Bradley | 190 | 4.12% | -4% | |
| Majority | 101 | ||||
| Registered electors | 10,796 | ||||
| Turnout | 4,608 | 42.68% | -23% | ||
| Rejected ballots | 26 | ||||
| Labour gain from Liberal Democrat | Swing | ||||
Clubmoor
| Party | Candidate | Votes | % | ± | |
|---|---|---|---|---|---|
| Labour | Roz Gladden * | 2,201 | 68.59% | -5% | |
| UKIP | Paul Forrest | 686 | 21.38% | ||
| Green | Elspeth Anwar | 117 | 3.65% | +1% | |
| Liberal | Paul Wynne Jones | 130 | 4.05% | -14% | |
| Conservative | Beryl Pinnington | 75 | 2.34% | -2% | |
| Majority | 1,515 | ||||
| Registered electors | 11,162 | ||||
| Turnout | 3,209 | 28.75% | -24% | ||
| Rejected ballots | 12 | ||||
| Labour hold | Swing | ||||
County
| Party | Candidate | Votes | % | ± | |
|---|---|---|---|---|---|
| Labour | Gerard Woodhouse * | 2,148 | 77.02% | +14% | |
| UKIP | Neil Kenny | 406 | 14.56% | ||
| Green | Tony Jones | 92 | 3.3% | -2% | |
| Conservative | Brian Jones | 48 | 1.72% | -1.5% | |
| Liberal | Stephen Houghland | 95 | 3.41% | ||
| Majority | 1,742 | ||||
| Registered electors | 9,625 | ||||
| Turnout | 2,789 | 28.98% | -13% | ||
| Rejected ballots | 9 | ||||
| Labour hold | Swing | ||||
Cressington
| Party | Candidate | Votes | % | ± | |
|---|---|---|---|---|---|
| Labour | Linnie Hinnigan | 2,039 | 47.06% | +10% | |
| Liberal Democrat | Dominic McCaffrey (PARTY) | 882 | 20.36% | -24% | |
| UKIP | Austin Lucas | 540 | 12.46% | ||
| Green | Martin Randall | 406 | 9.37% | +5% | |
| Conservative | Jade Marsden | 321 | 7.41% | +6% | |
| Liberal | Maureen Keyes | 145 | 3.35% | +2.6% | |
| Majority | 1,157 | ||||
| Registered electors | 11,645 | ||||
| Turnout | 4,333 | 37.21% | -25% | ||
| Rejected ballots | 14 | ||||
| Labour gain from Liberal Democrat | Swing | ||||
Croxteth
| Party | Candidate | Votes | % | ± | |
|---|---|---|---|---|---|
| Labour | Peter Mitchell * | 1,887 | 66.33% | +7% | |
| UKIP | Mark Leavesley | 625 | 21.97% | ||
| Green | Don Ross | 127 | 4.46% | +3% | |
| Conservative | Giselle Henrietta McDonald | 112 | 3.94% | +1% | |
| Liberal | John McBride | 94 | 3.3% | 0% | |
| Majority | 1,262 | ||||
| Registered electors | 10,489 | ||||
| Turnout | 2,845 | 27.12% | -27% | ||
| Rejected ballots | 15 | ||||
| Labour hold | Swing | ||||
Everton
| Party | Candidate | Votes | % | ± | |
|---|---|---|---|---|---|
| Labour | John McIntosh * | 2,056 | 69.48% | -10% | |
| Conservative | Jack Stallworthy | 66 | 2.23% | -9.4% | |
| TUSC | Roger Edwards | 89 | 3.01% | ||
| Green | Esther Coslett | 125 | 4.22% | +1.3% | |
| UKIP | John Halvorsen | 557 | 18.82% | ||
| Liberal | Linda Roberts | 66 | 2.23% | +9.5% | |
| Majority | 1,499 | ||||
| Registered electors | 10,198 | ||||
| Turnout | 2,959 | 29.02% | -20% | ||
| Rejected ballots | 17 | ||||
| Labour hold | Swing | ||||
Fazakerley
| Party | Candidate | Votes | % | ± | |
|---|---|---|---|---|---|
| Labour | Dave Hanratty * | 2,163 | 69.80% | +2% | |
| UKIP | Enid Lindsay | 539 | 17.39% | ||
| Liberal Democrat | Graham Seddon | 156 | 5.03% | -17% | |
| Green | Jennifer Brown | 133 | 4.29% | +3% | |
| Conservative | Lucy Glover | 85 | 2.74% | -2.5% | |
| Liberal | Charles Mayes | 23 | 0.74% | -2.25% | |
| Majority | 1,624 | ||||
| Registered electors | 11,110 | ||||
| Turnout | 3,099 | 27.89% | -30% | ||
| Rejected ballots | 16 | ||||
| Labour hold | Swing | ||||
Greenbank
| Party | Candidate | Votes | % | ± | |
|---|---|---|---|---|---|
| Green | Lawrence Brown | 1,706 | 48.18% | +29.05% | |
| Labour | Graeme Cooper | 1,339 | 37.81% | -22.08% | |
| UKIP | Joseph Stanley Chiffers | 191 | 5.39% | ||
| Conservative | Nicholas Basson | 144 | 4.07% | -5% | |
| Liberal Democrat | Jeanete Makinson (PARTY) | 103 | 2.91% | -39% | |
| TUSC | Simon Adam Worthington | 47 | 1.33% | ||
| Liberal | Irene Nora Mayes | 11 | 0.31% | -1.7% | |
| Majority | 367 | ||||
| Registered electors | 10,360 | ||||
| Turnout | 3,541 | 34.18% | -22% | ||
| Rejected ballots | 13 | ||||
| Green gain from Liberal Democrat | Swing | ||||
Kensington and Fairfield
| Party | Candidate | Votes | % | ± | |
|---|---|---|---|---|---|
| Labour | Sue Heron (PARTY) | 1,834 | 67.85% | +5% | |
| UKIP | Mike Lane | 484 | 17.91% | ||
| Independent | Steve Faragher | 151 | 5.59% | ||
| Liberal Democrat | Bill Barrow | 102 | 3.77% | -25% | |
| Conservative | Ben Hachula | 51 | 1.89% | -1% | |
| TUSC | Dave Jones | 41 | 1.52% | ||
| Liberal | Brenda Edwards | 40 | 1.48% | -0.8% | |
| Majority | 1,350 | ||||
| Registered electors | 8,942 | ||||
| Turnout | 2,703 | 30.23% | -23% | ||
| Rejected ballots | 16 | ||||
| Labour hold | Swing | ||||
Kirkdale
| Party | Candidate | Votes | % | ± | |
|---|---|---|---|---|---|
| Labour | Robert Malcolm Kennedy * | 2,303 | 78.71% | -7% | |
| TUSC | Roger Bannister | 206 | 7.04% | ||
| Green | Jonathan Clatworthy | 177 | 6.05% | +3.3% | |
| Liberal | Tommy Stalker | 140 | 4.78% | -2% | |
| Conservative | David Michael John Jeffery | 100 | 3.42% | -1.5% | |
| Majority | 2,097 | ||||
| Registered electors | 11,767 | ||||
| Turnout | 2,926 | 24.87% | -23% | ||
| Rejected ballots | 28 | ||||
| Labour hold | Swing | ||||
Knotty Ash
| Party | Candidate | Votes | % | ± | |
|---|---|---|---|---|---|
| Labour | Ged Taylor (PARTY) | 1,964 | 61.55% | +10% | |
| UKIP | John David Sisson | 578 | 18.11% | ||
| Liberal Democrat | Norman Mills | 251 | 7.87% | -31% | |
| Conservative | Emilio Chiquito | 149 | 4.67% | +1.25% | |
| Green | Jade Emma Kuhlke | 148 | 4.64% | +2.5% | |
| English Democrat | Derek Francis Grue | 57 | 1.79% | ||
| Liberal | Marjorie Peel | 44 | 1.38% | -2.8% | |
| Majority | 1,386 | ||||
| Registered electors | 10,107 | ||||
| Turnout | 3,191 | 31.57% | -28% | ||
| Rejected ballots | 19 | ||||
| Labour hold | Swing | ||||
Mossley Hill
| Party | Candidate | Votes | % | ± | |
|---|---|---|---|---|---|
| Labour | Andrew Douglas Foxley | 1,652 | 42.08% | +8% | |
| Liberal Democrat | Paul Childs (PARTY) | 1,111 | 28.30% | -19% | |
| Conservative | Chris Hall | 381 | 9.70% | -3% | |
| Green | Helen Randall | 717 | 18.26% | +12% | |
| Liberal | David Wood | 65 | 1.66% | ||
| Majority | 541 | ||||
| Turnout | 3,926 | 38.11% | |||
| Rejected ballots | 34 | ||||
| Labour gain from Liberal Democrat | Swing | ||||
Norris Green
| Party | Candidate | Votes | % | ± | |
|---|---|---|---|---|---|
| Labour | Debbie Caine (PARTY) | 2,016 | 68.20% | -12% | |
| UKIP | Joe Gallagher | 595 | 20.13% | ||
| TUSC | Mary Ann Wheeler | 122 | 4.13% | ||
| Green | Fee Coyne | 91 | 3.08% | +1% | |
| Conservative | Gillian Ferrigno | 73 | 2.47% | -4% | |
| Liberal | Diane Burns | 59 | 2.00% | -9% | |
| Majority | 1,421 | ||||
| Turnout | 2,956 | 27.69% | -3% | ||
| Rejected ballots | 29 | ||||
| Labour hold | Swing | ||||
Old Swan
| Party | Candidate | Votes | % | ± | |
|---|---|---|---|---|---|
| Labour | Joanne Calvert | 2,105 | 60.65% | +5% | |
| UKIP | Tony Hammond | 549 | 15.82% | ||
| Old Swan Against the Cuts | Ralph Martin | 296 | 8.53% | ||
| Green | Vikki Ann Gregorich | 150 | 4.32% | -1% | |
| Liberal | Sheila Ann Fairclough | 139 | 4.00% | +2.4% | |
| Conservative | George Powell | 107 | 3.08% | +0.52% | |
| Liberal Democrat | Jacqueline Elaine Wilson | 104 | 3.00% | -33% | |
| English Democrat | Steven Greenhalgh | 21 | 0.61% | ||
| Majority | 1,556 | ||||
| Turnout | 3,471 | 31.10% | +2% | ||
| Rejected ballots | 17 | ||||
| Labour hold | Swing | ||||
Picton
| Party | Candidate | Votes | % | ± | |
|---|---|---|---|---|---|
| Labour | Tim Beaumont * | 1,794 | 65.86% | +11% | |
| UKIP | David Halvorsen | 307 | 11.27% | ||
| Green | Ross James Campbell | 305 | 11.20% | +7% | |
| Liberal Democrat | Kevin White | 134 | 4.92% | -28% | |
| Conservative | Alma Gavine McGing | 83 | 3.05% | -1% | |
| TUSC | Frank Bowen | 61 | 2.24% | ||
| Liberal | Susan O'Brien | 40 | 1.47% | -3% | |
| Majority | 1,487 | ||||
| Turnout | 2,724 | 26.58% | +2% | ||
| Rejected ballots | 13 | ||||
| Labour hold | Swing | ||||
Prince's Park
| Party | Candidate | Votes | % | ± | |
|---|---|---|---|---|---|
| Labour | Anna Rothery | 1,890 | 67.09% | +14% | |
| Green | Simeon Daniel Hart | 459 | 16.29% | +4% | |
| Independent | Frank Jones | 148 | 5.25% | ||
| TUSC | Daren Andrew Ireland | 142 | 5.04% | ||
| Conservative | Laura Watson | 113 | 4.01% | -1.8% | |
| Liberal | Lindsey Janet Mary Wood | 65 | 2.31% | -0.9% | |
| Majority | 1,431 | ||||
| Turnout | 2,817 | 30.38% | -3.18% | ||
| Rejected ballots | 24 | ||||
| Labour hold | Swing | ||||
Riverside
| Party | Candidate | Votes | % | ± | |
|---|---|---|---|---|---|
| Labour | Hetty Wood (PARTY) | 2,078 | 67.31% | -0.19% | |
| UKIP | Darren McCready | 413 | 13.38% | ||
| Green | Martin Dobson | 276 | 8.94% | +4.14% | |
| Conservative | John Watson | 117 | 3.79% | -3.3% | |
| Liberal Democrat | Sean McHugh | 104 | 3.37% | -14% | |
| TUSC | John Marston | 81 | 2.62% | ||
| Liberal | Ian Bull | 18 | 0.58% | +2.5% | |
| Majority | 1,665 | ||||
| Turnout | 3,087 | 26.04% | -2.7% | ||
| Rejected ballots | 11 | ||||
| Labour hold | Swing | ||||
St. Michael's
| Party | Candidate | Votes | % | ± | |
|---|---|---|---|---|---|
| Green | Tom Crone | 2,130 | 60.10% | +30% | |
| Labour | Patricia Margaret Elizabeth O'Brien | 1,078 | 30.42% | +1% | |
| Conservative | David Patmore | 112 | 3.16% | -3.5% | |
| Liberal Democrat | Anna Martin | 80 | 2.26% | -32% | |
| TUSC | Giorgo Moulas | 69 | 1.95% | ||
| English Democrat | Paul Duane Rimmer | 60 | 1.69% | ||
| Liberal | Jessica Bull | 15 | 0.42% | ||
| Majority | 1,052 | ||||
| Turnout | 3.544 | 37.09% | -4.4% | ||
| Rejected ballots | 13 | ||||
| Green gain from Independent | Swing | ||||
Speke-Garston
| Party | Candidate | Votes | % | ± | |
|---|---|---|---|---|---|
| Labour | Doreen Knight * | 2,717 | 80.12% | -0.5% | |
| Green | Pam Robinson | 292 | 8.61% | +5% | |
| Conservative | Lewis Wooding-Smith | 165 | 4.87% | -1.55% | |
| Liberal Democrat | Kris Brown | 161 | 4.75% | -2.45% | |
| Liberal | Colin Edwards | 56 | 1.65% | -1.85% | |
| Majority | 2,425 | ||||
| Turnout | 3,391 | 25.93% | +5.5% | ||
| Rejected ballots | 38 | ||||
| Labour hold | Swing | ||||
Tuebrook & Stoneycroft
| Party | Candidate | Votes | % | ± | |
|---|---|---|---|---|---|
| Liberal | Kevin John Morrison (PARTY) | 1,874 | 60.04 | +0.7% | |
| Labour | Aver Gbaa | 911 | 29.19% | -5.1% | |
| Green | Natalie Clark | 164 | 5.25% | +2% | |
| TUSC | Craig Thomas Pearson | 99 | 3.17% | ||
| Conservative | Peter Connick | 73 | 2.34% | -0.86% | |
| Majority | 963 | ||||
| Turnout | 3,121 | 30.41% | |||
| Rejected ballots | 16 | ||||
| Liberal hold | Swing | ||||
Warbreck
| Party | Candidate | Votes | % | ± | |
|---|---|---|---|---|---|
| Labour | Cheryl Harrison (PARTY) | 2,138 | 64.71% | +6% | |
| UKIP | Connor Forrest | 577 | 17.46% | ||
| Liberal Democrat | Richard Roberts | 292 | 8.84% | -26% | |
| Green | Ellie Pontin | 136 | 4.12% | +1.6% | |
| Conservative | Jack Stanley | 84 | 2.54% | +1.36% | |
| English Democrat | Steven McEllenborough | 40 | 1.21% | ||
| Liberal | George Blacklock Roberts | 37 | 1.12% | ||
| Majority | 1,561 | ||||
| Turnout | 3,304 | 29.42% | -27.4% | ||
| Rejected ballots | 26 | ||||
| Labour hold | Swing | ||||
Wavertree
| Party | Candidate | Votes | % | ± | |
|---|---|---|---|---|---|
| Labour | Rosie Jolly * | 1,859 | 53.36% | +16.46 | |
| Liberal Democrat | Stephen Maddison | 435 | 12.49% | -34.4% | |
| Conservative | Diane Watson | 155 | 4.45% | -0.65% | |
| Green | Elizabeth Pascoe | 351 | 10.07% | +4.77% | |
| UKIP | Neil Miney | 438 | 12.57% | ||
| National Health Action | Stephen McNally | 115 | 3.30% | ||
| Liberal | James Robert Dykstra | 131 | 3.76% | -2% | |
| Majority | 1,421 | ||||
| Turnout | 3,484 | 33.98% | -29.62% | ||
| Rejected ballots | 15 | ||||
| Labour hold | Swing | ||||
West Derby
| Party | Candidate | Votes | % | ± | |
|---|---|---|---|---|---|
| Labour | Pam Thomas * | 1,993 | 55.58% | +7.7% | |
| UKIP | Stuart Monkcom | 774 | 21.58% | ||
| Liberal | Ann Hines | 238 | 6.64% | -3% | |
| Liberal Democrat | Graham Hulme | 207 | 5.77% | -27% | |
| Green | Mark Coleman | 156 | 4.35% | +3% | |
| Conservative | Pauline Ann Shuttleworth | 150 | 4.18% | +2.8% | |
| TUSC | Ann Barbara Walsh | 68 | 1.90% | ||
| Majority | 1,219 | ||||
| Turnout | 3,586 | 32.43% | -32% | ||
| Rejected ballots | 13 | ||||
| Labour hold | Swing | ||||
Woolton
| Party | Candidate | Votes | % | ± | |
|---|---|---|---|---|---|
| Labour | Colin McAlley | 1,536 | 38.51% | ||
| Liberal Democrat | Malcolm Kelly * | 1,375 | 33.60% | -17% | |
| Conservative | Adam Marsden | 772 | 18.87% | -2.7% | |
| Green | Ben Owen | 272 | 6.65% | +3.85% | |
| Liberal | Maria Langley | 97 | 2.37% | ||
| Majority | 201 | ||||
| Turnout | 4,092 | 38.92% | -27.6% | ||
| Rejected ballots | 25 | ||||
| Labour gain from Liberal Democrat | Swing | ||||
Yew Tree
| Party | Candidate | Votes | % | ± | |
|---|---|---|---|---|---|
| Labour | Tony Conception * | 2,596 | 78.64% | +20.3% | |
| Green | Will Ward | 260 | 7.88% | +6% | |
| Conservative | Pat Waddington | 239 | 7.24% | +0.5% | |
| Liberal | Tracey Samantha Hawksford | 206 | 6.24% | +1.9% | |
| Majority | 2,336 | ||||
| Turnout | 3,301 | 28.36% | -28.3% | ||
| Rejected ballots | 25 | ||||
| Labour hold | Swing | ||||
References
- ↑ 2014 Election results Liverpool City Council
This article is issued from
Wikipedia.
The text is licensed under Creative Commons - Attribution - Sharealike.
Additional terms may apply for the media files.