Wirral Metropolitan Borough Council election, 2006
|
| |||||||||||||||||||||||||||||||||||||||||||||||||
| |||||||||||||||||||||||||||||||||||||||||||||||||
22 of 66 seats (One Third) to Wirral Metropolitan Borough Council 34 seats needed for a majority | |||||||||||||||||||||||||||||||||||||||||||||||||
|---|---|---|---|---|---|---|---|---|---|---|---|---|---|---|---|---|---|---|---|---|---|---|---|---|---|---|---|---|---|---|---|---|---|---|---|---|---|---|---|---|---|---|---|---|---|---|---|---|---|
| Turnout |
35.2% ( | ||||||||||||||||||||||||||||||||||||||||||||||||
| |||||||||||||||||||||||||||||||||||||||||||||||||
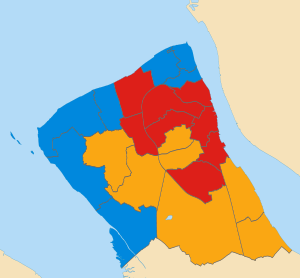 Map of results of 2006 election | |||||||||||||||||||||||||||||||||||||||||||||||||
| |||||||||||||||||||||||||||||||||||||||||||||||||
The 2006 Wirral Metropolitan Borough Council election took place on 4 May 2006 to elect members of Wirral Metropolitan Borough Council in England. This election was held on the same day as other local elections.
After the election, the composition of the council was:
| Party | Seats | ± | |
|---|---|---|---|
| Labour | 26 | ||
| Conservative | 21 | ||
| Liberal Democrat | 19 | ||
| UKIP | 0 | ||
Election results
Overall election result
Overall result compared with 2004.
| Wirral Metropolitan Borough Council election result, 2006 | |||||||||||||||
|---|---|---|---|---|---|---|---|---|---|---|---|---|---|---|---|
| Party | Candidates | Votes | |||||||||||||
| Stood | Elected | Gained | Unseated | Net | % of total | % | № | Net % | |||||||
| Conservative | 22 | 7 | 2 | 2 | 31.8 | 37.3 | 31,839 | ||||||||
| Labour | 22 | 8 | 1 | 1 | 36.4 | 27.5 | 23,487 | ||||||||
| Liberal Democrat | 22 | 7 | 1 | 0 | 31.8 | 27.1 | 23,066 | ||||||||
| Green | 22 | 0 | 0 | 0 | 0.0 | 6.3 | 5,389 | ||||||||
| UKIP | 3 | 0 | 0 | 1 | 0.0 | 1.0 | 879 | N/A | |||||||
| Wirral Independent Network | 1 | 0 | 0 | 0 | 0.0 | 0.4 | 318 | ||||||||
| BNP | 1 | 0 | 0 | 0 | 0 | 0.3 | 282 | ||||||||
Ward results
[3] Results compared directly with the last local election in 2004.
Bebington
| Party | Candidate | Votes | % | ± | |
|---|---|---|---|---|---|
| Labour | Walter Smith | 1,730 | 35.4 | ||
| Conservative | Leslie Thomas | 1,599 | 32.7 | ||
| Liberal Democrat | Christopher Jackson | 898 | 18.4 | ||
| UKIP | Hilary Jones [n 1] | 446 | 9.1 | New | |
| Green | Michael Harper | 218 | 4.5 | ||
| Majority | 131 | 2.7 | N/A | ||
| Registered electors | 11,897 | ||||
| Turnout | 41.2 | ||||
| Labour gain from Conservative | Swing | ||||
Bidston and St James
| Party | Candidate | Votes | % | ± | |
|---|---|---|---|---|---|
| Labour | Ann McLachlan | 1,307 | 63.7 | ||
| Conservative | Barbara Sinclair | 293 | 14.3 | ||
| Liberal Democrat | Roy Wood | 292 | 14.2 | ||
| Green | George Bowler | 161 | 7.8 | New | |
| Majority | 1,014 | 49.4 | |||
| Registered electors | 10,097 | ||||
| Turnout | 20.5 | ||||
| Labour hold | Swing | ||||
Birkenhead and Tranmere
| Party | Candidate | Votes | % | ± | |
|---|---|---|---|---|---|
| Labour | Brian Kenny | 1,119 | 53.2 | ||
| Wirral Independent Network | Andrew Dow | 318 | 15.1 | ||
| Liberal Democrat | Alan Brighthouse | 303 | 14.4 | ||
| Conservative | June Cowin | 193 | 9.2 | ||
| Green | Catherine Page | 170 | 8.1 | ||
| Majority | 801 | 38.1 | |||
| Registered electors | 10,137 | ||||
| Turnout | 20.9 | ||||
| Labour hold | Swing | ||||
Bromborough
| Party | Candidate | Votes | % | ± | |
|---|---|---|---|---|---|
| Liberal Democrat | Alan Taylor | 1,827 | 53.3 | ||
| Labour | Audrey Moore | 924 | 27.0 | ||
| Conservative | Jonathan Mackie | 487 | 14.2 | ||
| Green | Ann Jones | 190 | 5.5 | ||
| Majority | 903 | 26.8 | |||
| Registered electors | 10,728 | ||||
| Turnout | 32.0 | ||||
| Liberal Democrat hold | Swing | ||||
Clatterbridge
| Party | Candidate | Votes | % | ± | |
|---|---|---|---|---|---|
| Liberal Democrat | Christopher Teggin | 2,354 | 45.3 | ||
| Conservative | Irene Povall | 1,978 | 38.0 | ||
| Labour | Andrew Page | 702 | 13.5 | ||
| Green | Khalid Hussenbux | 168 | 3.2 | ||
| Majority | 376 | 7.3 | |||
| Registered electors | 11,835 | ||||
| Turnout | 44.1 | ||||
| Liberal Democrat hold | Swing | ||||
Claughton
| Party | Candidate | Votes | % | ± | |
|---|---|---|---|---|---|
| Labour | Denise Roberts | 1,590 | 49.3 | ||
| Conservative | Peter Hartley | 879 | 27.3 | ||
| Liberal Democrat | Anna Blumenthal | 531 | 16.5 | ||
| Green | Joyce Hogg | 223 | 6.9 | ||
| Majority | 711 | 22.0 | |||
| Registered electors | 11,425 | ||||
| Turnout | 28.3 | ||||
| Labour hold | Swing | ||||
Eastham
| Party | Candidate | Votes | % | ± | |
|---|---|---|---|---|---|
| Liberal Democrat | Thomas Harney | 2,924 | 68.4 | ||
| Conservative | Barbara Green | 637 | 14.9 | ||
| Labour | Christopher Lawler | 559 | 13.1 | ||
| Green | Brian Gibbs | 155 | 3.6 | ||
| Majority | 2,287 | 53.5 | |||
| Registered electors | 11,066 | ||||
| Turnout | 38.7 | ||||
| Liberal Democrat hold | Swing | ||||
Greasby, Frankby and Irby
| Party | Candidate | Votes | % | ± | |
|---|---|---|---|---|---|
| Liberal Democrat | Jean Quinn | 2,690 | 48.9 | ||
| Conservative | Kenneth Young | 2,032 | 36.9 | ||
| Labour | Barbara Moores | 591 | 10.7 | ||
| Green | Anne Rosseinsky | 193 | 3.5 | New | |
| Majority | 658 | 12.0 | |||
| Registered electors | 11,600 | ||||
| Turnout | 47.5 | ||||
| Liberal Democrat hold | Swing | ||||
Heswall
| Party | Candidate | Votes | % | ± | |
|---|---|---|---|---|---|
| Conservative | Stephen Rowlands | 3,412 | 69.6 | ||
| Liberal Democrat | William Jones | 600 | 12.2 | ||
| Labour | Philip Waterfield | 544 | 11.1 | ||
| Green | Ian Barclay | 348 | 7.1 | ||
| Majority | 2,812 | 57.4 | |||
| Registered electors | 11,040 | ||||
| Turnout | 44.5 | ||||
| Conservative hold | Swing | ||||
Hoylake and Meols
| Party | Candidate | Votes | % | ± | |
|---|---|---|---|---|---|
| Conservative | David Kirwan | 2,509 | 59.0 | ||
| Labour | Stuart Wade | 765 | 18.0 | ||
| Liberal Democrat | Sarah Quinn | 605 | 14.2 | ||
| Green | Hara Willow | 377 | 8.9 | ||
| Majority | 1,744 | 41.0 | |||
| Registered electors | 10,617 | ||||
| Turnout | 40.2 | ||||
| Conservative gain from UKIP | Swing | ||||
Leasowe and Moreton East
| Party | Candidate | Votes | % | ± | |
|---|---|---|---|---|---|
| Labour | Iris Coates | 1,426 | 45.6 | ||
| Conservative | Vida Wilson | 1,050 | 33.6 | ||
| Liberal Democrat | Gerald Hainsworth | 406 | 13.0 | ||
| Green | Rosemary Bland | 243 | 7.8 | New | |
| Majority | 376 | 12.6 | |||
| Registered electors | 10,939 | ||||
| Turnout | 28.6 | ||||
| Labour hold | Swing | ||||
Liscard
| Party | Candidate | Votes | % | ± | |
|---|---|---|---|---|---|
| Conservative | Leah Fraser | 2,047 | 49.9 | ||
| Labour | Christine Jones | 1,396 | 34.0 | ||
| Liberal Democrat | Susan Uriel | 286 | 7.0 | ||
| Green | Lucinda Richardson | 209 | 5.1 | New | |
| UKIP | Philip Griffiths | 166 | 4.0 | New | |
| Majority | 651 | 15.9 | N/A | ||
| Registered electors | 11,293 | ||||
| Turnout | 36.4 | ||||
| Conservative gain from Labour | Swing | ||||
Moreton West and Saughall Massie
| Party | Candidate | Votes | % | ± | |
|---|---|---|---|---|---|
| Conservative | Simon Mountney | 2,154 | 57.0 | ||
| Labour | Darren Dodd | 973 | 25.7 | ||
| Liberal Democrat | Eric Copestake | 401 | 10.6 | ||
| Green | James Drew | 251 | 6.6 | New | |
| Majority | 1,181 | 31.3 | |||
| Registered electors | 10,922 | ||||
| Turnout | 34.7 | ||||
| Conservative hold | Swing | ||||
New Brighton
| Party | Candidate | Votes | % | ± | |
|---|---|---|---|---|---|
| Conservative | William Duffy | 1,622 | 41.8 | ||
| Labour | Elizabeth McArdle | 1,236 | 31.8 | ||
| Green | Cynthia Stonall | 546 | 14.1 | ||
| Liberal Democrat | Matthew Byrne | 479 | 12.3 | ||
| Majority | 386 | 10.0 | N/A | ||
| Registered electors | 11,024 | ||||
| Turnout | 35.3 | ||||
| Conservative hold | Swing | ||||
Oxton
| Party | Candidate | Votes | % | ± | |
|---|---|---|---|---|---|
| Liberal Democrat | Paula Southwood | 2,067 | 55.4 | ||
| Labour | David Barden | 646 | 17.3 | ||
| Conservative | Tina McDonnell | 565 | 15.1 | ||
| UKIP | Michael Pepler | 267 | 7.2 | New | |
| Green | Garnette Bowler | 185 | 5.0 | ||
| Majority | 1,421 | 38.1 | |||
| Registered electors | 11,190 | ||||
| Turnout | 33.4 | ||||
| Liberal Democrat hold | Swing | ||||
Pensby and Thingwall
| Party | Candidate | Votes | % | ± | |
|---|---|---|---|---|---|
| Liberal Democrat | Michael Redfern | 1,843 | 40.4 | ||
| Conservative | Oliver Adam [n 2] | 1,710 | 37.5 | ||
| Labour | John Cunningham | 754 | 16.5 | ||
| Green | Allen Burton | 256 | 5.6 | ||
| Majority | 133 | 2.9 | N/A | ||
| Registered electors | 10,745 | ||||
| Turnout | 42.6 | ||||
| Liberal Democrat gain from Conservative | Swing | ||||
Prenton
| Party | Candidate | Votes | % | ± | |
|---|---|---|---|---|---|
| Liberal Democrat | Francis Doyle | 1,558 | 41.5 | ||
| Labour | Denise Realey | 1,215 | 32.3 | ||
| Conservative | Susan Percy | 753 | 20.0 | ||
| Green | Mark Mitchell | 232 | 6.2 | ||
| Majority | 343 | 9.2 | |||
| Registered electors | 11,038 | ||||
| Turnout | 34.2 | ||||
| Liberal Democrat hold | Swing | ||||
Rock Ferry
| Party | Candidate | Votes | % | ± | |
|---|---|---|---|---|---|
| Labour | Moira McLaughlin | 1,405 | 58.0 | ||
| Liberal Democrat | Peter Heppinstall | 405 | 16.7 | ||
| Conservative | Joanne Suffield | 404 | 16.7 | ||
| Green | Anna Stamp | 207 | 8.6 | ||
| Majority | 1,000 | 41.3 | |||
| Registered electors | 10,205 | ||||
| Turnout | 23.8 | ||||
| Labour hold | Swing | ||||
Seacombe
| Party | Candidate | Votes | % | ± | |
|---|---|---|---|---|---|
| Labour | Adrian Jones | 1,341 | 58.2 | ||
| Conservative | Robert Sherlock | 413 | 17.9 | ||
| Liberal Democrat | Terence Pitt | 344 | 14.9 | ||
| Green | Beverley Kells | 205 | 8.9 | New | |
| Majority | 928 | 40.3 | |||
| Registered electors | 10,452 | ||||
| Turnout | 22.2 | ||||
| Labour hold | Swing | ||||
Upton
| Party | Candidate | Votes | % | ± | |
|---|---|---|---|---|---|
| Labour | John George | 1,716 | 39.1 | ||
| Conservative | Julie Kirwan | 1,424 | 32.4 | ||
| Liberal Democrat | Robert Earl | 991 | 22.6 | ||
| Green | Lesley Hussenbux | 262 | 6.0 | ||
| Majority | 292 | 6.7 | |||
| Registered electors | 12,170 | ||||
| Turnout | 36.2 | ||||
| Labour hold | Swing | ||||
Wallasey
| Party | Candidate | Votes | % | ± | |
|---|---|---|---|---|---|
| Conservative | Lesley Rennie | 2,907 | 59.1 | ||
| Labour | James Crabtree | 957 | 19.5 | ||
| Liberal Democrat | John Uriel | 546 | 11.1 | ||
| BNP | John Edwards | 282 | 5.7 | New | |
| Green | Perle Sheldricks | 228 | 4.6 | New | |
| Majority | 1,950 | 39.6 | |||
| Registered electors | 11,989 | ||||
| Turnout | 41.1 | ||||
| Conservative hold | Swing | ||||
West Kirby and Thurstason
| Party | Candidate | Votes | % | ± | |
|---|---|---|---|---|---|
| Conservative | Jeffrey Green | 2,771 | 62.4 | ||
| Liberal Democrat | Christopher Beazer | 716 | 16.1 | ||
| Labour | James Brown | 591 | 13.3 | ||
| Green | Patrick Cleary | 362 | 8.2 | ||
| Majority | 2,055 | 46.3 | |||
| Registered electors | 10,396 | ||||
| Turnout | 42.9 | ||||
| Conservative hold | Swing | ||||
Notes
• italics denote the sitting councillor • bold denotes the winning candidate
- ↑ Retiring councillor for Hoylake and Meols ward. Elected as a Conservative. Resigned the whip in 2004 and later defected to UKIP.[4]
- ↑ Elected as a Liberal Democrat. Defected to the Conservatives in 2005.[33]
References
- ↑ "Local election - 04 May 2006". Wirral Metropolitan Borough Council.
- ↑ "Local Election Results 2006 Wirral". Local Elections Archive Project.
- ↑ "Local election - 04 May 2006". Wirral Metropolitan Borough Council.
- ↑ "'No respect for mayor'". Wirral Globe.
- ↑ "Bebington Ward — Wirral". Local Elections Archive Project.
- ↑ "Councillor Walter Smith". Wirral Metropolitan Borough Council.
- ↑ "Bidston and St James Ward — Wirral". Local Elections Archive Project.
- ↑ "Councillor Ann McLachlan". Wirral Metropolitan Borough Council.
- ↑ "Birkenhead and Tranmere Ward — Wirral". Local Elections Archive Project.
- ↑ "Councillor Brian Kenny". Wirral Metropolitan Borough Council.
- ↑ "Councillor Alan Brighthouse". Wirral Metropolitan Borough Council.
- ↑ "Bromborough Ward — Wirral". Local Elections Archive Project.
- ↑ "Clatterbridge Ward — Wirral". Local Elections Archive Project.
- ↑ "Councillor Cherry Povall, JP". Wirral Metropolitan Borough Council.
- ↑ "Claughton Ward — Wirral". Local Elections Archive Project.
- ↑ "Councillor Denise Roberts". Wirral Metropolitan Borough Council.
- ↑ "Eastham Ward — Wirral". Local Elections Archive Project.
- ↑ "Councillor Tom Harney". Wirral Metropolitan Borough Council.
- ↑ "Greasby, Frankby and Irby Ward — Wirral". Local Elections Archive Project.
- ↑ "Heswall Ward — Wirral". Local Elections Archive Project.
- ↑ "Councillor Les Rowlands". Wirral Metropolitan Borough Council.
- ↑ "Hoylake and Meols Ward — Wirral". Local Elections Archive Project.
- ↑ "Leasowe and Moreton East Ward — Wirral". Local Elections Archive Project.
- ↑ "Liscard Ward — Wirral". Local Elections Archive Project.
- ↑ "Councillor Leah Fraser". Wirral Metropolitan Borough Council.
- ↑ "Councillor Chris Jones". Wirral Metropolitan Borough Council.
- ↑ "Moreton West and Saughall Massie Ward — Wirral". Local Elections Archive Project.
- ↑ "Councillor Simon R Mountney". Wirral Metropolitan Borough Council.
- ↑ "Councillor Darren Dodd". Wirral Metropolitan Borough Council.
- ↑ "New Brighton Ward — Wirral". Local Elections Archive Project.
- ↑ "Councillor Anne McArdle". Wirral Metropolitan Borough Council.
- ↑ "Oxton Ward — Wirral". Local Elections Archive Project.
- ↑ "Why I jumped ship to join the Tories". Wirral Globe.
- ↑ "Pensby and Thingwall Ward — Wirral". Local Elections Archive Project.
- ↑ "Prenton Ward — Wirral". Local Elections Archive Project.
- ↑ "Councillor Denise Realey". Wirral Metropolitan Borough Council.
- ↑ "Rock Ferry Ward — Wirral". Local Elections Archive Project.
- ↑ "Councillor Moira McLaughlin". Wirral Metropolitan Borough Council.
- ↑ "Seacombe Ward — Wirral". Local Elections Archive Project.
- ↑ "Councillor Adrian Jones". Wirral Metropolitan Borough Council.
- ↑ "Upton Ward — Wirral". Local Elections Archive Project.
- ↑ "Wallasey Ward — Wirral". Local Elections Archive Project.
- ↑ "Councillor Lesley Rennie". Wirral Metropolitan Borough Council.
- ↑ "Councillor Jim Crabtree". Wirral Metropolitan Borough Council.
- ↑ "West Kirby and Thurstaston Ward — Wirral". Local Elections Archive Project.
- ↑ "Councillor Jeff Green". Wirral Metropolitan Borough Council.
- ↑ "Councillor Pat Cleary". Wirral Metropolitan Borough Council.
This article is issued from
Wikipedia.
The text is licensed under Creative Commons - Attribution - Sharealike.
Additional terms may apply for the media files.