Birmingham City Council election, 2018
|
| |||||||||||||||||||||||||||||||||||||||||||||||||||||||||||||||||
| |||||||||||||||||||||||||||||||||||||||||||||||||||||||||||||||||
All 101 seats to Birmingham City Council 51 seats needed for a majority | |||||||||||||||||||||||||||||||||||||||||||||||||||||||||||||||||
|---|---|---|---|---|---|---|---|---|---|---|---|---|---|---|---|---|---|---|---|---|---|---|---|---|---|---|---|---|---|---|---|---|---|---|---|---|---|---|---|---|---|---|---|---|---|---|---|---|---|---|---|---|---|---|---|---|---|---|---|---|---|---|---|---|---|
| |||||||||||||||||||||||||||||||||||||||||||||||||||||||||||||||||
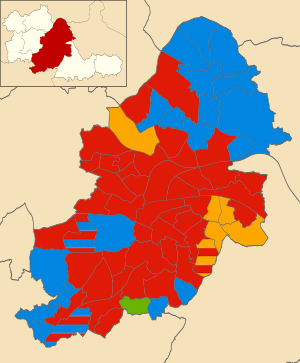 2018 local election results in Birmingham. | |||||||||||||||||||||||||||||||||||||||||||||||||||||||||||||||||
| |||||||||||||||||||||||||||||||||||||||||||||||||||||||||||||||||
The 2018 Birmingham City Council election is one of many local elections that took place in England on 3 May 2018. This was the first 'all-out' election for Birmingham City Council following a boundary review, which reduced the number of councillors from 120 to 101, serving 69 wards (previously 40 wards).[1][2] Since the election, the city council has been composed of 37 single-member wards and 32 two-member wards.[3]
Eligibility to vote
All registered electors (British, Irish, Commonwealth and European Union citizens) who are aged 18 or over on polling day will be entitled to vote in the local elections.[4] A person who has two homes (such as a university student having a term-time address and living at home during holidays) can register to vote at both addresses as long as they are not in the same electoral area, and can vote in the local elections for the two different local councils.[5]
Election Results
Overall election result
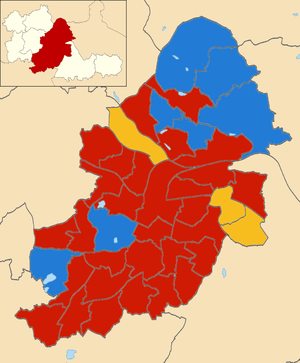
Overall result compared with 2016.
| Birmingham City Council election result, 2018 | ||||||||||||||||
|---|---|---|---|---|---|---|---|---|---|---|---|---|---|---|---|---|
| Party | Candidates | Votes | ||||||||||||||
| Stood | Elected | Net | Net % | % of total | % | № | Net % | |||||||||
| Labour | 101 | 67 | 66.3 | 50.2 | 120,083 | |||||||||||
| Conservative | 101 | 25 | 24.8 | 28.8 | 68,840 | |||||||||||
| Liberal Democrat | 101 | 8 | 7.9 | 14.1 | 33,648 | |||||||||||
| Green | 47 | 1 | 1.0 | 4.4 | 10,557 | |||||||||||
| Independent | 11 | 0 | 0.0 | 2.0 | 4,765 | |||||||||||
| TUSC | 10 | 0 | 0.0 | 0.3 | 750 | |||||||||||
| Birmingham Worker | 3 | 0 | 0.0 | 0.1 | 296 | N/A | ||||||||||
| Liberal | 1 | 0 | 0.0 | 0.1 | 170 | N/A | ||||||||||
| UKIP | 1 | 0 | 0.0 | 0.0 | 111 | |||||||||||
| Common Good | 1 | 0 | 0.0 | 0.0 | 72 | N/A | ||||||||||
Council Composition
Prior to the election
Prior to the 2018 election, Birmingham City Council was composed of 120 councillors across 40 wards. The council has been controlled by the Labour Party since 2012, which held two-thirds (80) of the seats. The Conservative Party last held sole control of the council in 1984. It was under no overall control from 2003 until 2012, run by a Labour-Liberal Democrat coalition from 2003 to 2004 and by a Conservative-Liberal Democrat coalition from 2004 to 2012.[7]
| 80 | 29 | 10 | 1 |
| Labour | Conservative | Lib Dem | I |
- Lib Dem – Liberal Democrats
- I – Independent
After the election
| 67 | 25 | 8 | 1 |
| Labour | Conservative | Lib Dem | G |
- Lib Dem – Liberal Democrats
- G – Green
Ward results
City centre and surrounding area
Aston
| Party | Candidate | Votes | % | ± | |
|---|---|---|---|---|---|
| Labour | Muhammad Afzal | 2,902 | |||
| Labour | Nagina Kauser | 2,793 | |||
| Liberal Democrat | Ayoub Khan | 2,252 | |||
| Liberal Democrat | Sham Uddin | 1,546 | |||
| Independent | Abdul Aziz | 1,134 | |||
| Conservative | Jahid Choudhury | 891 | |||
| Conservative | Margaret Bennett | 328 | |||
| Green | Vijay Rana | 160 | |||
| Majority | |||||
| Turnout | |||||
| Labour hold | Swing | ||||
| Labour hold | Swing | ||||
Birchfield
| Party | Candidate | Votes | % | ± | |
|---|---|---|---|---|---|
| Labour | Mahmood Hussain | 1,905 | 83.7 | ||
| Conservative | Raja Khan | 217 | 9.5 | ||
| Liberal Democrat | Rezaul Billah | 155 | 6.8 | ||
| Majority | |||||
| Turnout | 2,277 | ||||
| Labour win (new seat) | |||||
Bordesley & Highgate
| Party | Candidate | Votes | % | ± | |
|---|---|---|---|---|---|
| Labour | Yvonne Mosquito | 1,176 | 78.5 | ||
| Liberal Democrat | Daniel Iliff | 120 | 8.0 | ||
| Conservative | Julia Mackey | 113 | 7.5 | ||
| Green | Tom Jenkins | 90 | 6.0 | ||
| Majority | 1,056 | ||||
| Turnout | 1,512 | ||||
| Labour win (new seat) | |||||
Bordesley Green
| Party | Candidate | Votes | % | ± | |
|---|---|---|---|---|---|
| Labour | Chauhdry Rashid | 1,664 | 69.4 | ||
| Liberal Democrat | Mohammed Saeed | 540 | 22.5 | ||
| Conservative | Ayan Tifow | 109 | 4.5 | ||
| Green | Alan Clawley | 84 | 3.5 | ||
| Majority | 1,124 | ||||
| Turnout | 2,420 | ||||
| Labour hold | Swing | ||||
Edgbaston
| Party | Candidate | Votes | % | ± | |
|---|---|---|---|---|---|
| Conservative | Deirdre Alden | 2,607 | 31.1 | ||
| Conservative | Matt Bennett | 1,969 | 23.5 | ||
| Labour | Jenny Nolan | 1,571 | 18.8 | ||
| Labour | Marcus Bernasconi | 1,470 | 17.5 | ||
| Green | Alexander Nettle | 279 | 3.3 | ||
| Liberal Democrat | Daniel Chamberlain | 259 | 3.1 | ||
| Liberal Democrat | Jamie Scott | 222 | 2.7 | ||
| Majority | |||||
| Turnout | 8,377 | ||||
| Conservative hold | Swing | ||||
| Conservative hold | Swing | ||||
Handsworth
| Party | Candidate | Votes | % | ± | |
|---|---|---|---|---|---|
| Labour | Hendrina Quinnen | 1,726 | 71.7 | ||
| Conservative | Enam-Ur Rahman | 455 | 18.9 | ||
| Green | Susan Green | 146 | 6.1 | ||
| Liberal Democrat | Kingsley Douglas | 80 | 3.3 | ||
| Majority | 1,271 | ||||
| Turnout | 2,417 | ||||
| Labour win (new seat) | |||||
Handsworth Wood
| Party | Candidate | Votes | % | ± | |
|---|---|---|---|---|---|
| Labour | Narinder Kooner | 2,606 | |||
| Labour | Gurdial Atwal | 2,509 | |||
| Conservative | Steve White | 693 | |||
| Conservative | Ravi Chumber | 679 | |||
| Green | Eric Fairclough | 283 | |||
| Liberal Democrat | Nicholas Joliffe | 245 | |||
| Liberal Democrat | Rizwan Ali | 200 | |||
| TUSC | Rachel Jenkins | 134 | |||
| Independent | PG Aathouli-Singh | 64 | |||
| Majority | |||||
| Turnout | |||||
| Labour hold | Swing | ||||
| Labour hold | Swing | ||||
Harborne
| Party | Candidate | Votes | % | ± | |
|---|---|---|---|---|---|
| Labour | Jayne Francis | 2,623 | |||
| Conservative | Peter Fowler | 2,533 | |||
| Conservative | Akaal Sidhu | 2,390 | |||
| Labour | Sundip Meghani | 2,061 | |||
| Liberal Democrat | Colin Green | 657 | |||
| Green | Phil Simpson | 650 | |||
| Liberal Democrat | Ian Garrett | 646 | |||
| Majority | |||||
| Turnout | 6109 | ||||
| Labour hold | Swing | ||||
| Conservative gain from Labour | Swing | ||||
Holyhead
| Party | Candidate | Votes | % | ± | |
|---|---|---|---|---|---|
| Labour | Paulette Hamilton | 1,646 | 70.4 | ||
| Conservative | Mujakkir Ahmed | 436 | 18.6 | ||
| Liberal Democrat | Foysol Ahmed | 257 | 11.0 | ||
| Majority | 1,210 | ||||
| Turnout | 2,366 | ||||
| Labour win (new seat) | |||||
Ladywood
| Party | Candidate | Votes | % | ± | |
|---|---|---|---|---|---|
| Labour | Kath Hartley | 1,639 | 32.07 | ||
| Labour | Albert Bore | 1,631 | 31.91 | ||
| Conservative | Kenneth Morris | 489 | 9.56 | ||
| Conservative | Nayaz Qazi | 388 | 7.59 | ||
| Green | Robert Jones | 342 | 6.69 | ||
| Liberal Democrat | Lee Dargue | 340 | 6.65 | ||
| Liberal Democrat | Stephen Lambert | 278 | 5.44 | ||
| Majority | 3273 | 64.05 | |||
| Turnout | |||||
| Labour hold | Swing | ||||
| Labour hold | Swing | ||||
Lozells
| Party | Candidate | Votes | % | ± | |
|---|---|---|---|---|---|
| Labour | Waseem Zaffer | 2,071 | 64.5 | ||
| Conservative | Abdul Khalique | 745 | 23.2 | ||
| Liberal Democrat | Sadek Hussain | 395 | 12.3 | ||
| Majority | 1,326 | ||||
| Turnout | 3211 | ||||
| Labour win (new seat) | |||||
Nechells
| Party | Candidate | Votes | % | ± | |
|---|---|---|---|---|---|
| Labour | Tahir Ali | 1,237 | 81.2 | ||
| Conservative | Neil Shastri-Hurst | 164 | 10.8 | ||
| Liberal Democrat | Shazad Iqbal | 123 | 8.1 | ||
| Majority | 1,073 | ||||
| Turnout | 1,542 | ||||
| Labour hold | Swing | ||||
Newtown
| Party | Candidate | Votes | % | ± | |
|---|---|---|---|---|---|
| Labour | Ziaul Islam | 1,319 | 77.4 | ||
| Conservative | Desmond Jaddoo | 310 | 18.2 | ||
| Liberal Democrat | Sultan Ahmed | 76 | 4.5 | ||
| Majority | 1,009 | ||||
| Turnout | 1,722 | ||||
| Labour win (new seat) | |||||
North Edgbaston
| Party | Candidate | Votes | % | ± | |
|---|---|---|---|---|---|
| Labour | Carl Rice | 2,854 | 35.23 | ||
| Labour | Sharon Thompson | 2,383 | 29.42 | ||
| Conservative | Dal Sidhu | 1,254 | 15.48 | ||
| Conservative | Raj Padda | 962 | 11.88 | ||
| Liberal Democrat | Joni Hood | 241 | 2.97 | ||
| Independent | Gino Bellavia | 227 | 2.80 | ||
| Liberal Democrat | Ned Hilton | 180 | 2.22 | ||
| Majority | |||||
| Turnout | 8101 | ||||
| Labour win (new seat) | |||||
| Labour win (new seat) | |||||
Quinton
| Party | Candidate | Votes | % | ± | |
|---|---|---|---|---|---|
| Labour Co-op | Kate Booth | 2,332 | |||
| Labour Co-op | John Clancy | 2,307 | |||
| Conservative | Georgina Chandler | 2,206 | |||
| Conservative | Rachel Okello | 1,919 | |||
| Green | James Bolton | 344 | |||
| Liberal Democrat | Julia Garrett | 343 | |||
| Liberal Democrat | Jo Walker | 146 | |||
| Majority | |||||
| Turnout | |||||
| Labour Co-op hold | Swing | ||||
| Labour Co-op hold | Swing | ||||
Soho & Jewellery Quarter
| Party | Candidate | Votes | % | ± | |
|---|---|---|---|---|---|
| Labour | Chaman Lal | 2,365 | 34.80 | ||
| Labour | Sybil Spence | 2,097 | 30.94 | ||
| Conservative | Janatul Choudhury | 644 | 9.50 | ||
| Liberal Democrat | Gareth Hardy | 566 | 8.35 | ||
| Conservative | Mohammed Islam | 460 | 6.79 | ||
| Liberal Democrat | Richard Maxwell | 373 | 5.50 | ||
| Green | Kefentse Dennis | 272 | 4.01 | ||
| Majority | |||||
| Turnout | |||||
| Labour win (new seat) | |||||
| Labour win (new seat) | |||||
East of city centre
Alum Rock
| Party | Candidate | Votes | % | ± | |
|---|---|---|---|---|---|
| Labour | Mohammed Idrees | 4,910 | |||
| Labour | Mariam Khan | 4,464 | |||
| Liberal Democrat | Thomas Lister | 296 | |||
| Conservative | Richard Brookes-Bland | 215 | |||
| Conservative | Amil Khan | 214 | |||
| Liberal Democrat | Colin Ross | 187 | |||
| Labour win (new seat) | |||||
| Labour win (new seat) | |||||
Bromford & Hodge Hill
| Party | Candidate | Votes | % | ± | |
|---|---|---|---|---|---|
| Labour | Majid Mahmood | 2,569 | |||
| Labour | Diane Donaldson | 2,435 | |||
| Conservative | Aminur Rahman | 721 | |||
| Conservative | Bogdan Tudor | 617 | |||
| Liberal Democrat | Gwyn Neilly | 424 | |||
| Liberal Democrat | Asad Mehmood | 254 | |||
| Majority | |||||
| Turnout | |||||
| Labour win (new seat) | |||||
| Labour win (new seat) | |||||
Garretts Green
| Party | Candidate | Votes | % | ± | |
|---|---|---|---|---|---|
| Labour | Saddak Miah | 961 | 49.6 | ||
| Liberal Democrat | Carol Jones | 824 | 42.6 | ||
| Conservative | Simon Conn | 151 | 7.8 | ||
| Majority | 92 | ||||
| Turnout | 1,940 | ||||
| Labour win (new seat) | |||||
Glebe Farm & Tile Cross
| Party | Candidate | Votes | % | ± | |
|---|---|---|---|---|---|
| Labour | Marje Bridle | 2,302 | |||
| Labour | John Cotton | 2,102 | |||
| Conservative | Rosemary Gasson | 518 | |||
| Conservative | Fergus Robinson | 456 | |||
| Independent | Paul Clayton | 366 | |||
| Liberal Democrat | Rafiqur Rahman | 256 | |||
| Liberal Democrat | Shamsur Rehman | 244 | |||
| Majority | |||||
| Turnout | |||||
| Labour win (new seat) | |||||
| Labour win (new seat) | |||||
Heartlands
| Party | Candidate | Votes | % | ± | |
|---|---|---|---|---|---|
| Labour | Shafique Shah | 2,136 | 78.9 | ||
| Independent | Aftab Hussain | 234 | 8.6 | ||
| Liberal Democrat | Faisal Mahmood | 166 | 6.1 | ||
| Conservative | Mary Storer | 111 | 4.1 | ||
| Green | Janet Assheton | 59 | 2.2 | ||
| Majority | 1,902 | ||||
| Turnout | 2,728 | ||||
| Labour win (new seat) | |||||
Shard End
| Party | Candidate | Votes | % | ± | |
|---|---|---|---|---|---|
| Labour | Ian Ward | 911 | 60.8 | ||
| Conservative | John Alden | 371 | 24.8 | ||
| Liberal Democrat | Christopher Barber | 66 | 4.4 | ||
| Green | Mike Harrison | 61 | 4.1 | ||
| Independent | James Scroggie | 61 | 4.1 | ||
| TUSC | Mark Andrews | 28 | 1.9 | ||
| Majority | 540 | ||||
| Turnout | 1,506 | ||||
| Labour hold | Swing | ||||
Sheldon
| Party | Candidate | Votes | % | ± | |
|---|---|---|---|---|---|
| Liberal Democrat | Paul Tilsley | 2,565 | |||
| Liberal Democrat | Mike Ward | 2,342 | |||
| Labour | Bob Collins | 900 | |||
| Labour | Julia Larden | 880 | |||
| Conservative | Nicholas Psirides | 474 | |||
| Conservative | Suhel Ali | 452 | |||
| Green | Kevin Harrison | 131 | |||
| Majority | |||||
| Turnout | |||||
| Liberal Democrat hold | Swing | ||||
| Liberal Democrat hold | Swing | ||||
Small Heath
| Party | Candidate | Votes | % | ± | |
|---|---|---|---|---|---|
| Labour | Zaheer Khan | 3,270 | |||
| Labour | Safia Akhtar | 3,196 | |||
| Liberal Democrat | Shaukat Khan | 1,738 | |||
| Liberal Democrat | Gerry Moynihan | 1,017 | |||
| Conservative | Kabir Uddin | 655 | |||
| Independent | Shaaky Ahmed | 604 | |||
| Conservative | Pervez Akhtar | 547 | |||
| Green | Hazel Clawley | 149 | |||
| Majority | |||||
| Turnout | |||||
| Labour win (new seat) | |||||
| Labour win (new seat) | |||||
South Yardley
| Party | Candidate | Votes | % | ± | |
|---|---|---|---|---|---|
| Liberal Democrat | Zaker Choudhry | 1,507 | 60.4 | ||
| Labour | David Welburn | 601 | 24.1 | ||
| Conservative | Susan Axford | 344 | 13.8 | ||
| Green | Christopher Garghan | 43 | 1.7 | ||
| Majority | |||||
| Turnout | 2,504 | ||||
| Liberal Democrat gain from Labour | Swing | ||||
Ward End
| Party | Candidate | Votes | % | ± | |
|---|---|---|---|---|---|
| Labour | Mohammed Aikhlaq | 1,663 | 54.2 | ||
| Liberal Democrat | Nazabit Ali | 909 | 29.6 | ||
| Independent | Wajid Hussain | 331 | 10.8 | ||
| Conservative | Joseph Hamblin | 166 | 5.4 | ||
| Majority | 754 | ||||
| Turnout | |||||
| Labour win (new seat) | |||||
Yardley East
| Party | Candidate | Votes | % | ± | |
|---|---|---|---|---|---|
| Liberal Democrat | Neil Eustace | 1,856 | 64.9 | ||
| Labour | Ann Wackett | 863 | 30.2 | ||
| Conservative | Edwin Caldecott | 140 | 4.9 | ||
| Majority | 993 | ||||
| Turnout | 2,869 | ||||
| Liberal Democrat win (new seat) | |||||
Yardley West & Stechford
| Party | Candidate | Votes | % | ± | |
|---|---|---|---|---|---|
| Liberal Democrat | Baber Baz | 1,505 | 51.5 | ||
| Labour | Basharat Dad | 1,285 | 29.6 | ||
| Conservative | Ali Mothin | 133 | 4.6 | ||
| Majority | |||||
| Turnout | |||||
| Liberal Democrat win (new seat) | |||||
North of city centre
Castle Vale
| Party | Candidate | Votes | % | ± | |
|---|---|---|---|---|---|
| Conservative | Suzanne Webb | 731 | 50.8 | ||
| Labour | Lynda Clinton | 640 | 44.4 | ||
| Liberal Democrat | Trevor Holtom | 35 | 2.4 | ||
| TUSC | Kris Sucilla O'Sullivan | 34 | 2.4 | ||
| Majority | 91 | ||||
| Turnout | 1,445 | ||||
| Conservative win (new seat) | |||||
Erdington
| Party | Candidate | Votes | % | ± | |
|---|---|---|---|---|---|
| Conservative | Robert Alden | 2,727 | |||
| Conservative | Gareth Moore | 2,456 | |||
| Labour Co-op | Vic Hooper | 1,837 | |||
| Labour Co-op | Dee Smyth | 1,666 | |||
| Green | Rebecca Collins | 259 | |||
| Liberal Democrat | Callum Reilly | 132 | |||
| Liberal Democrat | Thomas Hunt | 126 | |||
| Majority | |||||
| Turnout | |||||
| Conservative hold | Swing | ||||
| Conservative hold | Swing | ||||
Gravelly Hill
| Party | Candidate | Votes | % | ± | |
|---|---|---|---|---|---|
| Labour | Mick Brown | 1,238 | 74.2 | ||
| Conservative | Luqmaan Nawaz | 297 | 17.8 | ||
| Liberal Democrat | Philip Mills | 133 | 8.0 | ||
| Majority | 941 | ||||
| Turnout | 1,668 | ||||
| Labour win (new seat) | |||||
Kingstanding
| Party | Candidate | Votes | % | ± | |
|---|---|---|---|---|---|
| Conservative | Gary Sambrook | 1,745 | |||
| Conservative | Ron Storer | 1,577 | |||
| Labour | Des Hughes | 1,465 | |||
| Labour | Jane Jones | 1,459 | |||
| Liberal Democrat | Violaine Mendez | 97 | |||
| Liberal Democrat | James Perrott | 89 | |||
| Majority | |||||
| Turnout | |||||
| Conservative win (new seat) | |||||
| Conservative win (new seat) | |||||
Oscott
| Party | Candidate | Votes | % | ± | |
|---|---|---|---|---|---|
| Labour | Keith Linnecor | 1,794 | |||
| Labour | Barbara Dring | 1,705 | |||
| Conservative | Tom Coffey | 1,407 | |||
| Conservative | Leona Leung | 1,245 | |||
| Liberal Democrat | Andy Fullylove | 147 | |||
| Green | Harry Eyles | 132 | |||
| Liberal Democrat | Marcia Hunt | 131 | |||
| Majority | |||||
| Turnout | |||||
| Labour hold | Swing | ||||
| Labour hold | Swing | ||||
Perry Barr
| Party | Candidate | Votes | % | ± | |
|---|---|---|---|---|---|
| Liberal Democrat | Jon Hunt | 2,957 | |||
| Liberal Democrat | Morriam Jan | 2,398 | |||
| Labour | Mohammed Hanif | 1,887 | |||
| Labour | Sukhi Kaur | 1,662 | |||
| Conservative | Janet Coffey | 361 | |||
| Conservative | Tariq Rashid | 190 | |||
| TUSC | Corinthia Ward | 78 | |||
| Majority | |||||
| Turnout | |||||
| Liberal Democrat hold | Swing | ||||
| Liberal Democrat hold | Swing | ||||
Perry Common
| Party | Candidate | Votes | % | ± | |
|---|---|---|---|---|---|
| Conservative | Bob Beauchamp | 1,007 | 49.2 | ||
| Labour Co-op | Anita Ward | 955 | 46.7 | ||
| Liberal Democrat | Stephen Allsopp | 84 | 4.1 | ||
| Majority | 52 | ||||
| Turnout | 2,056 | ||||
| Conservative win (new seat) | |||||
Pype Hayes
| Party | Candidate | Votes | % | ± | |
|---|---|---|---|---|---|
| Labour | Mike Sharpe | 851 | 45.9 | ||
| Conservative | Clifton Welch | 835 | 45.1 | ||
| Liberal Democrat | Ann Holtom | 109 | 5.9 | ||
| Green | John Bentley | 58 | 3.1 | ||
| Majority | 16 | ||||
| Turnout | 1,856 | ||||
| Labour win (new seat) | |||||
Stockland Green
| Party | Candidate | Votes | % | ± | |
|---|---|---|---|---|---|
| Labour | Penny Holbrook | 2,536 | |||
| Labour | Josh Jones | 2,259 | |||
| Conservative | Mohammad Kayani | 726 | |||
| Conservative | Asif Mehmood | 686 | |||
| Liberal Democrat | Joe Harmer | 238 | |||
| Liberal Democrat | Rizwan Syed | 149 | |||
| TUSC | Ted Woodley | 127 | |||
| Majority | |||||
| Turnout | |||||
| Labour hold | Swing | ||||
| Labour hold | Swing | ||||
South-east of city centre
Acocks Green
| Party | Candidate | Votes | % | ± | |
|---|---|---|---|---|---|
| Labour | John O'Shea | 2,249 | |||
| Liberal Democrat | Roger Harmer | 1,857 | |||
| Liberal Democrat | Penny Wagg | 1,737 | |||
| Labour | Fiona Williams | 1,521 | |||
| Conservative | Wajad Ali | 525 | |||
| Conservative | Luke Watson | 329 | |||
| Green | Amanda Baker | 201 | |||
| TUSC | Eamonn Flynn | 71 | |||
| Majority | |||||
| Turnout | |||||
| Labour hold | Swing | ||||
| Liberal Democrat hold | Swing | ||||
Balsall Heath West
| Party | Candidate | Votes | % | ± | |
|---|---|---|---|---|---|
| Labour | Zhor Malik | 1,938 | 76.4 | ||
| Liberal Democrat | Islam Issa | 204 | 8.0 | ||
| Birmingham Worker | Sammi Ibrahem | 156 | 6.2 | ||
| Conservative | Ali Fazel | 139 | 5.5 | ||
| Green | Martin Guest | 98 | 3.9 | ||
| Majority | 1,734 | ||||
| Turnout | 2,570 | ||||
| Labour win (new seat) | |||||
Brandwood & King's Heath
| Party | Candidate | Votes | % | ± | |
|---|---|---|---|---|---|
| Labour | Lisa Trickett | 3,395 | |||
| Labour | Mike Leddy | 3,350 | |||
| Conservative | Gordon Franks | 1,122 | |||
| Conservative | Joshua Mackenzie-Lawrie | 829 | |||
| Green | Patrick Cox | 658 | |||
| Liberal Democrat | Chris Burgess | 479 | |||
| Green | Julie Kaya | 392 | |||
| Liberal Democrat | Rob Gilliam | 293 | |||
| Birmingham Worker | Katherine Cremer | 95 | |||
| TUSC | Bill Murray | 78 | |||
| Majority | |||||
| Turnout | |||||
| Labour win (new seat) | |||||
| Labour win (new seat) | |||||
Druids Heath and Monyhull
| Party | Candidate | Votes | % | ± | |
|---|---|---|---|---|---|
| Green | Julien Pritchard | 1,201 | 45.48 | ||
| Labour | Victoria Quinn | 725 | 27.45 | ||
| Conservative | Ben Brittain | 688 | 26.05 | ||
| Liberal Democrat | Emily Cox | 27 | 1.02 | ||
| Majority | 476 | ||||
| Turnout | 2,646 | ||||
| Green win (new seat) | |||||
Hall Green North
| Party | Candidate | Votes | % | ± | |
|---|---|---|---|---|---|
| Labour | Akhlaq Ahmed | 2,989 | |||
| Labour | Lou Robson | 2,922 | |||
| Independent | Bob Harvey | 1,098 | |||
| Conservative | Sohan Singh | 687 | |||
| Conservative | Tukeer Hussain | 529 | |||
| Liberal Democrat | Andy Spruce | 386 | |||
| Liberal Democrat | Stephanie Spruce | 345 | |||
| Green | Gareth Courage | 341 | |||
| Majority | |||||
| Turnout | |||||
| Labour win (new seat) | |||||
| Labour win (new seat) | |||||
Hall Green South
| Party | Candidate | Votes | % | ± | |
|---|---|---|---|---|---|
| Conservative | Tim Huxtable | 1,744 | 60.0 | ||
| Labour Co-op | Changese Khan | 855 | 30.4 | ||
| Liberal Democrat | Jerry Evans | 154 | 5.3 | ||
| Green | Ulla Grant | 124 | 4.3 | ||
| Majority | 859 | ||||
| Turnout | 2,916 | ||||
| Conservative win (new seat) | |||||
Highter's Heath
| Party | Candidate | Votes | % | ± | |
|---|---|---|---|---|---|
| Conservative | Adam Higgs | 1,362 | 61.7 | ||
| Labour | Barry Bowles | 709 | 32.1 | ||
| Green | Clare Thomas | 79 | 3.6 | ||
| Liberal Democrat | Kirsty Jerome | 57 | 2.6 | ||
| Majority | 653 | ||||
| Turnout | 2,213 | ||||
| Conservative win (new seat) | |||||
Moseley
| Party | Candidate | Votes | % | ± | |
|---|---|---|---|---|---|
| Labour | Kerry Jenkins | 3,123 | 26.75 | ||
| Labour | Martin Straker-Welds | 3,114 | 26.67 | ||
| Liberal Democrat | Izzy Knowles | 2,211 | 18.94 | ||
| Liberal Democrat | David Farrow | 1,494 | 12.80 | ||
| Green | Rachel Xerri-Brooks | 608 | 5.21 | ||
| Conservative | John Turner | 579 | 4.96 | ||
| Conservative | Dominic O'Callaghan | 547 | 4.68 | ||
| Majority | |||||
| Turnout | |||||
| Labour win (new seat) | |||||
| Labour win (new seat) | |||||
Sparkbrook & Balsall Heath East
| Party | Candidate | Votes | % | ± | |
|---|---|---|---|---|---|
| Labour | Mohammed Azim | 4,257 | |||
| Labour | Shabrana Hussain | 3,950 | |||
| Conservative | Abu Nowshed | 701 | |||
| Conservative | Mohammad Sweet | 665 | |||
| Green | Roxanne Green | 237 | |||
| Liberal Democrat | Joynal Abedin | 201 | |||
| Liberal Democrat | Satwinder Singh | 159 | |||
| Labour hold | Swing | ||||
| Labour hold | Swing | ||||
Sparkhill
| Party | Candidate | Votes | % | ± | |
|---|---|---|---|---|---|
| Labour | Mohammed Fazal | 3,140 | |||
| Labour | Nicky Brennan | 2,971 | |||
| Liberal Democrat | Tanveer Choudhry | 1,295 | |||
| Liberal Democrat | Tassawer Hussain | 1,178 | |||
| Conservative | Murad Mohammed | 453 | |||
| Conservative | Mohammed Talukder | 440 | |||
| Majority | |||||
| Turnout | |||||
| Labour win (new seat) | |||||
| Labour win (new seat) | |||||
Tyseley & Hay Mills
| Party | Candidate | Votes | % | ± | |
|---|---|---|---|---|---|
| Labour | Zafar Iqbal | 1,361 | 66.6 | ||
| Liberal Democrat | Syed Ali | 306 | 15.0 | ||
| Conservative | Shafayet Khan | 208 | 10.2 | ||
| Liberal | Mike Sheridan | 170 | 8.3 | ||
| Majority | |||||
| Turnout | |||||
| Labour win (new seat) | |||||
South-west of city centre
Allens Cross
| Party | Candidate | Votes | % | ± | |
|---|---|---|---|---|---|
| Conservative | Eddie Freeman | 1,023 | 48.8 | ||
| Labour Co-op | Steve Bedser | 974 | 44.6 | ||
| Common Good | Dick Rodgers | 72 | 3.3 | ||
| Liberal Democrat | Clare Fielden | 63 | 2.9 | ||
| Green | Peter Beck | 52 | 2.4 | ||
| Majority | 49 | ||||
| Turnout | 2,189 | ||||
| Conservative win (new seat) | |||||
Bartley Green
| Party | Candidate | Votes | % | ± | |
|---|---|---|---|---|---|
| Conservative | Bruce Lines | 2,627 | |||
| Conservative | John Lines | 2,626 | |||
| Labour | Paul Preston | 1,296 | |||
| Labour | Joanne Shemmans | 1,197 | |||
| Green | James Robertson | 188 | |||
| Liberal Democrat | David Osborne | 113 | |||
| Liberal Democrat | Maureen Osborne | 110 | |||
| Majority | |||||
| Turnout | |||||
| Conservative hold | Swing | ||||
| Conservative hold | Swing | ||||
Billesley
| Party | Candidate | Votes | % | ± | |
|---|---|---|---|---|---|
| Labour | Phil Davis | 2,537 | |||
| Labour | Lucy Seymour-Smith | 2,309 | |||
| Conservative | Tom Huxley | 2,037 | |||
| Conservative | Jane James | 2,035 | |||
| Green | Robert Grant | 232 | |||
| Liberal Democrat | Alan Morrow | 220 | |||
| Green | David Gaussen | 139 | |||
| Liberal Democrat | Phil Wagg | 110 | |||
| Majority | |||||
| Turnout | |||||
| Labour hold | Swing | ||||
| Labour hold | Swing | ||||
Bournbrook & Selly Park
| Party | Candidate | Votes | % | ± | |
|---|---|---|---|---|---|
| Labour Co-op | Brigid Jones | 1,884 | |||
| Labour Co-op | Karen McCarthy | 1,773 | |||
| Liberal Democrat | Jake Calcutt | 476 | |||
| Conservative | Monica Hardie | 423 | |||
| Liberal Democrat | Sophie Thornton | 413 | |||
| Conservative | Angus Gillan | 411 | |||
| Green | Alice Kiff | 266 | |||
| Green | Benjamin Mabbett | 123 | |||
| TUSC | Sam Witts | 82 | |||
| Majority | |||||
| Turnout | |||||
| Labour Co-op win (new seat) | |||||
| Labour Co-op win (new seat) | |||||
Bournville & Cotteridge
| Party | Candidate | Votes | % | ± | |
|---|---|---|---|---|---|
| Labour | Liz Clements | 2,809 | 26.56 | ||
| Labour | Fred Grindrod | 2,505 | 23.68 | ||
| Conservative | Rob Sealey | 2,065 | 19.52 | ||
| Conservative | Peter Douglas Osborn | 1,899 | 17.95 | ||
| Green | Anna Masters | 410 | 3.88 | ||
| Green | Claire Hammond | 371 | 3.51 | ||
| Liberal Democrat | Dave Radcliffe | 284 | 2.68 | ||
| Liberal Democrat | Tim Stimpson | 194 | 1.83 | ||
| TUSC | Clive Walder | 41 | 0.39 | ||
| Majority | |||||
| Turnout | |||||
| Labour win (new seat) | |||||
| Labour win (new seat) | |||||
Frankley Great Park
| Party | Candidate | Votes | % | ± | |
|---|---|---|---|---|---|
| Conservative | Simon Morrall | 1,019 | 50.9 | ||
| Labour | Andrew Cartwright | 904 | 45.2 | ||
| Liberal Democrat | Gerry Jerome | 78 | 3.9 | ||
| Majority | 115 | ||||
| Turnout | 2,012 | ||||
| Conservative win (new seat) | |||||
King's Norton North
| Party | Candidate | Votes | % | ± | |
|---|---|---|---|---|---|
| Labour | Alex Aitken | 1,341 | 49.77 | ||
| Conservative | Simon Jevon | 1,237 | 45.91 | ||
| Liberal Democrat | Brian Peace | 95 | 3.52 | ||
| Majority | 104 | 3.86 | |||
| Turnout | 2,694 | ||||
| Labour win (new seat) | |||||
King's Norton South
| Party | Candidate | Votes | % | ± | |
|---|---|---|---|---|---|
| Labour | Peter Griffiths | 1,015 | 51.7 | ||
| Conservative | Barbara Wood | 843 | 42.9 | ||
| Liberal Democrat | Peter Lloyd | 106 | 5.4 | ||
| Majority | 172 | ||||
| Turnout | 1,970 | ||||
| Labour win (new seat) | |||||
Longbridge & West Heath
| Party | Candidate | Votes | % | ± | |
|---|---|---|---|---|---|
| Conservative | Debbie Clancy | 2,174 | 26 | ||
| Labour | Brett O'Reilly | 1,925 | 23 | ||
| Conservative | Graham Knight | 1,911 | 22.8 | ||
| Labour | Carmel Corrigan | 1,863 | 22.3 | ||
| Green | Susan Pearce | 290 | 3 | ||
| Liberal Democrat | Hugh Duffy | 101 | 1 | ||
| Liberal Democrat | Jim Whorwood | 89 | 1 | ||
| Majority | |||||
| Turnout | 8353 | ||||
| Conservative win (new seat) | |||||
| Labour win (new seat) | |||||
Northfield
| Party | Candidate | Votes | % | ± | |
|---|---|---|---|---|---|
| Labour | Olly Armstrong | 1,635 | 53.5 | ||
| Conservative | Randal Brew | 1,257 | 41.1 | ||
| Green | Margaret Okole | 84 | 2.7 | ||
| Liberal Democrat | Andy Moles | 81 | 2.6 | ||
| Majority | 378 | ||||
| Turnout | 3064 | ||||
| Labour hold | Swing | ||||
Rubery & Rednal
| Party | Candidate | Votes | % | ± | |
|---|---|---|---|---|---|
| Conservative | Adrian Delaney | 969 | 53.4 | ||
| Labour | Carole Griffiths | 706 | 38.9 | ||
| Green | Rob Ball | 89 | 4.9 | ||
| Liberal Democrat | Kevin Hannon | 52 | 2.9 | ||
| Majority | 263 | ||||
| Turnout | 1,819 | ||||
| Conservative win (new seat) | |||||
Stirchley
| Party | Candidate | Votes | % | ± | |
|---|---|---|---|---|---|
| Labour Co-op | Mary Locke | 1,856 | 66.76 | ||
| Conservative | Owen Williams | 576 | 20.7 | ||
| Green | Elly Stanton | 155 | 5.57 | ||
| Liberal Democrat | Phil Banting | 141 | 5.07 | ||
| Birmingham Worker | Reuben Lawrence | 45 | 1.61 | ||
| Majority | 1,280 | 46% | |||
| Turnout | 2,780 | ||||
| Labour Co-op win (new seat) | |||||
Weoley & Selly Oak
| Party | Candidate | Votes | % | ± | |
|---|---|---|---|---|---|
| Labour | Julie Johnson | 2,080 | |||
| Labour | Tristan Chatfield | 2,035 | |||
| Conservative | Andrew Hardie | 1,885 | |||
| Conservative | Des Flood | 1,875 | |||
| Green | Eleanor Masters | 410 | |||
| Liberal Democrat | Trevor Sword | 329 | |||
| Liberal Democrat | Robert Wright | 274 | |||
| TUSC | Nick Hart | 77 | |||
| Majority | |||||
| Turnout | |||||
| Labour win (new seat) | |||||
| Labour win (new seat) | |||||
Sutton Coldfield
Sutton Four Oaks
| Party | Candidate | Votes | % | ± | |
|---|---|---|---|---|---|
| Conservative | Maureen Cornish | 1,957 | 77.1 | ||
| Labour | Roger Barley | 340 | 13.4 | ||
| Liberal Democrat | David Willett | 141 | 5.6 | ||
| Green | Fiona Nunan | 100 | 3.9 | ||
| Majority | 1,617 | ||||
| Turnout | 2,558 | ||||
| Conservative hold | Swing | ||||
Sutton Mere Green
| Party | Candidate | Votes | % | ± | |
|---|---|---|---|---|---|
| Conservative | Meirion Jenkins | 2,062 | 71.8 | ||
| Labour | Ian Brindley | 462 | 16.1 | ||
| Liberal Democrat | Jonny Mayner | 194 | 6.8 | ||
| Green | David Ratcliff | 153 | 5.3 | ||
| Majority | 1,600 | ||||
| Turnout | 2,890 | ||||
| Conservative win (new seat) | |||||
Sutton Reddicap
| Party | Candidate | Votes | % | ± | |
|---|---|---|---|---|---|
| Conservative | Charlotte Hodivala | 1,008 | 56.7 | ||
| Labour | Judy Preston | 537 | 30.2 | ||
| Liberal Democrat | Tim Cotterill | 121 | 6.8 | ||
| UKIP | Stewart Cotterill | 111 | 6.2 | ||
| Majority | 471 | ||||
| Turnout | 1,794 | ||||
| Conservative win (new seat) | |||||
Sutton Roughley
| Party | Candidate | Votes | % | ± | |
|---|---|---|---|---|---|
| Conservative | Ewan Mackey | 1,809 | 67.4 | ||
| Labour | Paul Tomlinson | 521 | 19.4 | ||
| Liberal Democrat | Kate Potter | 215 | 8.0 | ||
| Green | Will Greaves | 140 | 5.2 | ||
| Majority | 1,288 | ||||
| Turnout | 2,695 | ||||
| Conservative hold | Swing | ||||
Sutton Trinity
| Party | Candidate | Votes | % | ± | |
|---|---|---|---|---|---|
| Conservative | David Pears | 1,355 | 57.1 | ||
| Labour | Peter French | 593 | 25.0 | ||
| Liberal Democrat | Jenny Wilkinson | 299 | 12.6 | ||
| Green | Sean Madden | 124 | 5.2 | ||
| Majority | |||||
| Turnout | |||||
| Conservative hold | Swing | ||||
Sutton Vesey
| Party | Candidate | Votes | % | ± | |
|---|---|---|---|---|---|
| Labour | Rob Pocock | 3,377 | 30.6 | ||
| Labour | Kath Scott | 2,458 | 22.2 | ||
| Conservative | Janet Cairns | 2,354 | 21.3 | ||
| Conservative | Louise Passey | 2,182 | 19.7 | ||
| Green | Colin Marriott | 297 | 2.7 | ||
| Liberal Democrat | Matthew Gibson | 271 | 2.5 | ||
| Liberal Democrat | Mohammed Khalid | 110 | 1.0 | ||
| Majority | |||||
| Turnout | |||||
| Labour win (new seat) | |||||
| Labour win (new seat) | |||||
Sutton Walmley & Minworth
| Party | Candidate | Votes | % | ± | |
|---|---|---|---|---|---|
| Conservative | David Barrie | 2,445 | 35.0 | ||
| Conservative | Ken Wood | 1,869 | 26.8 | ||
| Labour | Katy Coxall | 696 | 10.0 | ||
| Independent | David O’Hagan | 646 | 9.3 | ||
| Labour | Paul Finnegan | 574 | 8.2 | ||
| Green | Ben Auton | 336 | 4.8 | ||
| Liberal Democrat | David Cooke | 236 | 3.4 | ||
| Liberal Democrat | James Garrington | 179 | 2.6 | ||
| Majority | |||||
| Turnout | |||||
| Conservative win (new seat) | |||||
| Conservative win (new seat) | |||||
Sutton Wylde Green
| Party | Candidate | Votes | % | ± | |
|---|---|---|---|---|---|
| Conservative | Alex Yip | 1,806 | 65.6 | ||
| Labour | Terry Johnson | 644 | 23.4 | ||
| Liberal Democrat | Malcolm Spencer | 162 | 5.9 | ||
| Green | Zoe Challenor | 142 | 5.2 | ||
| Majority | |||||
| Turnout | |||||
| Conservative win (new seat) | |||||
References
- ↑ "Local Government Boundary Review". Birmingham City Council. Retrieved 3 April 2017.
- ↑ "New Ward Maps". Birmingham City Council. Retrieved 3 April 2017.
- ↑ "The City of Birmingham (Electoral Changes) Order 2016". UK Government Legislation – The National Archives. Retrieved 4 April 2017.
- ↑ "Representation of the People Act 1983, Section 2". Legislation.gov.uk. Retrieved 29 January 2018.
- ↑ Electoral Commission. "I have two homes. Can I register at both addresses?". electoralcommission.org.uk. The Electoral Commission. Retrieved 29 January 2018.
- ↑ "Birmingham City Council Election 2018 Results". BBC. Retrieved 4 May 2018.
- ↑ Neil Elkes (10 May 2012). "Eight years of Conservative-Liberal Democrat rule in Birmingham". Birmingham Post. Retrieved 5 May 2018.