Wirral Metropolitan Borough Council election, 2010
|
| |||||||||||||||||||||||||||||||||||||||||||||||||
| |||||||||||||||||||||||||||||||||||||||||||||||||
23 of 66 seats (One Third and one by-election) to Wirral Metropolitan Borough Council 34 seats needed for a majority | |||||||||||||||||||||||||||||||||||||||||||||||||
|---|---|---|---|---|---|---|---|---|---|---|---|---|---|---|---|---|---|---|---|---|---|---|---|---|---|---|---|---|---|---|---|---|---|---|---|---|---|---|---|---|---|---|---|---|---|---|---|---|---|
| Turnout |
65.3% ( | ||||||||||||||||||||||||||||||||||||||||||||||||
| |||||||||||||||||||||||||||||||||||||||||||||||||
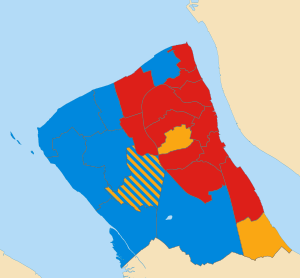 Map of results of 2010 election | |||||||||||||||||||||||||||||||||||||||||||||||||
| |||||||||||||||||||||||||||||||||||||||||||||||||

The 2010 Wirral Metropolitan Borough Council election took place on 6 May 2010 to elect members of Wirral Metropolitan Borough Council in England. This election was held on the same day as other local elections.
The council stayed under no overall control, with the Conservatives becoming the largest single party, and resulted in a new Lib—Con coalition.
After the election, the composition of the council was:
| Party | Seats | ± | |
|---|---|---|---|
| Conservative | 27 | ||
| Labour | 24 | ||
| Liberal Democrat | 15 | ||
| Independent Conservative | 0 | ||
Election results
Overall election result
Overall result compared with 2008.
| Wirral Metropolitan Borough Council election result, 2010 | |||||||||||||||
|---|---|---|---|---|---|---|---|---|---|---|---|---|---|---|---|
| Party | Candidates | Votes | |||||||||||||
| Stood | Elected | Gained | Unseated | Net | % of total | % | № | Net % | |||||||
| Labour | 23 | 12 | 4 | 0 | 54.5 | 37.6 | 58,715 | ||||||||
| Conservative | 23 | 8 | 4 | 2 | 34.1 | 32.1 | 50,206 | ||||||||
| Liberal Democrat | 23 | 3 | 0 | 5 | 11.4 | 22.5 | 35,168 | ||||||||
| Green | 21 | 0 | 0 | 0 | 0.0 | 3.6 | 5,623 | ||||||||
| UKIP | 19 | 0 | 0 | 0 | 0.0 | 3.4 | 5,307 | ||||||||
| BNP | 5 | 0 | 0 | 0 | 0.0 | 0.9 | 1,339 | ||||||||
| Ind. Conservative | 0 | 0 | 0 | 0 | 0.0 | 0.0 | 0 | N/A | |||||||
Changes in council composition
Prior to the election the composition of the council was:
| 25 | 20 | 19 | 1 | 1 |
| Con | Lab | Lib Dem | IC | V |
After the election the composition of the council was:
| 27 | 24 | 15 |
| Con | Lab | Lib Dem |
Ward results
Results compared directly with the last local election in 2008 except for Moreton West and Saughall Massie which is compared directly with the 2009 Moreton West and Saughall Massie by-election.
Bebington
| Party | Candidate | Votes | % | ± | |
|---|---|---|---|---|---|
| Labour | Walter Smith | 3,822 | 45.9 | ||
| Conservative | Kevin Sharkey | 2,482 | 29.8 | ||
| Liberal Democrat | Catherine Jennings | 1,315 | 15.8 | ||
| UKIP | Hilary Jones | 520 | 6.2 | ||
| Green | Michael Harper | 186 | 2.2 | ||
| Majority | 1,340 | 16.1 | N/A | ||
| Registered electors | 11,793 | ||||
| Turnout | 71.4 | ||||
| Labour hold | Swing | ||||
Bidston and St James
| Party | Candidate | Votes | % | ± | |
|---|---|---|---|---|---|
| Labour | Ann McLachlan | 2,932 | 63.1 | ||
| Liberal Democrat | John Brace | 699 | 15.0 | ||
| Conservative | John Gilbert | 502 | 10.8 | ||
| BNP | John Edwards | 251 | 5.4 | ||
| UKIP | Audrey Fitpatrick | 154 | 3.3 | New | |
| Green | George Bowler | 111 | 2.4 | ||
| Majority | 2,233 | 48.1 | |||
| Registered electors | 9,768 | ||||
| Turnout | 48.1 | ||||
| Labour hold | Swing | ||||
Birkenhead and Tranmere
| Party | Candidate | Votes | % | ± | |
|---|---|---|---|---|---|
| Labour | Brian Kenny | 2,409 | 51.8 | ||
| Green | Pat Cleary | 1,095 | 23.6 | ||
| Liberal Democrat | Peter Heppinstall | 566 | 12.2 | ||
| Conservative | June Cowin | 380 | 8.2 | ||
| UKIP | David Martin | 198 | 4.3 | New | |
| Majority | 1,314 | 28.2 | |||
| Registered electors | 9,956 | ||||
| Turnout | 47.3 | ||||
| Labour hold | Swing | ||||
Bromborough
| Party | Candidate | Votes | % | ± | |
|---|---|---|---|---|---|
| Labour | Irene Williams | 3,016 | 44.6 | ||
| Liberal Democrat | Madeline Booth | 1,815 | 26.9 | ||
| Conservative | Sue Colquhoun | 1,428 | 21.1 | ||
| BNP | David Bell | 328 | 4.9 | ||
| Green | Percy Hogg | 132 | 2.5 | ||
| Majority | 1,201 | 17.7 | N/A | ||
| Registered electors | 10,758 | ||||
| Turnout | 63.7 | ||||
| Labour gain from Liberal Democrat | Swing | ||||
Clatterbridge
| Party | Candidate | Votes | % | ± | |
|---|---|---|---|---|---|
| Conservative | Peter Kearney | 3,733 | 43.4 | ||
| Liberal Democrat | Simon Thomson | 2,313 | 26.9 | ||
| Labour | Audrey Moore | 2,015 | 23.4 | ||
| UKIP | Roger Jones | 361 | 4.2 | ||
| Green | Jim McGinley | 187 | 2.2 | ||
| Majority | 1,420 | 16.5 | |||
| Registered electors | 11,706 | ||||
| Turnout | 74.7 | ||||
| Conservative gain from Liberal Democrat | Swing | ||||
Claughton
| Party | Candidate | Votes | % | ± | |
|---|---|---|---|---|---|
| Labour | Denise Roberts | 3,521 | 51.5 | ||
| Conservative | Barbara Sinclair | 1,574 | 23.0 | ||
| Liberal Democrat | Margaret Teggin | 1,182 | 17.3 | ||
| UKIP | Bethan Williams | 319 | 4.7 | New | |
| Green | Cathy Page | 240 | 3.5 | ||
| Majority | 1,947 | 28.5 | |||
| Registered electors | 11,340 | ||||
| Turnout | 61.0 | ||||
| Labour hold | Swing | ||||
Eastham
| Party | Candidate | Votes | % | ± | |
|---|---|---|---|---|---|
| Liberal Democrat | Tom Harney | 3,824 | 50.0 | ||
| Labour | Willow Colios | 1,942 | 25.4 | ||
| Conservative | Nick Whieldon | 1,644 | 21.5 | ||
| UKIP | Laurence Jones | 241 | 3.1 | New | |
| Majority | 1,882 | 24.6 | |||
| Registered electors | 11,095 | ||||
| Turnout | 69.2 | ||||
| Liberal Democrat hold | Swing | ||||
Greasby, Frankby and Irby
| Party | Candidate | Votes | % | ± | |
|---|---|---|---|---|---|
| Conservative | Wendy Clements | 3,538 | 40.3 | ||
| Liberal Democrat | Alaine Christian | 2,949 | 33.5 | ||
| Labour | Geoffrey Dormand | 1,800 | 20.5 | ||
| UKIP | Derek Snowden | 287 | 3.3 | New | |
| Green | Michael Gardner | 216 | 2.5 | ||
| Majority | 589 | 6.8 | N/A | ||
| Registered electors | 11,611 | ||||
| Turnout | 76.0 | ||||
| Conservative gain from Liberal Democrat | Swing | ||||
Heswall
| Party | Candidate | Votes | % | ± | |
|---|---|---|---|---|---|
| Conservative | Les Rowlands | 5,000 | 59.1 | ||
| Liberal Democrat | Alexander Clark | 1,534 | 18.1 | ||
| Labour | Yvonne Nolan | 1,465 | 17.3 | ||
| Green | Matthew Rosseinsky | 251 | 3.0 | ||
| UKIP | Oliver Sayle-Adam | 213 | 2.5 | ||
| Majority | 3,466 | 41.0 | |||
| Registered electors | 10,992 | ||||
| Turnout | 77.4 | ||||
| Conservative hold | Swing | ||||
Hoylake and Meols
| Party | Candidate | Votes | % | ± | |
|---|---|---|---|---|---|
| Conservative | Eddie Boult | 3,748 | 49.3 | ||
| Labour | Paul Doughty | 1,848 | 24.3 | ||
| Liberal Democrat | Mark Corran | 1,417 | 18.6 | ||
| Green | Yvonne McGinley | 397 | 5.2 | ||
| UKIP | Frank Whitham | 197 | 2.6 | New | |
| Majority | 1,900 | 25.0 | |||
| Registered electors | 10,457 | ||||
| Turnout | 73.3 | ||||
| Conservative gain from Ind. Conservative | Swing | ||||
Leasowe and Moreton East
| Party | Candidate | Votes | % | ± | |
|---|---|---|---|---|---|
| Labour | Ann McArdle | 3,404 | 51.9 | ||
| Conservative | Steve Smith | 1,948 | 29.7 | ||
| Liberal Democrat | Gerald Hainsworth | 866 | 13.2 | ||
| UKIP | Russell Jones | 216 | 3.3 | New | |
| Green | Shirley Johnson | 129 | 2.0 | ||
| Majority | 1,456 | 22.2 | N/A | ||
| Registered electors | 10,905 | ||||
| Turnout | 60.7 | ||||
| Labour hold | Swing | ||||
Liscard
| Party | Candidate | Votes | % | ± | |
|---|---|---|---|---|---|
| Labour | Darren Dodd | 3,220 | 46.8 | ||
| Conservative | Leah Fraser | 2,474 | 36.0 | ||
| Liberal Democrat | Daniel Clein | 718 | 10.4 | ||
| UKIP | Lynda Williams | 238 | 3.5 | ||
| Green | John Bleasdale | 231 | 3.4 | ||
| Majority | 746 | 10.8 | N/A | ||
| Registered electors | 11,071 | ||||
| Turnout | 63.1 | ||||
| Labour gain from Conservative | Swing | ||||
Moreton West and Saughall Massie
Compared with 2009 by-election.
| Party | Candidate | Votes | % | ± | |
|---|---|---|---|---|---|
| Conservative | Simon Mountney | 2,976 | 41.5 | ||
| Labour | Deirdre Wood | 2,635 | 36.7 | ||
| Liberal Democrat | Eric Copestake | 992 | 13.8 | ||
| UKIP | Susan Whitham | 236 | 3.3 | New | |
| BNP | Brian Winson | 223 | 3.1 | New | |
| Green | Perle Sheldricks | 113 | 1.6 | ||
| Majority | 341 | 4.8 | |||
| Registered electors | 10,824 | ||||
| Turnout | 66.7 | ||||
| Conservative hold | Swing | ||||
New Brighton
| Party | Candidate | Votes | % | ± | |
|---|---|---|---|---|---|
| Labour | Patricia Glasman | 3,072 | 44.0 | ||
| Conservative | Bill Duffey | 2,173 | 31.2 | ||
| Liberal Democrat | Julia Codling | 1,166 | 16.7 | ||
| Green | Cynthia Stonall | 342 | 4.9 | ||
| UKIP | Timothy Pass | 222 | 3.2 | New | |
| Majority | 899 | 12.8 | N/A | ||
| Registered electors | 11,025 | ||||
| Turnout | 63.6 | ||||
| Labour gain from Conservative | Swing | ||||
Oxton
| Party | Candidate | Votes | % | ± | |
|---|---|---|---|---|---|
| Liberal Democrat | Alan Brighthouse | 2,941 | 40.5 | ||
| Labour | David Barden | 2,310 | 31.8 | ||
| Conservative | Tina McDonnell | 1,425 | 19.6 | ||
| UKIP | Catherine Williams | 301 | 4.2 | ||
| Green | Garnette Bowler | 276 | 3.8 | ||
| Majority | 631 | 8.7 | |||
| Registered electors | 11,237 | ||||
| Turnout | 65.1 | ||||
| Liberal Democrat hold | Swing | ||||
Pensby and Thingwall
| Party | Candidate | Votes | % | ± | |
|---|---|---|---|---|---|
| Liberal Democrat | Mark Johnston [n 2] | 2,854 | 35.8 | ||
| Conservative | Don McCubbin [n 3] | 2,479 | 31.1 | ||
| Liberal Democrat | Michael Redfern | 2,297 | – | – | |
| Conservative | Adam Sykes | 2,103 | – | – | |
| Labour | Michael Sullivan | 1,673 | 21.0 | ||
| Labour | Sylvia Hodrien | 1,517 | – | – | |
| UKIP | Janet Davison | 518 | 6.5 | ||
| Green | Allen Burton | 448 | 5.6 | ||
| Majority | 375 | 4.7 | |||
| Registered electors | 10,666 | ||||
| Turnout | 71.5 | ||||
| Liberal Democrat hold | Swing | ||||
| Conservative gain from Liberal Democrat | Swing | – | |||
Prenton
| Party | Candidate | Votes | % | ± | |
|---|---|---|---|---|---|
| Labour | Denise Realey | 2,827 | 39.6 | ||
| Liberal Democrat | Frank Doyle | 2,258 | 31.6 | ||
| Conservative | Robert Hughes | 1,316 | 18.4 | ||
| UKIP | Bruce Cain | 369 | 5.2 | New | |
| BNP | Lee Griffiths | 219 | 3.1 | New | |
| Green | Mark Mitchell | 150 | 2.1 | ||
| Majority | 569 | 8.0 | N/A | ||
| Registered electors | 11,039 | ||||
| Turnout | 64.9 | ||||
| Labour gain from Liberal Democrat | Swing | ||||
Rock Ferry
| Party | Candidate | Votes | % | ± | |
|---|---|---|---|---|---|
| Labour | Moira McLaughlin | 2,915 | 59.7 | ||
| Liberal Democrat | Lynne Short | 791 | 16.2 | ||
| Conservative | Rachel Suffield | 694 | 14.2 | ||
| BNP | Janice Brady | 318 | 6.5 | New | |
| Green | Joyce Hogg | 162 | 3.3 | ||
| Majority | 2,124 | 43.5 | |||
| Registered electors | 9,829 | ||||
| Turnout | 50.6 | ||||
| Labour hold | Swing | ||||
Seacombe
| Party | Candidate | Votes | % | ± | |
|---|---|---|---|---|---|
| Labour | Adrian Jones | 3,349 | 62.8 | ||
| Conservative | Tony Cox | 916 | 17.2 | ||
| Liberal Democrat | Steve Pitt | 725 | 13.6 | ||
| UKIP | Christopher Wellstead | 238 | 4.5 | ||
| Green | Jacqueline Smith | 109 | 2.0 | ||
| Majority | 2,433 | 45.6 | |||
| Registered electors | 10,357 | ||||
| Turnout | 52.4 | ||||
| Labour hold | Swing | ||||
Upton
| Party | Candidate | Votes | % | ± | |
|---|---|---|---|---|---|
| Labour | Stuart Whittingham | 3,827 | 50.2 | ||
| Conservative | Geoff Gubb | 2,143 | 28.1 | ||
| Liberal Democrat | Alan Davies | 1,370 | 18.0 | ||
| Green | Lesley Hussenbux | 286 | 3.8 | ||
| Majority | 1,684 | 22.1 | N/A | ||
| Registered electors | 12,214 | ||||
| Turnout | 62.9 | ||||
| Labour hold | Swing | ||||
Wallasey
| Party | Candidate | Votes | % | ± | |
|---|---|---|---|---|---|
| Conservative | Lesley Rennie | 3,623 | 42.8 | ||
| Labour | Christine Jones | 3,082 | 36.4 | ||
| Liberal Democrat | John Codling | 1,269 | 15.0 | ||
| UKIP | Ian Watson | 255 | 3.0 | ||
| Green | James Brady | 234 | 2.8 | ||
| Majority | 541 | 6.4 | |||
| Registered electors | 12,061 | ||||
| Turnout | 70.9 | ||||
| Conservative hold | Swing | ||||
West Kirby and Thurstaston
| Party | Candidate | Votes | % | ± | |
|---|---|---|---|---|---|
| Conservative | Jeff Green | 4,010 | 51.7 | ||
| Labour | Lee Rushworth | 1,631 | 21.0 | ||
| Liberal Democrat | John Cresswell | 1,604 | 20.7 | ||
| Green | Hara Willow | 290 | 3.7 | ||
| UKIP | Philip Griffiths | 224 | 2.9 | ||
| Majority | 2,379 | 30.7 | |||
| Registered electors | 10,348 | ||||
| Turnout | 75.4 | ||||
| Conservative hold | Swing | ||||
Notes
• italics denote the sitting councillor • bold denotes the winning candidate
References
- ↑ "Election Result for 6 May 2010". Wirral Metropolitan Borough Council.
- ↑ "Election Result for Bebington ward on 6 May 2010". Wirral Metropolitan Borough Council.
- ↑ "Councillor Walter Smith". Wirral Metropolitan Borough Council.
- ↑ "Election Result for Bidston and St. James ward on 6 May 2010". Wirral Metropolitan Borough Council.
- ↑ "Councillor Ann McLachlan". Wirral Metropolitan Borough Council.
- ↑ "Election Result for Birkenhead and Tranmere ward on 6 May 2010". Wirral Metropolitan Borough Council.
- ↑ "Councillor Brian Kenny". Wirral Metropolitan Borough Council.
- ↑ "Councillor Pat Cleary". Wirral Metropolitan Borough Council.
- ↑ "Election Result for Bromborough ward on 6 May 2010". Wirral Metropolitan Borough Council.
- ↑ "Councillor Irene Williams". Wirral Metropolitan Borough Council.
- ↑ "Election Result for Clatterbridge ward on 6 May 2010". Wirral Metropolitan Borough Council.
- ↑ "Councillor Peter Kearney". Wirral Metropolitan Borough Council.
- ↑ "Election Result for Claughton ward on 6 May 2010". Wirral Metropolitan Borough Council.
- ↑ "Councillor Denise Roberts". Wirral Metropolitan Borough Council.
- ↑ "Election Result for Eastham ward on 6 May 2010". Wirral Metropolitan Borough Council.
- ↑ "Councillor Tom Harney". Wirral Metropolitan Borough Council.
- ↑ "Election Result for Greasby, Frankby and Irby ward on 6 May 2010". Wirral Metropolitan Borough Council.
- ↑ "Councillor Wendy Clements". Wirral Metropolitan Borough Council.
- ↑ "Election Result for Heswall ward on 6 May 2010". Wirral Metropolitan Borough Council.
- ↑ "Councillor Les Rowlands". Wirral Metropolitan Borough Council.
- ↑ "Election Result for Hoylake and Meols ward on 6 May 2010". Wirral Metropolitan Borough Council.
- ↑ "Councillor Eddie Boult". Wirral Metropolitan Borough Council.
- ↑ "Councillor Paul Doughty". Wirral Metropolitan Borough Council.
- ↑ "Election Result for Leasowe and Moreton East ward on 6 May 2010". Wirral Metropolitan Borough Council.
- ↑ "Councillor Anne McArdle". Wirral Metropolitan Borough Council.
- ↑ "Election Result for Liscard ward on 6 May 2010". Wirral Metropolitan Borough Council.
- ↑ "Councillor Darren Dodd". Wirral Metropolitan Borough Council.
- ↑ "Councillor Leah Fraser". Wirral Metropolitan Borough Council.
- ↑ "Election Result for Moreton West and Saughall Massie ward on 6 May 2010". Wirral Metropolitan Borough Council.
- ↑ "Councillor Simon R Mountney". Wirral Metropolitan Borough Council.
- ↑ "Election Result for New Brighton ward on 6 May 2010". Wirral Metropolitan Borough Council.
- ↑ "Councillor Patricia Glasman". Wirral Metropolitan Borough Council.
- ↑ "Election Result for Oxton ward on 6 May 2010". Wirral Metropolitan Borough Council.
- ↑ "Councillor Alan Brighthouse". Wirral Metropolitan Borough Council.
- ↑ "Election Result for Pensby and Thingwall ward on 6 May 2010". Wirral Metropolitan Borough Council.
- ↑ "Councillor Mark Johnston". Wirral Metropolitan Borough Council.
- ↑ "Councillor Don McCubbin". Wirral Metropolitan Borough Council.
- ↑ "Councillor Adam Sykes". Wirral Metropolitan Borough Council.
- ↑ "Councillor Michael Sullivan". Wirral Metropolitan Borough Council.
- ↑ "Councillor Sylvia Hodrien". Wirral Metropolitan Borough Council.
- ↑ "Election Result for Prenton ward on 6 May 2010". Wirral Metropolitan Borough Council.
- ↑ "Councillor Denise Realey". Wirral Metropolitan Borough Council.
- ↑ "Election Result for Rock Ferry ward on 6 May 2010". Wirral Metropolitan Borough Council.
- ↑ "Councillor Moira McLaughlin". Wirral Metropolitan Borough Council.
- ↑ "Election Result for Seacombe ward on 6 May 2010". Wirral Metropolitan Borough Council.
- ↑ "Councillor Adrian Jones". Wirral Metropolitan Borough Council.
- ↑ "Councillor Tony Cox". Wirral Metropolitan Borough Council.
- ↑ "Election Result for Upton ward on 6 May 2010". Wirral Metropolitan Borough Council.
- ↑ "Councillor Stuart Whittingham". Wirral Metropolitan Borough Council.
- ↑ "Election Result for Wallasey ward on 6 May 2010". Wirral Metropolitan Borough Council.
- ↑ "Councillor Lesley Rennie". Wirral Metropolitan Borough Council.
- ↑ "Councillor Chris Jones". Wirral Metropolitan Borough Council.
- ↑ "Election Result for West Kirby and Thurstaston ward on 6 May 2010". Wirral Metropolitan Borough Council.
- ↑ "Councillor Jeff Green". Wirral Metropolitan Borough Council.