Bromley London Borough Council election, 2018
| |||||||||||||||||||||||||
All 60 seats to Bromley London Borough Council 31 seats needed for a majority | |||||||||||||||||||||||||
|---|---|---|---|---|---|---|---|---|---|---|---|---|---|---|---|---|---|---|---|---|---|---|---|---|---|
| |||||||||||||||||||||||||
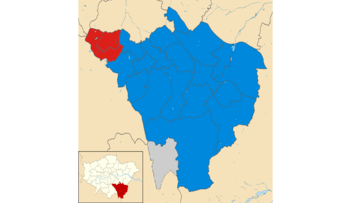 Map of the results. Conservative Party in blue, Labour Party in red and independents in grey. | |||||||||||||||||||||||||
| |||||||||||||||||||||||||
The 2018 Bromley London Borough Council election took place on 3 May 2018 to elect members of Bromley London Borough Council in England.[1] This was the same day as other local elections.
Bromley was one of the boroughs subject to a trial of voter ID restrictions[2] requiring the production of photographic ID or 2 other forms of ID.[3]
Council results
| Bromley[4] | |||||||||||||||
|---|---|---|---|---|---|---|---|---|---|---|---|---|---|---|---|
| Party | Candidates | Votes | |||||||||||||
| Stood | Elected | Gained | Unseated | Net | % of total | % | № | Net % | |||||||
| Conservative | 60 | 50 | 2 | 3 | -1 | 83.3 | 44.1 | 47,777 | +4.5 | ||||||
| Labour | 60 | 8 | 1 | 0 | +1 | 13.3 | 24.3 | 26,295 | +5.9 | ||||||
| Liberal Democrat | 60 | 0 | 0 | 0 | 0 | 0.0 | 14.7 | 15,896 | +5.6 | ||||||
| Green | 23 | 0 | 0 | 0 | 0 | 0.0 | 10.6 | 11,460 | -1.0 | ||||||
| UKIP | 19 | 0 | 0 | 2 | -2 | 0.0 | 2.8 | 3,065 | -17.0 | ||||||
| Independent | 3 | 2 | 2 | 0 | +2 | 3.3 | 3.0 | 3,162 | +2.0 | ||||||
| Women's Equality | 1 | 0 | 0 | 0 | 0 | 0.0 | 0.4 | 440 | n/a | ||||||
| For Britain | 1 | 0 | 0 | 0 | 0 | 0.0 | 0.1 | 142 | n/a | ||||||
| Libertarian | 1 | 0 | 0 | 0 | 0 | 0.0 | 0.1 | 60 | n/a | ||||||
Ward results
Bickley
| Party | Candidate | Votes | % | ± | |
|---|---|---|---|---|---|
| Conservative | Kira Gabbert | 2,935 | 20.3 | ||
| Conservative | Kate Lymer | 2,919 | 20.2 | ||
| Conservative | Colin Smith | 2,827 | 19.6 | ||
| Labour | Jann Oliver | 1,022 | 7.1 | ||
| Liberal Democrat | Helen Corbett | 897 | 6.2 | ||
| Labour | Mike Roberts | 805 | 5.6 | ||
| Liberal Democrat | David Martin | 753 | 5.2 | ||
| Labour | Martin Spence | 744 | 5.1 | ||
| Liberal Democrat | David Wilkinson | 697 | 4.8 | ||
| Green | Roger Austin | 630 | 4.4 | ||
| UKIP | David Quarterman | 225 | 1.6 | ||
| Turnout | 14,454 | 43.1 | |||
| Conservative hold | Swing | ||||
| Conservative hold | Swing | ||||
| Conservative hold | Swing | ||||
Biggin Hill
| Party | Candidate | Votes | % | ± | |
|---|---|---|---|---|---|
| Independent | Julian Wybergh | 1,175 | 19.2 | ||
| Independent | Melanie Stevens | 1,149 | 18.8 | ||
| Conservative | Linda Hewitt | 929 | 15.2 | ||
| Conservative | Toby Sims | 848 | 13.9 | ||
| UKIP | Julian Grainger | 360 | 5.8 | ||
| Liberal Democrat | Geoff Gostt | 336 | 5.5 | ||
| UKIP | Emmett Jenner | 301 | 4.9 | ||
| Labour | Timothy Fisher | 242 | 4.0 | ||
| Labour | Clive Gunby | 224 | 3.7 | ||
| Green | Karen Wheller | 205 | 3.0 | ||
| Green | Paul Enock | 182 | 3.0 | ||
| Liberal Democrat | Graeme Casey | 171 | 2.8 | ||
| Turnout | 6,122 | 39.9 | |||
| Independent gain from Conservative | Swing | ||||
| Independent gain from Conservative | Swing | ||||
Bromley Common and Keston
| Party | Candidate | Votes | % | ± | |
|---|---|---|---|---|---|
| Conservative | Alexa Michael | 2,718 | 20.6 | ||
| Conservative | David Jefferys | 2,714 | 20.6 | ||
| Conservative | Robert McIlveen | 2,638 | 20.0 | ||
| Labour | Robert Evans | 1,048 | 8.0 | ||
| Labour | Eileen Welsh | 996 | 7.6 | ||
| Labour | Brian Ingham | 957 | 7.3 | ||
| Green | Hannah Whitman | 568 | 4.3 | ||
| Liberal Democrat | Alan Carter | 537 | 4.1 | ||
| Liberal Democrat | Clive Broadhurst | 514 | 3.9 | ||
| Liberal Democrat | Christopher Bentley | 421 | 3.2 | ||
| Turnout | 13,174 | 36.2 | |||
| Conservative hold | Swing | ||||
| Conservative hold | Swing | ||||
| Conservative hold | Swing | ||||
Bromley Town
| Party | Candidate | Votes | % | ± | |
|---|---|---|---|---|---|
| Conservative | Nicky Dykes | 2,129 | 13.7 | ||
| Conservative | Will Harmer | 2,008 | 12.9 | ||
| Conservative | Michael Rutherford | 1,878 | 12.1 | ||
| Liberal Democrat | Rhian Kanat | 1,835 | 11.8 | ||
| Liberal Democrat | Julie Ireland | 1,772 | 11.4 | ||
| Liberal Democrat | Sam Webber | 1,653 | 10.6 | ||
| Labour | Juliet Kay | 1,285 | 8.3 | ||
| Labour | Glyn Alsworth | 1,254 | 8.1 | ||
| Labour | Josie Parkhouse | 1,094 | 7.0 | ||
| Green | Roisin Robertson | 639 | 4.1 | ||
| Turnout | 15,547 | 40.5 | |||
| Conservative hold | Swing | ||||
| Conservative hold | Swing | ||||
| Conservative hold | Swing | ||||
Chelsfield and Pratts Bottom
| Party | Candidate | Votes | % | ± | |
|---|---|---|---|---|---|
| Conservative | Mike Botting | 2,928 | 21.6 | ||
| Conservative | Angela Page | 2,770 | 20.5 | ||
| Conservative | Samaris Huntington-Thresher | 2,715 | 20.1 | ||
| Labour | Margaret Mills | 809 | 6.0 | ||
| Labour | Stephen Richardson | 748 | 5.5 | ||
| Labour | Peter Moore | 726 | 5.4 | ||
| Liberal Democrat | Gerda Loosemore-Reppen | 674 | 5.0 | ||
| Liberal Democrat | John Bray | 620 | 4.6 | ||
| Green | Daniel Sloan | 616 | 4.6 | ||
| Liberal Democrat | Jonathan Webber | 434 | 3.2 | ||
| UKIP | Michael Porter | 246 | 1.8 | ||
| UKIP | Brian Philp | 244 | 1.8 | ||
| Turnout | 13,530 | 42.1 | |||
| Conservative hold | Swing | ||||
| Conservative hold | Swing | ||||
| Conservative hold | Swing | ||||
Chislehurst
| Party | Candidate | Votes | % | ± | |
|---|---|---|---|---|---|
| Conservative | Katy Boughey | 3,094 | 23.3 | ||
| Conservative | Kieran Terry | 2,900 | 21.8 | ||
| Conservative | Suraj Sharma | 2,784 | 21.0 | ||
| Labour | Christian Mole | 901 | 6.8 | ||
| Labour | Mick Maroney | 748 | 5.6 | ||
| Labour | Eugene Nixon | 660 | 5.0 | ||
| Green | Stella Gardiner | 642 | 4.8 | ||
| Liberal Democrat | Ian Magrath | 607 | 4.6 | ||
| Liberal Democrat | Robert Cliff | 507 | 3.8 | ||
| Liberal Democrat | Simon Lewis | 436 | 3.3 | ||
| Turnout | 13,279 | 38.7 | |||
| Conservative hold | Swing | ||||
| Conservative hold | Swing | ||||
| Conservative hold | Swing | ||||
Clock House
| Party | Candidate | Votes | % | ± | |
|---|---|---|---|---|---|
| Labour | Vanessa Allen | 2,638 | 16.7 | ||
| Labour | Ian Dunn | 2,386 | 15.1 | ||
| Labour | Josh King | 2,254 | 14.3 | ||
| Conservative | Christopher Phillips | 1,470 | 9.3 | ||
| Conservative | Christine Harris | 1,407 | 8.9 | ||
| Conservative | Scott Pattenden | 1,328 | 8.4 | ||
| Liberal Democrat | Juliet Corbett | 1,218 | 7.7 | ||
| Liberal Democrat | Michael Jones | 1,197 | 7.6 | ||
| Liberal Democrat | Adam Bambrough | 1,151 | 7.3 | ||
| Green | Nicola Nugent | 704 | 4.5 | ||
| Turnout | 15,753 | 46.0 | |||
| Labour hold | Swing | ||||
| Labour hold | Swing | ||||
| Labour gain from Conservative | Swing | ||||
Copers Cope
| Party | Candidate | Votes | % | ± | |
|---|---|---|---|---|---|
| Conservative | Michael Tickner | 2,291 | 14.1 | ||
| Conservative | Stephen Wells | 2,245 | 13.8 | ||
| Conservative | Russell Mellor | 2,125 | 13.1 | ||
| Liberal Democrat | Alison Davis | 1,785 | 11.0 | ||
| Liberal Democrat | Chloe-Jane Ross | 1,680 | 10.3 | ||
| Liberal Democrat | Rich Wilsher | 1,516 | 9.3 | ||
| Labour | Charlotte Gerada | 1,333 | 8.2 | ||
| Labour | Tony McPartlan | 1,238 | 7.6 | ||
| Labour | Olasupo Obikoya | 1,178 | 7.2 | ||
| Green | Ruth Fabricant | 642 | 3.9 | ||
| UKIP | Andrew Hayman | 133 | 0.8 | ||
| UKIP | Graham Reakes | 115 | 0.7 | ||
| Turnout | 16,281 | 44.9 | |||
| Conservative hold | Swing | ||||
| Conservative hold | Swing | ||||
| Conservative hold | Swing | ||||
Cray Valley East
| Party | Candidate | Votes | % | ± | |
|---|---|---|---|---|---|
| Conservative | Chris Pierce | 1,619 | 15.8 | ||
| Conservative | Yvonne Bear | 1,601 | 15.6 | ||
| Conservative | Harry Stranger | 1,446 | 14.1 | ||
| Labour | Nathaniel Arthur | 1,363 | 13.3 | ||
| Labour | Christopher Taylor | 1,224 | 11.9 | ||
| Labour | Gillian Davis | 1,178 | 11.5 | ||
| Green | Paul Hemingway | 365 | 3.6 | ||
| UKIP | Mick Greenhough | 363 | 3.5 | ||
| UKIP | Ayse Smith | 337 | 3.3 | ||
| Liberal Democrat | Caitlin Bishop | 308 | 3.0 | ||
| Liberal Democrat | Martin Cooper | 238 | 2.3 | ||
| Liberal Democrat | Rhianna Wilsher | 221 | 2.2 | ||
| Turnout | 10,263 | 31.7 | |||
| Conservative hold | Swing | ||||
| Conservative hold | Swing | ||||
| Conservative hold | Swing | ||||
Cray Valley West
| Party | Candidate | Votes | % | ± | |
|---|---|---|---|---|---|
| Conservative | Judi Ellis | 1,465 | 15.1 | ||
| Conservative | Colin Hitchins | 1,365 | 14.1 | ||
| Conservative | Gary Ernest Stevens | 1,228 | 12.7 | ||
| Labour | Kelly Galvin | 973 | 10.0 | ||
| Labour | Gary John Stevens | 838 | 8.6 | ||
| Independent | Colin Willetts | 838 | 8.6 | ||
| Labour | Richard Lovell | 809 | 8.3 | ||
| UKIP | David Livett | 480 | 5.0 | ||
| UKIP | Garry Ramus | 394 | 4.1 | ||
| Green | Steven Cope | 387 | 4.0 | ||
| Liberal Democrat | Katharine Barker | 366 | 3.8 | ||
| Liberal Democrat | Magdalena Williams | 298 | 3.1 | ||
| Liberal Democrat | Peter Scott Brooks | 190 | 2.0 | ||
| Libertarian | Sean Finch | 60 | 0.6 | ||
| Turnout | 9,691 | 29.0 | |||
| Conservative hold | Swing | ||||
| Conservative gain from UKIP | Swing | ||||
| Conservative gain from UKIP | Swing | ||||
Crystal Palace
| Party | Candidate | Votes | % | ± | |
|---|---|---|---|---|---|
| Labour | Angela Wilkins | 1,985 | 33.2 | ||
| Labour | Marina Ahmad | 1,755 | 29.4 | ||
| Green | Mark Phillippo | 536 | 9.0 | ||
| Liberal Democrat | Philippa Bridge | 527 | 8.8 | ||
| Conservative | Craig Wilson | 442 | 7.4 | ||
| Conservative | Sunil Gupta | 421 | 7.0 | ||
| Liberal Democrat | David Marshall | 309 | 5.2 | ||
| Turnout | 5,975 | 34.8 | |||
| Labour hold | Swing | ||||
| Labour hold | Swing | ||||
Darwin
| Party | Candidate | Votes | % | ± | |
|---|---|---|---|---|---|
| Conservative | Richard Scoates | 1,201 | 72.8 | ||
| Labour | Frank Evans | 185 | 11.2 | ||
| Liberal Democrat | Millicent Scott Brooks | 133 | 8.1 | ||
| Green | Jan Wilson | 130 | 7.9 | ||
| Turnout | 1,649 | 40.0 | |||
| Conservative hold | Swing | ||||
Farnborough and Crofton
| Party | Candidate | Votes | % | ± | |
|---|---|---|---|---|---|
| Conservative | Robert Evans | 3,276 | 22.2 | ||
| Conservative | Charles Joel | 3,208 | 21.7 | ||
| Conservative | Christopher Marlow | 2,987 | 20.2 | ||
| Liberal Democrat | Ian Catchpole | 810 | 5.5 | ||
| Labour | Malcolm Clark | 789 | 5.3 | ||
| Liberal Democrat | Allan Tweddle | 776 | 5.3 | ||
| Labour | Christine McNamara | 744 | 5.0 | ||
| Liberal Democrat | Oliver Loosemore | 683 | 4.6 | ||
| Labour | John Pead | 619 | 4.2 | ||
| Green | Tamara Galloway | 449 | 3.0 | ||
| UKIP | Kenneth Tracey | 295 | 2.0 | ||
| For Britain | Mandy Baldwin | 142 | 1.0 | ||
| Turnout | 14,778 | 43.8 | |||
| Conservative hold | Swing | ||||
| Conservative hold | Swing | ||||
| Conservative hold | Swing | ||||
Hayes and Coney Hall
| Party | Candidate | Votes | % | ± | |
|---|---|---|---|---|---|
| Conservative | Graham Arthur | 3,096 | 20.9 | ||
| Conservative | Peter Fortune | 3,087 | 20.9 | ||
| Conservative | Neil Reddin | 2,830 | 19.1 | ||
| Labour | Peter Ayres | 950 | 6.4 | ||
| Labour | Gail Emerson | 950 | 6.4 | ||
| Labour | Glenys Ingham | 918 | 6.2 | ||
| Liberal Democrat | Ellen Griffiths | 733 | 5.0 | ||
| Green | Mary Ion | 621 | 4.2 | ||
| Liberal Democrat | Tudor Griffiths | 559 | 3.8 | ||
| Liberal Democrat | Michael Fox | 535 | 3.6 | ||
| UKIP | Michael Rudd | 261 | 1.8 | ||
| UKIP | Sandra Pearson | 243 | 1.6 | ||
| Turnout | 14,783 | 40.8 | |||
| Conservative hold | Swing | ||||
| Conservative hold | Swing | ||||
| Conservative hold | Swing | ||||
Kelsey and Eden Park
| Party | Candidate | Votes | % | ± | |
|---|---|---|---|---|---|
| Conservative | Peter Dean | 2,563 | 17.2 | ||
| Conservative | Diane Smith | 2,532 | 17.0 | ||
| Conservative | Dave Wibberley | 2,412 | 16.2 | ||
| Labour | Marie Bardsley | 1,579 | 10.6 | ||
| Labour | Naresh Chauhan | 1,462 | 9.8 | ||
| Labour | John Dempster | 1,358 | 9.1 | ||
| Liberal Democrat | Hayley Anderson | 859 | 5.8 | ||
| Liberal Democrat | Taylor Matthews | 675 | 4.5 | ||
| Liberal Democrat | Robert Jackson | 670 | 4.5 | ||
| Green | Gareth Thomas | 553 | 3.7 | ||
| UKIP | Valerie Butcher | 214 | 1.4 | ||
| Turnout | 14,877 | 42.1 | |||
| Conservative hold | Swing | ||||
| Conservative hold | Swing | ||||
| Conservative hold | Swing | ||||
Mottingham and Chislehurst North
| Party | Candidate | Votes | % | ± | |
|---|---|---|---|---|---|
| Conservative | David Cartwright | 1,111 | 24.0 | ||
| Conservative | Will Rowlands | 992 | 21.5 | ||
| Labour | Nick Harrison | 972 | 21.0 | ||
| Labour | Kathy Smith | 969 | 21.0 | ||
| Green | Kate Matos | 223 | 4.8 | ||
| Liberal Democrat | Victoria Webber | 185 | 4.0 | ||
| Liberal Democrat | John Houghton | 171 | 3.7 | ||
| Turnout | 4,623 | 33.4 | |||
| Conservative hold | Swing | ||||
| Conservative hold | Swing | ||||
Orpington
| Party | Candidate | Votes | % | ± | |
|---|---|---|---|---|---|
| Conservative | Kim Botting | 2,857 | 21.6 | ||
| Conservative | Pauline Tunnicliffe | 2,729 | 20.7 | ||
| Conservative | William Huntington-Thresher | 2,694 | 20.4 | ||
| Labour | Christopher Price | 949 | 7.2 | ||
| Labour | Vibeke Fussing | 947 | 7.2 | ||
| Labour | Gareth Wretham | 805 | 6.1 | ||
| Liberal Democrat | Michael Hall | 674 | 5.1 | ||
| Liberal Democrat | Elaine Mackay | 598 | 4.5 | ||
| Green | Michael Marriott | 507 | 3.8 | ||
| Liberal Democrat | Reinhard Rometsch | 430 | 3.3 | ||
| Turnout | 13,190 | 38.1 | |||
| Conservative hold | Swing | ||||
| Conservative hold | Swing | ||||
| Conservative hold | Swing | ||||
Penge and Cator
| Party | Candidate | Votes | % | ± | |
|---|---|---|---|---|---|
| Labour | Kathy Bance | 3,259 | 23.0 | ||
| Labour | Kevin Brooks | 2,828 | 19.9 | ||
| Labour | Simon Jeal | 2,692 | 19.0 | ||
| Conservative | Sarah Dalton | 1,021 | 7.2 | ||
| Green | Geoffrey Allen | 1,009 | 7.1 | ||
| Conservative | Neil Jopson | 952 | 6.7 | ||
| Conservative | David Kenyon | 897 | 6.3 | ||
| Liberal Democrat | Marguerite Pierre | 576 | 4.1 | ||
| Liberal Democrat | Jonathan Douglas-Green | 507 | 3.6 | ||
| Liberal Democrat | Philip Storry | 447 | 3.2 | ||
| Turnout | 14,188 | 39.8 | |||
| Labour hold | Swing | ||||
| Labour hold | Swing | ||||
| Labour hold | Swing | ||||
Petts Wood and Knoll
| Party | Candidate | Votes | % | ± | |
|---|---|---|---|---|---|
| Conservative | Keith Onslow | 3,426 | 23.9 | ||
| Conservative | Tony Owen | 3,299 | 23.0 | ||
| Conservative | Simon Fawthrop | 3,104 | 21.7 | ||
| Liberal Democrat | Lesley Astier | 863 | 6.0 | ||
| Labour | Benjamin Devlin | 744 | 5.2 | ||
| Labour | Jemma Gallagher | 694 | 4.8 | ||
| Green | Martin Childs | 626 | 4.4 | ||
| Labour | Stephen Cranenburgh | 565 | 3.9 | ||
| Liberal Democrat | John Loosemore | 544 | 3.8 | ||
| Liberal Democrat | Michael Berridge | 471 | 3.3 | ||
| Turnout | 14,336 | 46.5 | |||
| Conservative hold | Swing | ||||
| Conservative hold | Swing | ||||
| Conservative hold | Swing | ||||
Plaistow and Sundridge
| Party | Candidate | Votes | % | ± | |
|---|---|---|---|---|---|
| Conservative | Gareth Allatt | 1,991 | 14.9 | ||
| Conservative | Peter Morgan | 1,957 | 14.6 | ||
| Conservative | Michael Turner | 1,935 | 14.5 | ||
| Labour | Angie Stack | 1,696 | 12.7 | ||
| Labour | Pam Remon | 1,578 | 11.8 | ||
| Labour | Simon Thomson | 1,392 | 10.4 | ||
| Liberal Democrat | Lesley Furniss | 616 | 4.6 | ||
| Liberal Democrat | Dominic Alessio | 558 | 4.2 | ||
| Green | John Street | 504 | 3.8 | ||
| Liberal Democrat | Peter Furniss | 452 | 3.4 | ||
| Women's Equality | Caroline MacVay | 440 | 3.3 | ||
| UKIP | Patricia Gulliver | 265 | 2.0 | ||
| Turnout | 13,384 | 40.0 | |||
| Conservative hold | Swing | ||||
| Conservative hold | Swing | ||||
| Conservative hold | Swing | ||||
Shortlands
| Party | Candidate | Votes | % | ± | |
|---|---|---|---|---|---|
| Conservative | Mary Cooke | 2,080 | 32.7 | ||
| Conservative | Aisha Cuthbert | 1,935 | 30.4 | ||
| Labour | Richard Hart | 570 | 9.0 | ||
| Liberal Democrat | Richard Corbett | 511 | 8.0 | ||
| Labour | Dermot McKibbin | 500 | 7.9 | ||
| Liberal Democrat | Ilona Navarro-Weitzel | 417 | 6.6 | ||
| Green | Ann Garrett | 342 | 5.4 | ||
| Turnout | 6,355 | 42.7 | |||
| Conservative hold | Swing | ||||
| Conservative hold | Swing | ||||
West Wickham
| Party | Candidate | Votes | % | ± | |
|---|---|---|---|---|---|
| Conservative | Mark Brock | 3,072 | 21.0 | ||
| Conservative | Nicholas Bennett | 2,834 | 19.4 | ||
| Conservative | Hannah Gray | 2,804 | 19.2 | ||
| Labour | Eli David | 1,003 | 6.9 | ||
| Labour | Jeremy Adams | 971 | 6.6 | ||
| Labour | Joanna Crispin | 969 | 6.6 | ||
| Liberal Democrat | James Spencer-Boyce | 846 | 5.8 | ||
| Green | Jenny Cambell B. Rust | 562 | 3.8 | ||
| Liberal Democrat | Nigel Peaple | 532 | 3.6 | ||
| Liberal Democrat | Stephen Wells | 489 | 3.3 | ||
| UKIP | Victor Jackson | 223 | 1.5 | ||
| UKIP | Colin Chuck | 183 | 1.3 | ||
| UKIP | Brian Danes | 148 | 1.0 | ||
| Turnout | 14,636 | 42.5 | |||
| Conservative hold | Swing | ||||
| Conservative hold | Swing | ||||
| Conservative hold | Swing | ||||
References
- ↑ "Local Elections 2018 Statement of Persons nominated". bromley.gov.uk. Bromley London Borough Council. Retrieved 13 April 2018.
- ↑ Press Association (2018-04-28). "Polling station voter ID plans are deeply flawed, say critics". The Guardian. Retrieved 2018-04-29.
- ↑ Walker, Peter; Weaver, Matthew (2018-05-03). "Anger and confusion as voters turned away during ID trial". the Guardian. Retrieved 2018-05-09.
- ↑ Elects, Britain (May 2018). "LE2018 ward-by-ward results: London only [Britain Elects]". Britain Elects. Retrieved 21 June 2018.
This article is issued from
Wikipedia.
The text is licensed under Creative Commons - Attribution - Sharealike.
Additional terms may apply for the media files.