Wirral Metropolitan Borough Council election, 2014
|
| |||||||||||||||||||||||||||||||||||||||||||||||||||||||||||||||||||||||||||||
| |||||||||||||||||||||||||||||||||||||||||||||||||||||||||||||||||||||||||||||
23 of 66 seats (One Third and one by-election) to Wirral Metropolitan Borough Council 34 seats needed for a majority | |||||||||||||||||||||||||||||||||||||||||||||||||||||||||||||||||||||||||||||
|---|---|---|---|---|---|---|---|---|---|---|---|---|---|---|---|---|---|---|---|---|---|---|---|---|---|---|---|---|---|---|---|---|---|---|---|---|---|---|---|---|---|---|---|---|---|---|---|---|---|---|---|---|---|---|---|---|---|---|---|---|---|---|---|---|---|---|---|---|---|---|---|---|---|---|---|---|---|
| Turnout |
35.6% ( | ||||||||||||||||||||||||||||||||||||||||||||||||||||||||||||||||||||||||||||
| |||||||||||||||||||||||||||||||||||||||||||||||||||||||||||||||||||||||||||||
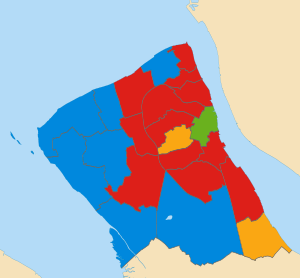 Map of results of 2014 election | |||||||||||||||||||||||||||||||||||||||||||||||||||||||||||||||||||||||||||||
| |||||||||||||||||||||||||||||||||||||||||||||||||||||||||||||||||||||||||||||
The 2014 Wirral Metropolitan Borough Council election took place on 22 May 2014 to elect members of Wirral Metropolitan Borough Council in England.[1] This election was held on the same day as other local elections.
After the election, the composition of the council was:
| Party | Seats | ± | |
|---|---|---|---|
| Labour | 38 | ||
| Conservative | 21 | ||
| Liberal Democrat | 6 | ||
| Green | 1 | ||
| Independent | 0 | ||
Election results
Overall election result
Overall result compared with 2012.
| Wirral Metropolitan Borough Council election result, 2014 | |||||||||||||||
|---|---|---|---|---|---|---|---|---|---|---|---|---|---|---|---|
| Party | Candidates | Votes | |||||||||||||
| Stood | Elected | Gained | Unseated | Net | % of total | % | № | Net % | |||||||
| Labour | 23 | 12 | 2 | 1 | 54.5 | 38.6 | 33,145 | ||||||||
| Conservative | 23 | 8 | 0 | 1 | 31.8 | 28.0 | 24,105 | ||||||||
| UKIP | 22 | 0 | 0 | 0 | 0.0 | 17.2 | 14,793 | ||||||||
| Green | 22 | 1 | 1 | 0 | 4.5 | 8.0 | 6,835 | ||||||||
| Liberal Democrat | 18 | 2 | 0 | 0 | 9.1 | 7.8 | 6,728 | ||||||||
| Independent | 3 | 0 | 0 | 1 | 0.0 | 0.3 | 239 | ||||||||
| TUSC | 2 | 0 | 0 | 0 | 0.0 | 0.1 | 91 | ||||||||
Changes in council composition
Prior to the election the composition of the council was:
| 37 | 22 | 6 | 1 |
| Lab | Con | LD | I |
After the election the composition of the council was:
| 38 | 21 | 6 | 1 |
| Lab | Con | LD | G |
Ward results
Results compared directly with the last local election in 2012 except for Leasowe and Moreton East, Heswall, Pensby and Thingwall and Upton which are compared directly with their respective 2013 by-elections.
Bebington
| Party | Candidate | Votes | % | ± | |
|---|---|---|---|---|---|
| Labour | Walter Smith | 2,165 | 48.7 | ||
| Conservative | Des Drury | 1,013 | 22.8 | ||
| UKIP | Hilary Jones | 873 | 19.6 | ||
| Green | Anthony Smith | 289 | 6.5 | ||
| Liberal Democrat | Peter Faulkner | 110 | 2.5 | ||
| Majority | 1,152 | 25.9 | |||
| Registered electors | 11,956 | ||||
| Turnout | 37.3 | ||||
| Labour hold | Swing | ||||
Bidston and St James
| Party | Candidate | Votes | % | ± | |
|---|---|---|---|---|---|
| Labour | Ann McLachlan | 1,701 | 64.6 | ||
| UKIP | Cathy Williams | 540 | 20.5 | ||
| Conservative | Geoffrey Dormant | 190 | 7.2 | ||
| Green | Colin Dignam-Gill | 106 | 4.0 | ||
| Liberal Democrat | Roy Wood | 53 | 2.0 | ||
| TUSC | Greg North | 43 | 1.6 | New | |
| Majority | 1,161 | 44.1 | |||
| Registered electors | 9,932 | ||||
| Turnout | 26.6 | ||||
| Labour hold | Swing | ||||
Birkenhead and Tranmere
| Party | Candidate | Votes | % | ± | |
|---|---|---|---|---|---|
| Green | Pat Cleary | 1,658 | 47.6 | ||
| Labour | Brian Kenny | 1,421 | 40.8 | ||
| UKIP | Laurence Sharpe-Stevens | 334 | 9.6 | ||
| Conservative | June Cowin | 69 | 2.0 | ||
| Majority | 237 | 6.8 | N/A | ||
| Registered electors | 9,882 | ||||
| Turnout | 35.4 | ||||
| Green gain from Labour | Swing | ||||
Bromborough
| Party | Candidate | Votes | % | ± | |
|---|---|---|---|---|---|
| Labour | Irene Williams | 1,709 | 49.9 | ||
| UKIP | Sue Colquhoun | 772 | 22.6 | ||
| Conservative | Peter Taylor | 469 | 13.7 | ||
| Liberal Democrat | Penelope Golby | 247 | 7.2 | ||
| Green | Percy Hogg | 225 | 6.6 | ||
| Majority | 937 | 27.3 | |||
| Majority | 1,152 | 25.9 | |||
| Registered electors | 11,312 | ||||
| Turnout | 30.4 | ||||
| Labour hold | Swing | ||||
Clatterbridge
| Party | Candidate | Votes | % | ± | |
|---|---|---|---|---|---|
| Conservative | Tracey Smith | 1,911 | 40.6 | ||
| Labour | Jenny Holliday | 1,491 | 31.6 | ||
| UKIP | Roger Jones | 802 | 17.0 | ||
| Liberal Democrat | Matthew Donnelly | 266 | 5.6 | ||
| Green | Colin Thompson | 241 | 5.1 | ||
| Majority | 420 | 9.0 | |||
| Registered electors | 11,684 | ||||
| Turnout | 40.5 | ||||
| Conservative hold | Swing | ||||
Claughton
| Party | Candidate | Votes | % | ± | |
|---|---|---|---|---|---|
| Labour | Denise Roberts | 1,912 | 53.3 | ||
| UKIP | Philip Griffiths | 760 | 21.2 | ||
| Conservative | Barbara Sinclair | 522 | 14.5 | ||
| Green | Paul Cartlidge | 222 | 6.2 | ||
| Liberal Democrat | Chris Teggin | 172 | 4.8 | ||
| Majority | 1,152 | 32.1 | |||
| Registered electors | 11,184 | ||||
| Turnout | 32.2 | ||||
| Labour hold | Swing | ||||
Eastham
| Party | Candidate | Votes | % | ± | |
|---|---|---|---|---|---|
| Liberal Democrat | Chris Carubia | 1,558 | 39.5 | ||
| Labour | Mike Thompson | 1,180 | 29.9 | ||
| UKIP | Ryan Bingham | 592 | 15.0 | ||
| Conservative | Keith Jack | 469 | 11.9 | ||
| Green | Oliver Downing | 147 | 3.7 | ||
| Majority | 378 | 9.6 | |||
| Registered electors | 10,889 | ||||
| Turnout | 36.4 | ||||
| Liberal Democrat hold | Swing | ||||
Greasby, Frankby and Irby
| Party | Candidate | Votes | % | ± | |
|---|---|---|---|---|---|
| Conservative | Wendy Clements [n 2] | 2,193 | 38.6 | ||
| Conservative | Tom Anderson [n 3] | 1,687 | – | – | |
| Labour | Julie McManus | 1,186 | 20.9 | ||
| Liberal Democrat | Peter Reisdorf | 1,076 | 19.0 | ||
| Labour | Lee Rushworth | 838 | – | – | |
| Liberal Democrat | John Creswell | 749 | – | – | |
| UKIP | Derek Snowden | 809 | 14.3 | ||
| Green | Rachel Markey | 208 | 7.3 | ||
| Majority | 1,007 | 17.7 | |||
| Registered electors | 11,501 | ||||
| Turnout | 43.0 | ||||
| Conservative hold | Swing | ||||
| Conservative hold | Swing | – | |||
Heswall
Compared with 2013 by-election.
| Party | Candidate | Votes | % | ± | |
|---|---|---|---|---|---|
| Conservative | Les Rowlands | 2,398 | 55.7 | ||
| UKIP | David Scott | 773 | 17.9 | ||
| Labour | Mike Holliday | 668 | 15.5 | ||
| Green | Barbara Burton | 277 | 6.4 | ||
| Liberal Democrat | David Tyrrell | 191 | 4.4 | New | |
| Majority | 1,625 | 37.8 | |||
| Registered electors | 10,894 | ||||
| Turnout | 39.7 | ||||
| Conservative hold | Swing | ||||
Hoylake and Meols
| Party | Candidate | Votes | % | ± | |
|---|---|---|---|---|---|
| Conservative | Eddie Boult | 1,912 | 46.7 | ||
| Labour | Pat Glasman [n 4] | 1,075 | 26.2 | ||
| UKIP | George Robinson | 531 | 13.0 | ||
| Green | Yvonne McGinley | 423 | 10.3 | ||
| Liberal Democrat | Joseph McDowell | 155 | 3.8 | ||
| Majority | 837 | 20.5 | |||
| Registered electors | 10,403 | ||||
| Turnout | 39.5 | ||||
| Conservative hold | Swing | ||||
Leasowe and Moreton East
Compared with 2013 by-election.
| Party | Candidate | Votes | % | ± | |
|---|---|---|---|---|---|
| Labour | Treena Johnson | 1,819 | 45.5 | ||
| Conservative | Ian Lewis | 1,633 | 40.8 | ||
| UKIP | Frank Whitham | 433 | 10.8 | ||
| Green | David Dubost | 116 | 2.9 | ||
| Majority | 186 | 4.7 | N/A | ||
| Registered electors | 10,691 | ||||
| Turnout | 37.5 | ||||
| Labour gain from Conservative | Swing | ||||
Liscard
| Party | Candidate | Votes | % | ± | |
|---|---|---|---|---|---|
| Labour | Matthew Daniel | 1,619 | 46.9 | ||
| UKIP | Lynda Williams | 815 | 23.6 | ||
| Conservative | Ann Lavin | 649 | 18.8 | ||
| Green | Craig Reynolds | 273 | 7.9 | ||
| Liberal Democrat | Daniel Clein | 94 | 2.7 | New | |
| Majority | 804 | 23.3 | |||
| Registered electors | 11,120 | ||||
| Turnout | 31.2 | ||||
| Labour hold | Swing | ||||
Moreton West and Saughall Massie
| Party | Candidate | Votes | % | ± | |
|---|---|---|---|---|---|
| Conservative | Bruce Berry | 1,817 | 43.9 | ||
| Labour | Karl Greaney | 1,484 | 35.9 | ||
| UKIP | Susan Whitham | 678 | 16.4 | ||
| Green | Perle Sheldricks | 160 | 3.9 | ||
| Majority | 333 | 8.0 | |||
| Registered electors | 10,885 | ||||
| Turnout | 38.1 | ||||
| Conservative hold | Swing | ||||
New Brighton
| Party | Candidate | Votes | % | ± | |
|---|---|---|---|---|---|
| Labour | Christine Spriggs | 1,658 | 42.3 | ||
| Conservative | Tony Pritchard | 1,348 | 34.4 | ||
| UKIP | John Brown | 492 | 12.6 | ||
| Green | John Howe | 418 | 10.7 | ||
| Majority | 310 | 7.9 | |||
| Registered electors | 10,823 | ||||
| Turnout | 36.3 | ||||
| Labour hold | Swing | ||||
Oxton
| Party | Candidate | Votes | % | ± | |
|---|---|---|---|---|---|
| Liberal Democrat | Alan Brighthouse | 1,620 | 38.3 | ||
| Labour | Angela Davies | 1,483 | 35.1 | ||
| UKIP | David Martin | 563 | 13.3 | ||
| Conservative | Peter Hartley | 310 | 7.3 | ||
| Green | Liz Heydon | 250 | 5.9 | ||
| Majority | 137 | 3.2 | |||
| Registered electors | 11,281 | ||||
| Turnout | 37.5 | ||||
| Liberal Democrat hold | Swing | ||||
Pensby and Thingwall
Compared with 2013 by-election.
| Party | Candidate | Votes | % | ± | |
|---|---|---|---|---|---|
| Labour | Louise Reecejones | 1,334 | 32.6 | ||
| Conservative | Denis Knowles | 1,172 | 28.7 | ||
| UKIP | Jan Davison | 916 | 22.4 | ||
| Liberal Democrat | Damien Cummins | 390 | 9.5 | ||
| Green | Allen Burton | 274 | 6.7 | ||
| Majority | 162 | 3.9 | |||
| Registered electors | 10,520 | ||||
| Turnout | 39.0 | ||||
| Labour gain from Independent | Swing | ||||
Prenton
| Party | Candidate | Votes | % | ± | |
|---|---|---|---|---|---|
| Labour | Denise Realey | 1,731 | 47.0 | ||
| UKIP | James Bradshaw | 802 | 21.8 | ||
| Conservative | Hilary Jones | 578 | 15.7 | ||
| Liberal Democrat | Allan Brame | 310 | 8.4 | ||
| Green | Moira Gommon | 265 | 7.2 | ||
| Majority | 929 | 25.2 | |||
| Registered electors | 10,820 | ||||
| Turnout | 34.2 | ||||
| Labour hold | Swing | ||||
Rock Ferry
| Party | Candidate | Votes | % | ± | |
|---|---|---|---|---|---|
| Labour | Moira McLaughlin | 1,478 | 58.1 | ||
| UKIP | Ann Flynn | 531 | 20.9 | ||
| Conservative | Barbara Poole | 195 | 7.7 | ||
| Green | Karl Cumings | 164 | 6.4 | ||
| Liberal Democrat | Brian Hall | 64 | 2.5 | ||
| Independent | James Pritchard | 64 | 2.5 | ||
| TUSC | Clay Brady | 48 | 1.9 | ||
| Majority | 947 | 37.2 | |||
| Registered electors | 9,654 | ||||
| Turnout | 26.5 | ||||
| Labour hold | Swing | ||||
Seacombe
| Party | Candidate | Votes | % | ± | |
|---|---|---|---|---|---|
| Labour | Adrian Jones | 1,616 | 59.2 | ||
| UKIP | Christopher Wellstead | 688 | 25.2 | ||
| Conservative | Suzanne Sheppick | 211 | 7.7 | ||
| Green | Jayne Clough | 162 | 5.9 | ||
| Independent | Karl Mercer | 53 | 1.9 | New | |
| Majority | 928 | 34.0 | |||
| Registered electors | 10,286 | ||||
| Turnout | 26.7 | ||||
| Labour hold | Swing | ||||
Upton
Compared with 2013 by-election.
| Party | Candidate | Votes | % | ± | |
|---|---|---|---|---|---|
| Labour | Stuart Whittingham | 1,932 | 48.8 | ||
| UKIP | Geoffrey Caton | 942 | 23.8 | New | |
| Conservative | Geoffrey Gubb | 760 | 19.2 | ||
| Green | Jim McGinley | 206 | 5.2 | ||
| Liberal Democrat | Alan Davies | 117 | 3.0 | ||
| Majority | 990 | 25.0 | |||
| Registered electors | 12,101 | ||||
| Turnout | 32.9 | ||||
| Labour hold | Swing | ||||
Wallasey
| Party | Candidate | Votes | % | ± | |
|---|---|---|---|---|---|
| Conservative | Lesley Rennie | 2,216 | 48.8 | ||
| Labour | Paul Ronayne | 1,291 | 28.5 | ||
| UKIP | Brian Farrell | 594 | 13.1 | ||
| Green | Cynthia Stonall | 288 | 6.3 | ||
| Liberal Democrat | John Codling | 148 | 3.3 | New | |
| Majority | 925 | 20.3 | |||
| Registered electors | 11,752 | ||||
| Turnout | 38.7 | ||||
| Conservative hold | Swing | ||||
West Kirby and Thurstaston
| Party | Candidate | Votes | % | ± | |
|---|---|---|---|---|---|
| Conservative | Jeff Green | 2,070 | 47.6 | ||
| Labour | Helen Campbell | 1,192 | 27.4 | ||
| UKIP | David Evennett | 553 | 12.7 | ||
| Green | Shirley Johnson | 259 | 5.9 | ||
| Liberal Democrat | Mike Redfern | 157 | 3.6 | ||
| Independent | Charles Barnes | 122 | 2.8 | ||
| Majority | 878 | 20.2 | |||
| Registered electors | 10,365 | ||||
| Turnout | 42.2 | ||||
| Conservative hold | Swing | ||||
Notes
- ↑ % of total refers to % of wards won.
- ↑ Elected to serve a 4 year term.
- ↑ Elected to serve a 2 year term.
- ↑ Retiring councillor for New Brighton ward.
• italics denote the sitting councillor • bold denotes the winning candidate
References
- 1 2 "Election Result for 22 May 2014". Wirral Metropolitan Borough Council.
- ↑ "Local Election Results 2014 Wirral". Local Elections Archive Project.
- ↑ "Election Result for Bebington ward on 22 May 2014". Wirral Metropolitan Borough Council.
- ↑ "Councillor Walter Smith". Wirral Metropolitan Borough Council.
- ↑ "Election Result for Bidston and St James ward on 22 May 2014". Wirral Metropolitan Borough Council.
- ↑ "Councillor Ann McLachlan". Wirral Metropolitan Borough Council.
- ↑ "Election Result for Birkenhead and Tranmere ward on 22 May 2014". Wirral Metropolitan Borough Council.
- ↑ "Councillor Pat Cleary". Wirral Metropolitan Borough Council.
- ↑ "Councillor Brian Kenny". Wirral Metropolitan Borough Council.
- ↑ "Election Result for Bromborough ward on 22 May 2014". Wirral Metropolitan Borough Council.
- ↑ "Councillor Irene Williams". Wirral Metropolitan Borough Council.
- ↑ "Election Result for Clatterbridge ward on 22 May 2014". Wirral Metropolitan Borough Council.
- ↑ "Councillor Tracey Pilgrim". Wirral Metropolitan Borough Council.
- ↑ "Election Result for Claughton ward on 22 May 2014". Wirral Metropolitan Borough Council.
- ↑ "Councillor Denise Roberts". Wirral Metropolitan Borough Council.
- ↑ "Election Result for Eastham ward on 22 May 2014". Wirral Metropolitan Borough Council.
- ↑ "Councillor Chris Carubia". Wirral Metropolitan Borough Council.
- ↑ "Election Result for Greasby, Frankby and Irby ward on 22 May 2014". Wirral Metropolitan Borough Council.
- ↑ "Councillor Wendy Clements". Wirral Metropolitan Borough Council.
- ↑ "Councillor Tom Anderson". Wirral Metropolitan Borough Council.
- ↑ "Councillor Julie McManus". Wirral Metropolitan Borough Council.
- ↑ "Councillor Peter Reisdorf". Wirral Metropolitan Borough Council.
- ↑ "Election Result for Heswall ward on 22 May 2014". Wirral Metropolitan Borough Council.
- ↑ "Councillor Les Rowlands". Wirral Metropolitan Borough Council.
- ↑ "Election Result for Hoylake and Meols ward on 22 May 2014". Wirral Metropolitan Borough Council.
- ↑ "Councillor Eddie Boult". Wirral Metropolitan Borough Council.
- ↑ "Councillor Patricia Glasman". Wirral Metropolitan Borough Council.
- ↑ "Election Result for Leasowe and Moreton East ward on 22 May 2014". Wirral Metropolitan Borough Council.
- ↑ "Councillor Treena Johnson". Wirral Metropolitan Borough Council.
- ↑ "Councillor Ian Lewis". Wirral Metropolitan Borough Council.
- ↑ "Election Result for Liscard ward on 22 May 2014". Wirral Metropolitan Borough Council.
- ↑ "Election Result for Moreton West and Saughall Massie ward on 22 May 2014". Wirral Metropolitan Borough Council.
- ↑ "Councillor Bruce Berry". Wirral Metropolitan Borough Council.
- ↑ "Election Result for New Brighton ward on 22 May 2014". Wirral Metropolitan Borough Council.
- ↑ "Councillor Christine Spriggs". Wirral Metropolitan Borough Council.
- ↑ "Councillor Tony Pritchard". Wirral Metropolitan Borough Council.
- ↑ "Election Result for Oxton ward on 22 May 2014". Wirral Metropolitan Borough Council.
- ↑ "Councillor Alan Brighthouse". Wirral Metropolitan Borough Council.
- ↑ "Councillor Angela Davies". Wirral Metropolitan Borough Council.
- ↑ "Election Result for Pensby and Thingwall ward on 22 May 2014". Wirral Metropolitan Borough Council.
- ↑ "Councillor Louise Reecejones". Wirral Metropolitan Borough Council.
- ↑ "Councillor Denis Knowles". Wirral Metropolitan Borough Council.
- ↑ "Election Result for Prenton ward on 22 May 2014". Wirral Metropolitan Borough Council.
- ↑ "Councillor Denise Realey". Wirral Metropolitan Borough Council.
- ↑ "Councillor Allan Brame". Wirral Metropolitan Borough Council.
- ↑ "Election Result for Rock Ferry ward on 22 May 2014". Wirral Metropolitan Borough Council.
- ↑ "Councillor Moira McLaughlin". Wirral Metropolitan Borough Council.
- ↑ "Election Result for Seacombe ward on 22 May 2014". Wirral Metropolitan Borough Council.
- ↑ "Councillor Adrian Jones". Wirral Metropolitan Borough Council.
- ↑ "Election Result for Upton ward on 22 May 2014". Wirral Metropolitan Borough Council.
- ↑ "Councillor Stuart Whittingham". Wirral Metropolitan Borough Council.
- ↑ "Election Result for Wallasey ward on 22 May 2014". Wirral Metropolitan Borough Council.
- ↑ "Councillor Lesley Rennie". Wirral Metropolitan Borough Council.
- ↑ "Election Result for West Kirby and Thurstaston ward on 22 May 2014". Wirral Metropolitan Borough Council.
- ↑ "Councillor Jeff Green". Wirral Metropolitan Borough Council.