London local elections, 2018
| |||||||||||||||||||||||||||||||||||||||||||||
All 1,851 councillors on all 32 London boroughs and 4 directly-elected mayors | |||||||||||||||||||||||||||||||||||||||||||||
|---|---|---|---|---|---|---|---|---|---|---|---|---|---|---|---|---|---|---|---|---|---|---|---|---|---|---|---|---|---|---|---|---|---|---|---|---|---|---|---|---|---|---|---|---|---|
| |||||||||||||||||||||||||||||||||||||||||||||
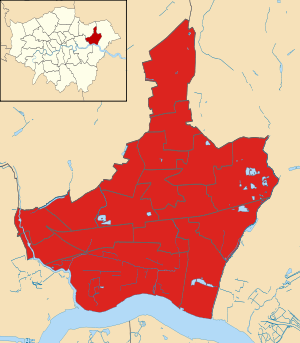
 Map showing London borough councils by political control following the elections, as shown in the main table of results. Black denotes no overall control. *Due to boundary changes, these seat change figures are notional changes calculated by the BBC, and so will not precisely match up with the results of the London local elections, 2014. | |||||||||||||||||||||||||||||||||||||||||||||
Local government elections took place on London on 3 May 2018, as part of the wider local elections in England.
All London borough councillor seats were up for election. Elections to the Corporation of London were held in 2017.[1] Mayoral contests were also held in Hackney, Lewisham, Newham and Tower Hamlets. The previous London borough elections were in 2014.
The results saw the Labour Party achieve their best result in over 45 years, winning 44% of the vote, 1,128 councillors and control of 21 councils. This represented the party's second-best result in a London local election, only surpassed slightly by its 1971 total.
The Conservative Party, by contrast, lost 92 seats to finish with 508 councillors, its lowest-ever tally of seats in a London local election. However, it retained control of 7 councils, having lost two to the Liberal Democrats. The party's vote share increased by 2%, but at 28.8%, it was still the second-worst popular vote total for the Conservatives in the history of the London Boroughs.
The Liberal Democrats made a recovery from their all-time low in the 2014 election, gaining 34 council seats and winning two councils from the Conservatives.
Among the minor parties, the Green Party was the most successful, winning a total of 11 council seats, just below their all-time high of 12 in the 2006 election. Support for the UK Independence Party collapsed, with the party losing all of its seats and dropping from 9.5% of the vote to 0.9%. The only other parties to win seats were the People's Alliance of Tower Hamlets (1 seat) and the Harold Hill Independent Party (1 seat).
Eligibility to vote
All registered electors (British, Irish, Commonwealth and European Union citizens) who are aged 18 or over on polling day were entitled to vote in the local elections.[2] A person who has two homes (such as a university student having a term-time address and living at home during holidays) can register to vote at both addresses as long as they are not in the same electoral area, and can vote in the local elections for the two different local councils.[3]
Results summary
| Party[4] | Votes won | % votes | Change | Seats | % seats | Change† | Councils | Change | |
|---|---|---|---|---|---|---|---|---|---|
| Labour | 1,076,617 | 43.9 | 1,128 | 61.5 | 21 | ||||
| Conservative | 707,373 | 28.8 | 508 | 27.7 | 7 | ||||
| Liberal Democrat | 320,031 | 13.0 | 152 | 8.3 | 3 | ||||
| Green | 211,170 | 8.6 | 11 | 0.6 | 0 | ±0 | |||
| UKIP | 21,077 | 0.9 | 0 | 0.0 | 0 | ±0 | |||
| Others | 118,769 | 4.8 | 34 | 1.9 | 0 | ±0 | |||
| No overall control | N/A | 1 | |||||||
†Due to boundary changes, the figures for seat losses/gains are notional changes calculated by the BBC, and do not match up precisely to the London-wide results in 2014.
Councils results
(Conservative councils in blue, Labour in red, Liberal Democrat in yellow, no overall control in black)
Mayoral elections
There were four mayoral elections.
| Local authority | Previous Mayor | New Mayor | ||
|---|---|---|---|---|
| Hackney | Philip Glanville (Labour) | Philip Glanville (Labour) | ||
| Lewisham | Sir Steve Bullock (Labour) | Damien Egan (Labour) | ||
| Newham | Sir Robin Wales (Labour) | Rokhsana Fiaz (Labour) | ||
| Tower Hamlets | John Biggs (Labour)[n 3] | John Biggs (Labour) | ||
Borough result maps
 Barking and Dagenham 2018 results map
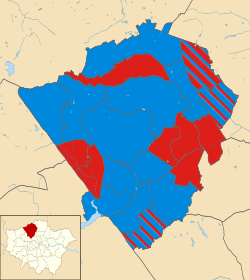 Barnet 2018 results map
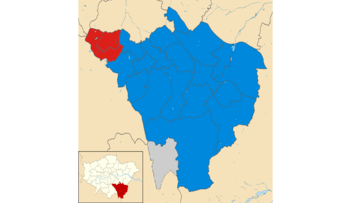 Bromley 2018 results map
 Camden 2018 results map
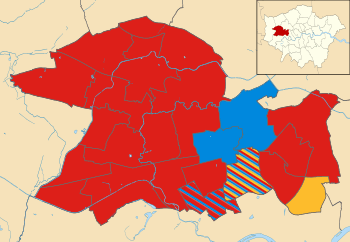 Ealing 2018 results map
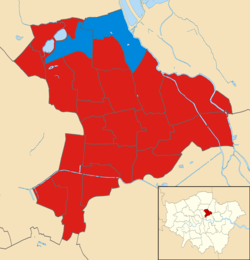 Hackney 2018 results map
 Hammersmith and Fulham 2018 results map
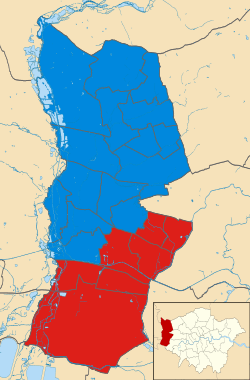 Hillingdon 2018 results map
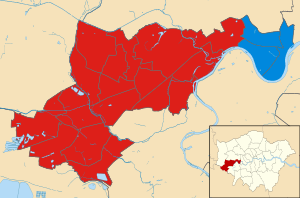 Hounslow 2018 results map
 Islington 2018 results map
 Kingston upon Thames 2018 results map
 Lambeth 2018 results map
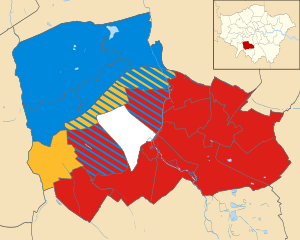 Merton 2018 results map
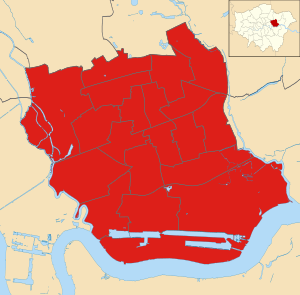 Newham 2018 results map
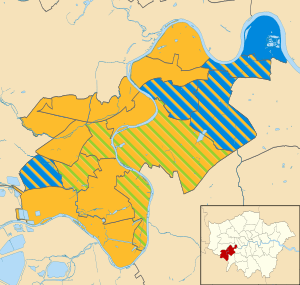 Richmond Upon Thames 2018 results map
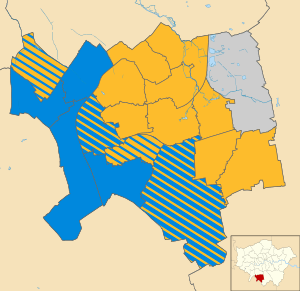 Sutton 2018 results map
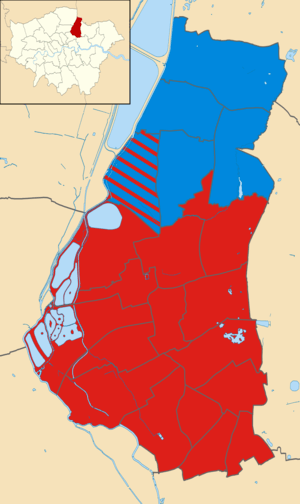 Waltham Forest 2018 results map
Opinion polling
| Date(s) conducted |
Polling organisation/client | Sample size | Lab | Con | Lib Dem | Others | Lead |
|---|---|---|---|---|---|---|---|
| 3 May 2018 | 2018 elections | n/a | 43.9% | 28.8% | 13.0% | 14.3% | 15.0% |
| 27-30 April 2018 | Survation / 4in10 | 1,005 | 51% | 31% | 12% | 6% | 20% |
| 20-24 April 2018 | YouGov / QMUL | 1,099 | 51% | 29% | 11% | 9% | 22% |
| 12-15 Feb 2018 | YouGov / QMUL | 1,155 | 54% | 28% | 11% | 7% | 26% |
| 25-29 Sep 2017 | YouGov / QMUL | 1,044 | 53% | 29% | 12% | 6% | 24% |
| 22 May 2014 | 2014 elections | 2,515,073 | 37.6% | 26.4% | 10.6% | 25.4% | 11.2% |
Notes
- ↑ In Bexley there were boundary changes and a reduced number of seats in the 2018 election.
- ↑ In Willesden Green, polling day was delayed to 21 June 2018 due to the death of the local councillor, Lesley Jones, the vacant three seats were eventually won by Labour.
- ↑ The 2014 election was initially won by Tower Hamlets First, but this result was overturned by an election court decision and Labour won the following by-election.[5]
References
- ↑ "City vote 2017 - About the City - City of London". www.cityoflondon.gov.uk. Retrieved 2017-04-06.
- ↑ "Representation of the People Act 1983, Section 2". Legislation.gov.uk. Retrieved 24 April 2017.
- ↑ Electoral Commission. "I have two homes. Can I register at both addresses?". electoralcommission.org.uk. The Electoral Commission. Retrieved 24 April 2017.
- ↑ https://twitter.com/britainelects/status/998924145990782976
- ↑ "Tower Hamlets election: Labour's John Biggs named mayor - BBC News". Bbc.com. 2015-06-12. Retrieved 2017-04-12.
| Mayor of London | |
|---|---|
| London Assembly | |
| Inner London Education Authority | |
| Greater London Council | |
| London County Council | |
| Borough Councils | |
| Referendums | |
| |