Knowsley Metropolitan Borough Council election, 2018
|
| |||||||||||||||||||||||||||||||||||||||||||||||||||||||||||||||||||||||||||||||||||
| |||||||||||||||||||||||||||||||||||||||||||||||||||||||||||||||||||||||||||||||||||
15 of 45 seats (One Third) to Knowsley Metropolitan Borough Council 23 seats needed for a majority | |||||||||||||||||||||||||||||||||||||||||||||||||||||||||||||||||||||||||||||||||||
|---|---|---|---|---|---|---|---|---|---|---|---|---|---|---|---|---|---|---|---|---|---|---|---|---|---|---|---|---|---|---|---|---|---|---|---|---|---|---|---|---|---|---|---|---|---|---|---|---|---|---|---|---|---|---|---|---|---|---|---|---|---|---|---|---|---|---|---|---|---|---|---|---|---|---|---|---|---|---|---|---|---|---|---|
| |||||||||||||||||||||||||||||||||||||||||||||||||||||||||||||||||||||||||||||||||||
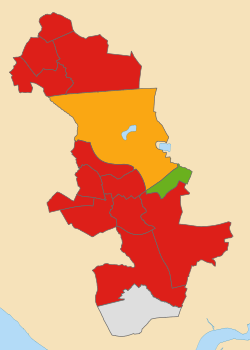 Map of results of 2018 election | |||||||||||||||||||||||||||||||||||||||||||||||||||||||||||||||||||||||||||||||||||
| |||||||||||||||||||||||||||||||||||||||||||||||||||||||||||||||||||||||||||||||||||
The 2018 Knowsley Metropolitan Borough Council Election took place on 3 May 2018 to elect members of Knowsley Metropolitan Borough Council in England. [1] This was on the same day as other local elections.
After the election, the composition of the council was:
| Party | Seats | ± | |
|---|---|---|---|
| Labour | 40 | ||
| Liberal Democrats | 3 | ||
| Green | 1 | ||
| Independent | 1 | ||
Election Results
Overall election result
Overall result compared with 2016.
| Knowsley Metropolitan Borough Council Election Results, 2018 | |||||||||||||||
|---|---|---|---|---|---|---|---|---|---|---|---|---|---|---|---|
| Party | Candidates | Votes | |||||||||||||
| Stood | Elected | Gained | Unseated | Net | % of total | % | № | Net % | |||||||
| Labour | 15 | 12 | 0 | 2 | 80.0 | 66.2 | 19,007 | ||||||||
| Green | 7 | 1 | 1 | 0 | 6.7 | 12.4 | 3,553 | ||||||||
| Conservative | 9 | 0 | 0 | 0 | 0.0 | 6.9 | 1,993 | ||||||||
| Liberal Democrat | 4 | 1 | 0 | 0 | 6.7 | 6.8 | 1,704 | ||||||||
| Independent | 5 | 1 | 1 | 0 | 6.7 | 5.9 | 1,704 | ||||||||
| UKIP | 3 | 0 | 0 | 0 | 0.0 | 1.2 | 334 | ||||||||
| TUSC | 1 | 0 | 0 | 0 | 0.0 | 0.5 | 156 | ||||||||
Changes in council composition
Prior to the election the composition of the council was:
| 42 | 3 |
| Lab | LD |
After the election, the composition of the council was:
| 40 | 3 | 1 | 1 |
| Lab | LD | G | I |
Votes summary
Seats summary
Ward results
Results compared directly with the last local election in 2016 except for St Michael's which is compared directly with the 2017 St Michael's By election and Page Moss which is compared directly with the 2018 Page Moss By election.
Cherryfield
| Party | Candidate | Votes | % | ± | |
|---|---|---|---|---|---|
| Labour | David Lonergan | 1,329 | 82.0 | ||
| Green Party - Save Our Green Space | Michael Dooley | 188 | 11.6 | New | |
| Conservative | Adam Butler | 103 | 6.4 | ||
| Majority | 1,141 | 70.4 | |||
| Turnout | 20.3 | ||||
| Labour hold | Swing | ||||
Halewood North
| Party | Candidate | Votes | % | ± | |
|---|---|---|---|---|---|
| Labour | Terry Powell | 1,419 | 66.5 | ||
| Independent | Bob Swann | 447 | 20.9 | ||
| Liberal Democrat | Jenny McNeilis | 268 | 12.6 | New | |
| Majority | 972 | 45.6 | |||
| Turnout | 26.0 | ||||
| Labour hold | Swing | ||||
Halewood South
| Party | Candidate | Votes | % | ± | |
|---|---|---|---|---|---|
| Independent | Allan Harvey | 1,231 | 47.3 | ||
| Labour | Gary See | 1,190 | 45.8 | ||
| Conservative | Graham Tubey | 180 | 6.9 | ||
| Majority | 41 | 1.5 | N/A | ||
| Turnout | 32.1 | ||||
| Independent gain from Labour | Swing | ||||
Northwood
| Party | Candidate | Votes | % | ± | |
|---|---|---|---|---|---|
| Labour | Harry Bell | 1,439 | 86.5 | ||
| Green Party - Save Our Green Space | Russell Greenway | 225 | 13.5 | New | |
| Majority | 1,214 | 73.0 | |||
| Turnout | 19.9 | ||||
| Labour hold | Swing | ||||
Page Moss
| Party | Candidate | Votes | % | ± | |
|---|---|---|---|---|---|
| Labour Co-op | Andy Moorhead | 1,152 | 80.1 | ||
| Green Party - Save Our Green Space | Kirk Sandringham | 287 | 19.9 | ||
| Majority | 865 | 60.2 | |||
| Turnout | 18.7 | ||||
| Labour Co-op hold | Swing | ||||
Prescot North
| Party | Candidate | Votes | % | ± | |
|---|---|---|---|---|---|
| Liberal Democrat | Frances Wynn | 1,373 | 60.3 | ||
| Labour | Tony Ely | 781 | 34.3 | ||
| Conservative | Aaron Waters | 124 | 5.4 | ||
| Majority | 592 | 26.0 | |||
| Turnout | 30.1 | ||||
| Liberal Democrat hold | Swing | ||||
Prescot South
| Party | Candidate | Votes | % | ± | |
|---|---|---|---|---|---|
| Green Party - Save Our Green Space | Kai Taylor | 1,520 | 65.5 | New | |
| Labour | Lynn O’Keeffe | 736 | 31.7 | ||
| Conservative | Sheila Webster | 64 | 2.8 | ||
| Majority | 784 | 33.8 | N/A | ||
| Turnout | 2,322 | 32.8 | |||
| Green gain from Labour | Swing | ||||
Roby
| Party | Candidate | Votes | % | ± | |
|---|---|---|---|---|---|
| Labour | Kevin Bannon | 1,299 | 56.1 | ||
| Green Party - Save Our Green Space | Martin Mackerel | 510 | 22.0 | ||
| Conservative | Antony Reed | 400 | 17.3 | ||
| Independent | Jayne Tattan | 107 | 4.6 | New | |
| Majority | 789 | 34.1 | |||
| Turnout | 31.1 | ||||
| Labour hold | Swing | ||||
Shevington
| Party | Candidate | Votes | % | ± | |
|---|---|---|---|---|---|
| Labour | Tommy Rowe | 1,402 | 90.0 | ||
| TUSC | Neill Dunne | 156 | 10.0 | ||
| Majority | 1,246 | 80.0 | |||
| Turnout | 20.7 | ||||
| Labour hold | Swing | ||||
St Gabriel's
| Party | Candidate | Votes | % | ± | |
|---|---|---|---|---|---|
| Labour | Dot Johnson | 1,352 | 76.7 | ||
| Liberal Democrat | Dean Boyle | 153 | 8.7 | New | |
| UKIP | Fred Fricker | 131 | 7.4 | ||
| Conservative | Victoria Smart | 127 | 7.2 | ||
| Majority | 1,199 | 68.0 | |||
| Turnout | 24.5 | ||||
| Labour hold | Swing | ||||
St Michael's
| Party | Candidate | Votes | % | ± | |
|---|---|---|---|---|---|
| Labour | Kay Moorhead | 1,267 | 84.7 | ||
| Conservative | Sheila Scott | 118 | 7.9 | New | |
| UKIP | John Price | 111 | 7.4 | New | |
| Majority | 1,149 | 76.8 | |||
| Turnout | 21.3 | ||||
| Labour hold | Swing | ||||
Stockbridge
| Party | Candidate | Votes | % | ± | |
|---|---|---|---|---|---|
| Labour | Dennis Baum | 1,189 | 76.7 | ||
| Green Party - Save Our Green Space | Paul Ryan | 189 | 12.2 | New | |
| Independent | Paul Woods | 173 | 11.2 | ||
| Majority | 1,000 | 64.5 | |||
| Turnout | 19.5 | ||||
| Labour hold | Swing | ||||
Swanside
| Party | Candidate | Votes | % | ± | |
|---|---|---|---|---|---|
| Labour | Colin Dever | 1,666 | 81.3 | ||
| Independent | Johnny Webster | 193 | 9.4 | New | |
| Conservative | Carole Sullivan | 190 | 9.3 | ||
| Majority | 1,473 | 71.9 | |||
| Turnout | 27.6 | ||||
| Labour hold | Swing | ||||
Whiston and Cronton
| Party | Candidate | Votes | % | ± | |
|---|---|---|---|---|---|
| Labour | Gillian Flatley | 1,207 | 55.5 | ||
| Green Party - Save Our Green Space | Ron Gaffney | 634 | 29.2 | New | |
| Conservative | Carl Cross | 240 | 11.0 | ||
| UKIP | Neil Miney | 92 | 4.2 | New | |
| Majority | 573 | 26.3 | |||
| Turnout | 29.1 | ||||
| Labour hold | Swing | ||||
Whitefield
| Party | Candidate | Votes | % | ± | |
|---|---|---|---|---|---|
| Labour | Louise Harbour | 1,579 | 90.6 | ||
| Liberal Democrat | Les Rigby | 164 | 9.4 | New | |
| Majority | 1,415 | 81.2 | |||
| Turnout | 22.3 | ||||
| Labour hold | Swing | ||||
Changes between 2018 and 2019
Halewood South by-election 2018
| Party | Candidate | Votes | % | ± | |
|---|---|---|---|---|---|
| Labour | Gary See | 1,012 | 51.6 | ||
| Independent | Bob Swann | 778 | 39.7 | ||
| Liberal Democrat | Jenny McNeilis | 118 | 6.0 | New | |
| Conservative | Ruth Smart | 54 | 2.8 | ||
| Majority | 234 | 11.9 | N/A | ||
| Turnout | 1,968 | ||||
| Rejected ballots | 6 | 0.3 | |||
| Labour hold | Swing | ||||
Notes
• italics denote a sitting councillor • bold denotes the winning candidate
References
- ↑ "Notice of Election" (PDF). Knowsley Metropolitan Borough Council.
- ↑ "Borough Elections Results - May 2018" (PDF). Knowsley Metropolitan Borough Council.
- ↑ "Halewood South Ward By-election Results" (PDF). Knowsley Metropolitan Borough Council. Retrieved 24 August 2018.
- ↑ "Statements of Persons Nominated". Knowsley Metropolitan Borough Council. Retrieved 23 August 2018.
| Knowsley Metropolitan Borough Council | |
|---|---|
| Liverpool City Council |
|
| Mayor of Liverpool | |
| Liverpool School Board | |
| Sefton Metropolitan Borough Council | |
| St Helens Metropolitan Borough Council | |
| Wirral Metropolitan Borough Council | |
| Merseyside County Council |
|
| Liverpool City Region Mayor | |
| |