Wigan Metropolitan Borough Council election, 2018
 | |||||||||||||||||||||||||
25 of 75 seats to Wigan Metropolitan Borough Council 38 seats needed for a majority | |||||||||||||||||||||||||
|---|---|---|---|---|---|---|---|---|---|---|---|---|---|---|---|---|---|---|---|---|---|---|---|---|---|
| |||||||||||||||||||||||||
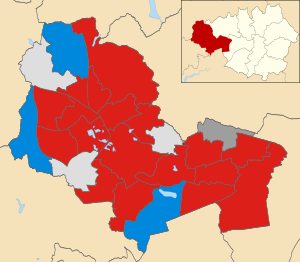 | |||||||||||||||||||||||||
The 2018 Wigan Metropolitan Borough Council election took place on 3 May 2018 to elect members of Wigan Metropolitan Borough Council in England.[1] This was on the same day as other local elections.
Overview
| Party | Number |
|---|---|
| Labour Party (UK) | 25 |
| Conservative Party (UK) | 25 |
| Liberal Democrats (UK) | 14 |
| Independent politician | 12 |
| UK Independence Party | 6 |
| Green Party of England and Wales | 3 |
| Shevington Independents | 1 |
| Standish Independents | 1 |
| Democrats and Veterans | 1 |
| Party | Seats won at Election | Total Seats on Council | ± |
|---|---|---|---|
| Labour Party (UK) | 18 | 60 | |
| Conservative Party (UK) | 3 | 7 | |
| Independent politician (including IN) | 3 | 6 | |
| Standish Independents | 0 | 1 | |
| Shevington Independents | 1 | 1 |
Results
Bolton West constituency
Atherton ward
| Party | Candidate | Votes | % | ± | |
|---|---|---|---|---|---|
| Independent Network | Stuart Gerrard | 1779 | 53.65 | ||
| Labour | Karen Aldred | 1197 | 36.1 | ||
| Conservative | Marjorie Clayton | 334 | 10.1 | ||
| Rejected ballots | 6 | 0.18 | |||
| Majority | 582 | 17.6 | |||
| Turnout | 3316 | 30.66 | |||
Makerfield constituency
Abram ward
| Party | Candidate | Votes | % | ± | |
|---|---|---|---|---|---|
| Labour | Carl Sweeney | 1479 | 68.57 | ||
| Conservative | Beverley Bridgwater | 404 | 18.78 | ||
| UKIP | Frank Swift | 274 | 12.7 | ||
| Rejected ballots | 5 | 0.23 | |||
| Majority | 1075 | 49.84 | |||
| Turnout | 2157 | 20.74 | |||
Ashton ward
| Party | Candidate | Votes | % | ± | |
|---|---|---|---|---|---|
| Labour | Anthony Sykes | 1112 | 53.13 | ||
| Independent | Michael Moulding | 793 | 37.9 | ||
| UKIP | Gillian Gibson | 109 | 5.21 | ||
| Liberal Democrat | Geoffrey Matthews | 41 | 1.96 | ||
| Conservative | Marie Winstanley | 36 | 1.72 | ||
| Rejected ballots | 2 | 0.1 | |||
| Majority | 319 | 15.24 | |||
| Turnout | 2093 | 23.54 | |||
Bryn ward
| Party | Candidate | Votes | % | ± | |
|---|---|---|---|---|---|
| Independent | Andrew Collinson | 1065 | 43.7 | ||
| Labour | Vicky Johnson | 973 | 39.9 | ||
| Conservative | Judith Anderson | 198 | 8.12 | ||
| UKIP | Philip Hayden | 133 | 5.46 | ||
| Liberal Democrat | Denise Melling | 67 | 2.75 | ||
| Rejected ballots | 2 | 0.08 | |||
| Majority | 92 | 3.78 | |||
| Turnout | 2438 | 27.58 | |||
Hindley ward
| Party | Candidate | Votes | % | ± | |
|---|---|---|---|---|---|
| Labour | Jim Talbot | 1063 | 45.6 | ||
| Independent | Jim Ellis | 905 | 38.8 | ||
| Conservative | Margaret Winstanley | 206 | 8.83 | ||
| Green | Neil Hancox | 86 | 3.7 | ||
| Liberal Democrat | John Skipworth | 58 | 2.5 | ||
| Rejected ballots | 14 | 0.6 | |||
| Majority | 158 | 6.8 | |||
| Turnout | 2332 | 24.13 | |||
Hindley Green ward
| Party | Candidate | Votes | % | ± | |
|---|---|---|---|---|---|
| Independent | Paul Maiden | 976 | 41.36 | ||
| Labour | Gena Merrett | 787 | 33.34 | ||
| Liberal Democrat | John Thomason | 305 | 12.92 | ||
| Conservative | Jonathan Cartwright | 287 | 12.16 | ||
| Rejected ballots | 5 | 0.21 | |||
| Majority | 189 | 8.0 | |||
| Turnout | 2360 | 27.35 | |||
Orrell ward
| Party | Candidate | Votes | % | ± | |
|---|---|---|---|---|---|
| Conservative | Richard Clayton | 1430 | 46.47 | ||
| Labour | Eileen Rigby | 1273 | 41.37 | ||
| Liberal Democrat | Denise Capstick | 367 | 11.92 | ||
| Rejected ballots | 7 | 0.23 | |||
| Majority | 157 | 5.10 | |||
| Turnout | 3077 | 32.24 | |||
Winstanley ward
| Party | Candidate | Votes | % | ± | |
|---|---|---|---|---|---|
| Labour | Clive Morgan | 1369 | 57.11 | ||
| Conservative | Daniel Whitehouse | 509 | 21.23 | ||
| Green | Steven Heyes | 195 | 8.14 | ||
| UKIP | Daniel Singleton | 177 | 7.38 | ||
| Liberal Democrat | Neil Stevenson | 114 | 4.76 | ||
| Rejected ballots | 6 | 0.25 | |||
| Majority | 887 | 37.0 | |||
| Turnout | 2397 | 26.15 | |||
Worsley Mesnes ward
| Party | Candidate | Votes | % | ± | |
|---|---|---|---|---|---|
| Labour | Patricia Holland | 1449 | 66.46 | ||
| UKIP | Maureen McCoy | 327 | 15.0 | ||
| Conservative | Paul Chapman | 314 | 14.40 | ||
| Liberal Democrat | Joshua Hindle | 90 | 4.13 | ||
| Rejected ballots | 2 | 0.09 | |||
| Majority | 1122 | 51.46 | |||
| Turnout | 2180 | 24.07 | |||
Leigh constituency
Astley Mosley Common ward
| Party | Candidate | Votes | % | ± | |
|---|---|---|---|---|---|
| Labour | Barry Taylor | 1349 | 52.43 | ||
| Conservative | Richard Short | 1082 | 42.05 | ||
| Liberal Democrat | Stuart Thomas | 131 | 5.09 | ||
| Rejected ballots | 11 | 0.43 | |||
| Majority | 267 | 10.38 | |||
| Turnout | 2573 | 27.21 | |||
Atherleigh ward
| Party | Candidate | Votes | % | ± | |
|---|---|---|---|---|---|
| Labour | Debra Wailes | 938 | 48.03 | ||
| Independent Network | Anthony Waite | 550 | 28.16 | ||
| Conservative | Paul Fairhurst | 394 | 20.17 | ||
| Liberal Democrat | Lorraine Gillon | 68 | 3.48 | ||
| Rejected ballots | 3 | 0.15 | |||
| Majority | 388 | 19.87 | |||
| Turnout | 1953 | 23.44 | |||
Golborne Lowton West ward
| Party | Candidate | Votes | % | ± | |
|---|---|---|---|---|---|
| Labour | Susan Gambles | 1280 | 57.17 | ||
| Independent | William Heaton | 612 | 27.33 | ||
| Conservative | Gerard Houlton | 345 | 15.41 | ||
| Rejected ballots | 2 | 0.09 | |||
| Majority | 668 | 29.83 | |||
| Turnout | 2239 | 25.26 | |||
Leigh East ward
| Party | Candidate | Votes | % | ± | |
|---|---|---|---|---|---|
| Labour | Frederick Walker | 1189 | 59.21 | ||
| Conservative | Denise Young | 518 | 25.8 | ||
| Liberal Democrat | John Dowsett | 288 | 14.34 | ||
| Rejected ballots | 13 | 0.65 | |||
| Majority | 671 | 33.42 | |||
| Turnout | 2008 | 22.23 | |||
Leigh South ward
| Party | Candidate | Votes | % | ± | |
|---|---|---|---|---|---|
| Labour | Charles Rigby | 1531 | 53.9 | ||
| Conservative | Connor Short | 1283 | 45.16 | ||
| Rejected ballots | 27 | 0.95 | |||
| Majority | 248 | 8.73 | |||
| Turnout | 2841 | 27.49 | |||
Leigh West ward
| Party | Candidate | Votes | % | ± | |
|---|---|---|---|---|---|
| Labour | Peter Smith, Baron Smith of Leigh | 1308 | 53.92 | ||
| Independent | Jayson Lomax-Hargreaves | 578 | 23.83 | ||
| Conservative | Richard Houlton | 374 | 15.42 | ||
| Liberal Democrat | Natalie Smalley | 158 | 6.51 | ||
| Rejected ballots | 8 | 0.33 | |||
| Majority | 730 | 30.09 | |||
| Turnout | 2426 | 23.11 | |||
Lowton East ward
| Party | Candidate | Votes | % | ± | |
|---|---|---|---|---|---|
| Conservative | Edward Houlton | 2099 | 60.49 | ||
| Labour | Garry Lloyd | 1346 | 38.79 | ||
| Rejected ballots | 25 | 0.72 | |||
| Majority | 753 | 21.70 | |||
| Turnout | 3470 | 36.05 | |||
Tyldesley ward
| Party | Candidate | Votes | % | ± | |
|---|---|---|---|---|---|
| Labour | Joanne Marshall | 1,344 | |||
| Independent | Julian Marsh | 706 | |||
| Conservative | David Stirzaker | 587 | |||
| Rejected ballots | |||||
| Majority | |||||
| Turnout | |||||
Wigan constituency
Aspull, New Springs and Whelley ward
| Party | Candidate | Votes | % | ± | |
|---|---|---|---|---|---|
| Labour | Ronald Conway | 1,708 | 61.4 | ||
| Conservative | Michael Owens | 764 | 27.5 | ||
| Liberal Democrat | Andrew Holland | 308 | 11.1 | ||
| Majority | 944 | 33.9 | |||
| Turnout | 2,780 | 28.2 | |||
| Labour hold | Swing | N/A | |||
Douglas ward
| Party | Candidate | Votes | % | ± | |
|---|---|---|---|---|---|
| Labour | Shirley Dewhurst | 1,551 | 78.6 | ||
| Conservative | Margaret Atherton | 422 | 21.4 | ||
| Majority | 1,129 | 57.2 | |||
| Turnout | 1,973 | 20.8 | |||
| Labour hold | Swing | N/A | |||
Ince ward
| Party | Candidate | Votes | % | ± | |
|---|---|---|---|---|---|
| Labour | James Moodie | 1,273 | 69.2 | ||
| Independent | James O'Neill | 379 | 20.6 | ||
| Conservative | Yamini Gupta | 188 | 10.2 | ||
| Majority | 894 | 48.6 | |||
| Turnout | 1,840 | 20.7 | |||
| Labour hold | Swing | N/A | |||
Pemberton ward
| Party | Candidate | Votes | % | ± | |
|---|---|---|---|---|---|
| Labour | Paul Prescott | 1,472 | 74.4 | ||
| Conservative | Susan Atherton | 322 | 16.3 | ||
| Liberal Democrat | David Burley | 185 | 9.3 | ||
| Majority | 1,150 | 58.1 | |||
| Turnout | 1,979 | 20.6 | |||
| Labour hold | Swing | N/A | |||
Shevington with Lower Ground ward
| Party | Candidate | Votes | % | ± | |
|---|---|---|---|---|---|
| Shevington Independents | Janet Brown | 1,107 | 40.1 | ||
| Labour | Mike Crosby | 1,045 | 37.9 | ||
| Conservative | Allan Atherton | 487 | 17.7 | ||
| Green | Joseph Rylance | 120 | 4.3 | ||
| Majority | 62 | 2.2 | N/A | ||
| Turnout | 2,759 | 29.6 | |||
| Shevington Independents gain from Labour | Swing | ||||
Standish with Langtree ward
| Party | Candidate | Votes | % | ± | |
|---|---|---|---|---|---|
| Conservative | Adam Marsh | 1,200 | 36.8 | ||
| Labour | Debbie Parkinson | 1,185 | 36.4 | ||
| Standish Independents | Debbie Fairhurst | 872 | 26.8 | ||
| Majority | 15 | 0.4 | N/A | ||
| Turnout | 3,257 | 33.3 | |||
| Conservative gain from Standish Independents | Swing | ||||
Wigan Central ward
| Party | Candidate | Votes | % | ± | |
|---|---|---|---|---|---|
| Labour | George Davies | 1,518 | 55.5 | ||
| Conservative | Lewis Evans | 834 | 30.5 | ||
| Liberal Democrat | Caroline Waddicor | 163 | 6.0 | ||
| Wigan Independents | Gareth Fairhurst | 130 | 4.8 | ||
| Independent | Tony Spencer | 89 | 3.3 | ||
| Majority | 684 | 25.0 | |||
| Turnout | 2,734 | 29.5 | |||
| Labour hold | Swing | N/A | |||
Wigan West ward
| Party | Candidate | Votes | % | ± | |
|---|---|---|---|---|---|
| Labour | Phyllis Cullen | 1,746 | 72.0 | ||
| Conservative | Jean Peet | 363 | 15.0 | ||
| UKIP | Nathan Ryding | 176 | 7.3 | ||
| Democrats and Veterans | Ronnie Clark | 140 | 5.8 | ||
| Majority | 1,383 | 57.0 | |||
| Turnout | 2,425 | 25.4 | |||
| Labour hold | Swing | ||||
References
- ↑ "Elections: Local elections". wigan.gov.uk. Wigan Metropolitan Borough Council. Retrieved 23 April 2018.
External links
| Mayor | |
|---|---|
| Bolton | |
| Bury | |
| Manchester | |
| Oldham | |
| Rochdale | |
| Salford | |
| Stockport | |
| Tameside | |
| Trafford | |
| Wigan | |
| County Council |
|
| |
This article is issued from
Wikipedia.
The text is licensed under Creative Commons - Attribution - Sharealike.
Additional terms may apply for the media files.