Sefton Metropolitan Borough Council election, 2018
|
| |||||||||||||||||||||||||||||||||||||||||||||||||||||||||||||||||||||||||||||
| |||||||||||||||||||||||||||||||||||||||||||||||||||||||||||||||||||||||||||||
23 of 66 seats (One Third) to Sefton Metropolitan Borough Council 34 seats needed for a majority | |||||||||||||||||||||||||||||||||||||||||||||||||||||||||||||||||||||||||||||
|---|---|---|---|---|---|---|---|---|---|---|---|---|---|---|---|---|---|---|---|---|---|---|---|---|---|---|---|---|---|---|---|---|---|---|---|---|---|---|---|---|---|---|---|---|---|---|---|---|---|---|---|---|---|---|---|---|---|---|---|---|---|---|---|---|---|---|---|---|---|---|---|---|---|---|---|---|---|
| |||||||||||||||||||||||||||||||||||||||||||||||||||||||||||||||||||||||||||||
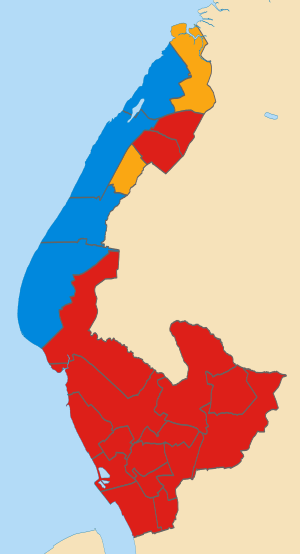 Map of results of 2018 election | |||||||||||||||||||||||||||||||||||||||||||||||||||||||||||||||||||||||||||||
| |||||||||||||||||||||||||||||||||||||||||||||||||||||||||||||||||||||||||||||
.jpg)
The 2018 Sefton Metropolitan Borough Council election took place on 3 May 2018 to elect members of Sefton Metropolitan Borough Council in England.[1] It was held on the same day as other local elections.
Labour retained control of the council with an increased majority, winning an additional three seats and winning their first ever seats in Southport. The Liberal Democrats led by former MP for Southport John Pugh, lost four seats in total whilst the Conservatives gained seats in the wards of Cambridge and Ainsdale.
Candidates
Ainsdale
| Party | Candidate | Votes | % | ± | |
|---|---|---|---|---|---|
| Conservative | Tony Brough | 1891 | 45.9 | ||
| Labour Co-op | Frank Hanley | 1084 | 26.3 | ||
| Liberal Democrat | Jude Storer | 935 | 22.8 | ||
| Green | Barbara Dutton | 118 | 2.9 | ||
| UKIP | Peter Forder | 95 | 2.3 | ||
| Majority | 807 | 19.6 | |||
| Turnout | 4123 | 40.7 | |||
| Conservative gain from Liberal Democrat | Swing | ||||
Birkdale
| Party | Candidate | Votes | % | ± | |
|---|---|---|---|---|---|
| Liberal Democrat | Iain Brodie Browne | 1249 | 38.3 | ||
| Labour | Daniel Burns | 982 | 30.1 | ||
| Conservative | Jacky Bliss | 806 | 24.7 | ||
| Green | David Collins | 121 | 3.7 | ||
| UKIP | Derek Tasker | 101 | 3.1 | ||
| Majority | 267 | 8.2 | |||
| Turnout | 4123 | 40.7 | |||
| Liberal Democrat hold | Swing | ||||
Blundellsands
| Party | Candidate | Votes | % | ± | |
|---|---|---|---|---|---|
| Labour | Sam Marshall | 2027 | 55.9 | ||
| Conservative | Wendy Moore | 1166 | 32.2 | ||
| Liberal Democrat | Brian Dunning | 269 | 7.4 | ||
| Green | Alison Gibbon | 164 | 4.5 | ||
| Majority | 861 | 8.2 | |||
| Turnout | 3626 | 38.4 | |||
| Labour hold | Swing | ||||
Cambridge
| Party | Candidate | Votes | % | ± | |
|---|---|---|---|---|---|
| Conservative | Mike Morris | 1258 | 36.6 | ||
| Liberal Democrat | Leo Evans | 1192 | 34.7 | ||
| Labour | Stephen Jowett | 757 | 22.0 | ||
| UKIP | Terry Durrance | 123 | 3.6 | ||
| Green | Carla Fox | 110 | 3.2 | ||
| Majority | 66 | 1.9 | |||
| Turnout | 3440 | 33.6 | |||
| Conservative gain from Liberal Democrat | Swing | ||||
Church
| Party | Candidate | Votes | % | ± | |
|---|---|---|---|---|---|
| Labour | Daren Veidman | 2018 | 76.9 | ||
| Conservative | Anne Clegg | 271 | 10.3 | ||
| Green | Laurence Rankin | 237 | 9.0 | ||
| Liberal Democrat | Frances Eaton | 99 | 3.8 | ||
| Majority | 1747 | 66.6 | |||
| Turnout | 2625 | 28.3 | |||
| Labour hold | Swing | ||||
Derby
| Party | Candidate | Votes | % | ± | |
|---|---|---|---|---|---|
| Labour | Mike O'Brien | 1834 | 87.7 | ||
| Conservative | David Bright | 163 | 7.8 | ||
| Liberal Democrat | Andrew Tonkiss | 94 | 4.5 | N/A | |
| Majority | 1671 | 79.9 | |||
| Turnout | 2091 | 22.9 | |||
| Labour hold | Swing | ||||
Dukes
| Party | Candidate | Votes | % | ± | |
|---|---|---|---|---|---|
| Conservative | Sir Ron Watson | 1409 | 40.1 | ||
| Liberal Democrat | Jo Barton | 1275 | 36.3 | ||
| Labour | Sahar Dehghani-Barenji | 710 | 20.2 | ||
| Green | Nick Senior | 118 | 3.4 | ||
| Majority | 134 | 3.8 | |||
| Turnout | 3512 | 32.7 | |||
| Conservative hold | Swing | ||||
Ford
| Party | Candidate | Votes | % | ± | |
|---|---|---|---|---|---|
| Labour | Liz Dowd | 1665 | 42.0 | N/A | |
| Labour | Ian Moncur | 1659 | 42.0 | N/A | |
| Conservative | Lynne Bold | 181 | 5.0 | N/A | |
| Green | Roy Greason | 163 | 4.0 | N/A | |
| Conservative | Pamela Teesdale | 139 | 4.0 | N/A | |
| Liberal Democrat | Adarsh Makdani | 77 | 2.0 | N/A | |
| Liberal Democrat | Carol Tonkiss | 73 | 2.0 | N/A | |
| Majority | 1032 | 37.0 | |||
| Turnout | 3957 | 42.5 | |||
| Labour hold | Swing | ||||
Harington
| Party | Candidate | Votes | % | ± | |
|---|---|---|---|---|---|
| Conservative | Denise Dutton | 1820 | 46.0 | ||
| Labour | Carol Richards | 1363 | 35.0 | ||
| Formby Residents Action Group | Derek Baxter | 578 | 15.0 | N/A | |
| Liberal Democrat | Keith Cawdron | 174 | 4.0 | ||
| Majority | 457 | 12.0 | |||
| Turnout | 3935 | 39.6 | |||
| Conservative hold | Swing | ||||
Kew
| Party | Candidate | Votes | % | ± | |
|---|---|---|---|---|---|
| Labour | Janis Blackburne | 1448 | 44.8 | ||
| Liberal Democrat | Fred Weavers | 1012 | 31.3 | ||
| Conservative | Margaret Middleton | 563 | 17.4 | ||
| UKIP | Linda Gunn-Rosso | 128 | 4.0 | ||
| Green | Robert Doyle | 80 | 2.5 | ||
| Majority | 436 | 13.5 | |||
| Turnout | 3231 | 32.5 | |||
| Labour gain from Liberal Democrat | Swing | 14.5 | |||
Litherland
| Party | Candidate | Votes | % | ± | |
|---|---|---|---|---|---|
| Labour | John Kelly | 1851 | 84.0 | ||
| Conservative | Jessamine Hounslea | 192 | 9.0 | ||
| Green | Ethan Wykes | 148 | 7.0 | N/A | |
| Majority | 1659 | 76.0 | |||
| Turnout | 2191 | 24.7 | |||
| Labour hold | Swing | ||||
Manor
| Party | Candidate | Votes | % | ± | |
|---|---|---|---|---|---|
| Labour | Steve McGinnity | 1789 | 57.0 | ||
| Conservative | Janice Blanchard | 852 | 27.0 | ||
| Liberal Democrat | John Gibson | 333 | 11.0 | ||
| Green | Michael Walsh | 143 | 5.0 | ||
| Majority | 937 | 30.0 | |||
| Turnout | 3117 | 31.1 | |||
| Labour hold | Swing | ||||
Meols
| Party | Candidate | Votes | % | ± | |
|---|---|---|---|---|---|
| Liberal Democrat | Daniel Lewis | 1466 | 41.7 | ||
| Conservative | Jordan Shandley | 1141 | 32.5 | ||
| Labour | Janet Harrison | 789 | 22.5 | ||
| Green | Alwynne Cartmell | 118 | 3.4 | ||
| Majority | 325 | 9.2 | |||
| Turnout | 3514 | 34.8 | |||
| Liberal Democrat hold | Swing | ||||
Molyneux
| Party | Candidate | Votes | % | ± | |
|---|---|---|---|---|---|
| Labour | Anthony Carr | 1736 | 61.0 | ||
| Independent | Jack Colbert | 440 | 15.0 | N/A | |
| Conservative | Marcus Bleasdale | 327 | 11.0 | ||
| UKIP | Peter Harper | 151 | 5.0 | ||
| Green | Mike Carter | 103 | 4.0 | ||
| Liberal Democrat | Terry Doyle | 99 | 3.0 | N/A | |
| Majority | 1296 | 46.0 | |||
| Turnout | 2856 | 28.0 | |||
| Labour hold | Swing | ||||
Netherton & Orrell
| Party | Candidate | Votes | % | ± | |
|---|---|---|---|---|---|
| Labour | Ian Maher | 1976 | 82.0 | ||
| Conservative | Paul Anthony Huckstepp | 182 | 8.0 | ||
| UKIP | Pat Gaskell | 121 | 5.0 | ||
| Green | Maureen Grainger | 118 | 5.0 | N/A | |
| Majority | 1794 | 75.0 | |||
| Turnout | 2397 | 24.9 | |||
| Labour hold | Swing | ||||
Norwood
| Party | Candidate | Votes | % | ± | |
|---|---|---|---|---|---|
| Labour | Mhairi Doyle | 1779 | 49.0 | ||
| Liberal Democrat | Peter Blake | 1122 | 31.0 | ||
| Conservative | Michael Shaw | 506 | 14.0 | ||
| Green | David McIntosh | 122 | 3.0 | ||
| UKIP | Peter Gregson | 81 | 2.0 | ||
| Majority | 657 | 18.0 | |||
| Turnout | 3610 | 34.5 | |||
| Labour gain from Liberal Democrat | Swing | ||||
Park
| Party | Candidate | Votes | % | ± | |
|---|---|---|---|---|---|
| Labour | June Burns | 1611 | 51.0 | ||
| Independent | John Short | 744 | 24.0 | N/A | |
| Conservative | Kenneth Hughes | 534 | 17.0 | ||
| Liberal Democrat | Jen Robertson | 241 | 8.0 | ||
| Majority | 867 | 27.0 | |||
| Turnout | 3130 | 31.8 | |||
| Labour hold | Swing | ||||
Ravenmeols
| Party | Candidate | Votes | % | ± | |
|---|---|---|---|---|---|
| Labour | Nina Killen | 1551 | 41.0 | ||
| Formby Residents Action Group | Maria Bennett | 1288 | 34.0 | ||
| Conservative | Gemma Peace | 781 | 21 | ||
| Liberal Democrat | Mark Senior | 159 | 4.0 | N/A | |
| Majority | 263 | 7.0 | |||
| Turnout | 3779 | 39.1 | |||
| Labour gain from Formby Residents Action Group | Swing | ||||
St Oswald
| Party | Candidate | Votes | % | ± | |
|---|---|---|---|---|---|
| Labour | Carla Thomas | 1721 | 84.0 | ||
| Conservative | Peter Papworth | 218 | 11.0 | ||
| Socialist Labour | Kim Bryan | 119 | 6.0 | ||
| Majority | 1693 | 73.0 | |||
| Turnout | 2058 | 24.4 | |||
| Labour hold | Swing | ||||
Sudell
| Party | Candidate | Votes | % | ± | |
|---|---|---|---|---|---|
| Labour | Yvonne Sayers | 1645 | 53.0 | ||
| Independent | Michael O'Hanlon | 691 | 22.0 | N/A | |
| Conservative | Thomas Hughes | 488 | 16.0 | ||
| Liberal Democrat | Stuart Mason | 214 | 7.0 | ||
| Green | Marion Wykes | 70 | 2.0 | ||
| Majority | 954 | 31.0 | |||
| Turnout | 3450 | 34.7 | |||
| Labour hold | Swing | ||||
Victoria
| Party | Candidate | Votes | % | ± | |
|---|---|---|---|---|---|
| Labour | Janet Grace | 2369 | 65.0 | ||
| Liberal Democrat | Hannah Gee | 665 | 18.0 | ||
| Conservative | Paul Barber | 469 | 13.0 | ||
| Green | Andrew Donegan | 163 | 4.0 | ||
| Majority | 1704 | 47.0 | |||
| Turnout | 3799 | 37.5 | |||
| Labour hold | Swing | ||||
References
- ↑ "Sefton Borough Elections: Notice of Election - May 3, 2018". sefton.gov.uk. Sefton Metropolitan Borough Council. Retrieved 26 April 2018.
| Knowsley Metropolitan Borough Council | |
|---|---|
| Liverpool City Council |
|
| Mayor of Liverpool | |
| Liverpool School Board | |
| Sefton Metropolitan Borough Council | |
| St Helens Metropolitan Borough Council | |
| Wirral Metropolitan Borough Council | |
| Merseyside County Council |
|
| Liverpool City Region Mayor | |
| |
This article is issued from
Wikipedia.
The text is licensed under Creative Commons - Attribution - Sharealike.
Additional terms may apply for the media files.