List of countries by suicide rate
| Suicide |
|---|
 |
|
Related phenomena |
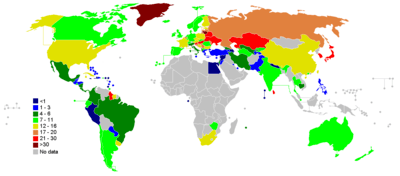
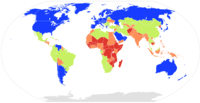
The following is a list of suicide rates by country according to data from the World Health Organization (WHO) and other sources.
A country's rank is determined by its age-adjusted total rate (per 100,000 population) of deaths officially recorded as suicides in the most recent available year. The WHO statistics are based on the official reports from each respective country, therefore no more accurate than the record-keeping in the specific country, and revisions (updates) are usually performed as well.[1]
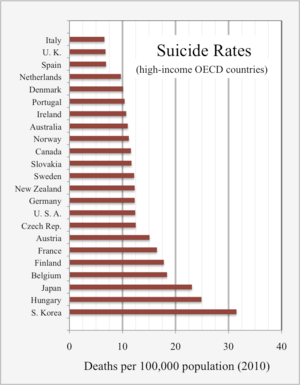
About one person in 5,000–15,000 dies by suicide every year (1.4% of all deaths), with reported world rate of 10.7 per 100,000 population in 2015 (was 11.6 in 2008). In Western countries male and female rates of suicidal behaviors differ at a greater degree compared to those in the rest of the world.[2][3][4] Around 30% of global suicides are due to pesticide self-poisoning, most of which occur in rural agricultural areas in low- and middle-income countries consisting in about 80% world population; some of them are forbidden by United Nations (UN) conventions.[5][6] In high-income countries consisting of the remaining 20% world population most common methods are firearms, hanging and other self-poisoning. Europe is the most suicidal region in the entire world, while the Eastern Mediterranean the least.[7][8]
A 2014 overview pointed at the economic crisis' years (2007-2008) as a period from which suicide rates surged globally. The study was about China's suicide rates which have been declining instead: in the 1990s China was among the countries with highest suicide rates in the world (above 20 per 100,000), but by the global economic crisis they kept dropping as significantly (as they were by the end of 1990s) with the main force having been migration from rural to urban areas.[9] The same years were also a turning point for reliability of data: before then, many countries had no official rates, particularly African countries (see map).
Per recent WHO releases, social stigma, the taboo to openly discuss suicide, and low availability of data lead to poor data quality for both suicide and suicide attempts: "given the sensitivity of suicide – and the illegality of suicidal behaviour in some countries – it is likely that under-reporting and misclassification are greater problems for suicide than for most other causes of death."[10][2]
In much of the world, suicide is stigmatized and condemned for religious or cultural reasons. In some countries, suicidal behaviour is a criminal offence punishable by law. Suicide is therefore often a secretive act surrounded by taboo, and may be unrecognized, misclassified or deliberately hidden in official records of death.[2]
— World Health Organization (2002)
List by the World Health Organization (2016)
Source: World Health Organization[note 1][note 2]
.svg.png)
The World Health Organization (WHO) divides the world into six WHO regions (more detailed sub-regional statistics are available at its official website). Incidence of suicide tends to be under-reported and misclassified due to both cultural and social pressures, and possibly completely unreported in some areas. Since data might be skewed, comparing suicide rates between nations can result in statistically unsound conclusions about suicidal behavior in different countries. Nevertheless the statistics are commonly used to directly influence decisions about public policy and public health strategies.[13]
| WHO region | Crude rateu | Age-standardized rate | Crude male rateu | Crude female rateu | Male–Female ratiou |
|---|---|---|---|---|---|
Southeast Asia | 13.2 | 13.40 | 14.8 | 11.6 | 1.28 |
Africa | 7.4 | 11.96 | 9.9 | 4.8 | 2.06 |
Europe[note 3] | 15.4 | 12.85 | 24.7 | 6.6 | 3.74 |
Western Pacific | 10.2 | 8.45 | 10.9 | 9.4 | 1.16 |
Americas | 9.8 | 9.25 | 15.1 | 4.6 | 3.28 |
Eastern Mediterranean | 3.9 | 4.30 | 5.1 | 2.7 | 1.89 |
| 10.6 | 10.53 | 13.5 | 7.7 | 1.75 |
Male and female suicide rates are out of total male population and total female population, respectively (i.e. total number of male suicides divided by total male population). Age-standardized rates account for the influence that different population age distributions might have on the analysis of crude death rates, statistically addressing the prevailing trends by age-groups and populations' structures, to enhance cross-national comparability: based on age-groups' deviation from standardized population structures, rates are rounded up or down (age-adjustment). If rounded down means the median life expectancy is higher than average, and viceversa when rounded up.
Though age-standardization is common statistical process to categorize mortality data for comparing purposes, this approach often results in rates differing from the official national statistics prepared and endorsed by individual countries, and crude rates are usually available as well. Age-adjusted rates are mortality rates that would have existed if all populations under study had the same age distribution as a "standard" population.
Most countries listed below report a higher male suicide rate, as on average there are about 3 male suicides out of 4, or a factor of 3-4:1 (for example,[15] in the United States was 3.36 in 2015, and 3.53 in 2016). This Male:Female ratio is based on the age-standardized rates (so when rounded up means women's life expectancy is likely greater than that of men's for that country, and viceversa if rounded down).
| Both sexes rank | Country | Both sexes | Male rank | Male | Female rank | Female |
|---|---|---|---|---|---|---|
| 1 | 30.2 | 3 | 46.6 | 5 | 14.2 | |
| 2 | 28.9 | 25 | 22.7 | 1 | 32.6 | |
| 3 | 26.5 | 1 | 48.3 | 31 | 7.5 | |
| 4 | 25.7 | 2 | 47.5 | 37 | 6.7 | |
| 5 | 23.2 | 6 | 36.1 | 13 | 10.9 | |
| 6 | 23.0 | 8 | 32.0 | 8 | 13.0 | |
| 7 | 22.8 | 4 | 40.1 | 28 | 7.7 | |
| 8 | 22.0 | 9 | 31.3 | 15 | 10.8 | |
| 9 | 21.4 | 5 | 39.3 | 45 | 6.2 | |
| 10 | 20.2 | 11 | 29.6 | 11 | 11.6 | |
| 11 | 20.0 | 37 | 21.2 | 2 | 18.7 | |
| 12 | 19.5 | 13 | 26.9 | 10 | 12.5 | |
| 13 | 19.1 | 12 | 29.1 | 12 | 11.1 | |
| 14 | 18.5 | 7 | 34.5 | 81 | 4.7 | |
| 15 | 17.3 | 56 | 17.5 | 3 | 17.1 | |
| 16 | 17.2 | 10 | 31.0 | 71 | 5.1 | |
| 17 | 16.7 | 17 | 25.4 | 17 | 9.6 | |
| 18 | 16.6 | 25 | 22.7 | 13 | 10.9 | |
| 19 | 16.5 | 46 | 18.5 | 4 | 14.5 | |
| 19 | 16.5 | 14 | 26.8 | 34 | 7.1 | |
| 21 | 16.1 | 50 | 18.2 | 5 | 14.2 | |
| 22 | 15.7 | 27 | 22.6 | 17 | 9.6 | |
| 22 | 15.7 | 31 | 22.2 | 19 | 9.4 | |
| 24 | 15.5 | 63 | 17.1 | 7 | 13.8 | |
| 25 | 15.2 | 15 | 25.9 | 63 | 5.4 | |
| 26 | 15.1 | 19 | 24.1 | 28 | 7.7 | |
| 27 | 15.0 | 24 | 23.1 | 28 | 7.7 | |
| 28 | 14.8 | 28 | 22.4 | 20 | 9.1 | |
| 29 | 14.4 | 16 | 25.6 | 89 | 4.4 | |
| 30 | 14.3 | 40 | 20.5 | 25 | 8.1 | |
| 31 | 14.2 | 22 | 23.3 | 45 | 6.2 | |
| 32 | 13.8 | 39 | 20.8 | 36 | 6.8 | |
| 32 | 13.8 | 28 | 22.4 | 53 | 6.1 | |
| 34 | 13.7 | 38 | 21.1 | 42 | 6.4 | |
| 35 | 13.6 | 31 | 22.2 | 45 | 6.2 | |
| 36 | 13.5 | 18 | 24.8 | 90 | 4.3 | |
| 37 | 13.4 | 87 | 13.8 | 8 | 13.0 | |
| 37 | 13.4 | 19 | 24.1 | 99 | 3.8 | |
| 37 | 13.4 | 21 | 23.9 | 115 | 3.4 | |
| 40 | 13.3 | 34 | 21.7 | 81 | 4.7 | |
| 40 | 13.3 | 28 | 22.4 | 88 | 4.5 | |
| 40 | 13.3 | 22 | 23.3 | 99 | 3.8 | |
| 43 | 12.9 | 64 | 16.9 | 21 | 8.9 | |
| 43 | 12.9 | 36 | 21.4 | 79 | 4.8 | |
| 43 | 12.9 | 33 | 21.9 | 90 | 4.3 | |
| 46 | 12.8 | 34 | 21.7 | 71 | 5.1 | |
| 47 | 12.2 | 48 | 18.3 | 42 | 6.4 | |
| 48 | 12.1 | 52 | 17.9 | 40 | 6.5 | |
| 49 | 11.9 | 43 | 19.2 | 74 | 5.0 | |
| 50 | 11.8 | 41 | 20.3 | 68 | 5.2 | |
| 51 | 11.7 | 69 | 15.8 | 32 | 7.4 | |
| 51 | 11.7 | 59 | 17.4 | 56 | 6.0 | |
| 53 | 11.6 | 87 | 13.8 | 21 | 8.9 | |
| 53 | 11.6 | 60 | 17.3 | 45 | 6.2 | |
| 53 | 11.6 | 51 | 18.0 | 56 | 6.0 | |
| 56 | 11.5 | 48 | 18.3 | 61 | 5.7 | |
| 56 | 11.5 | 44 | 18.8 | 71 | 5.1 | |
| 56 | 11.5 | 42 | 19.4 | 76 | 4.9 | |
| 59 | 11.4 | 56 | 17.5 | 61 | 5.7 | |
| 59 | 11.4 | 45 | 18.7 | 81 | 4.7 | |
| 61 | 11.3 | 69 | 15.8 | 35 | 6.9 | |
| 61 | 11.3 | 56 | 17.5 | 45 | 6.2 | |
| 61 | 11.3 | 67 | 16.2 | 45 | 6.2 | |
| 64 | 11.1 | 54 | 17.6 | 63 | 5.4 | |
| 65 | 11.0 | 64 | 16.9 | 56 | 6.0 | |
| 66 | 10.9 | 60 | 17.3 | 68 | 5.2 | |
| 66 | 10.9 | 54 | 17.6 | 94 | 4.2 | |
| 68 | 10.6 | 78 | 14.8 | 26 | 8.0 | |
| 69 | 10.5 | 100 | 12.7 | 23 | 8.4 | |
| 69 | 10.5 | 62 | 17.2 | 94 | 4.2 | |
| 69 | 10.5 | 52 | 17.9 | 118 | 3.2 | |
| 72 | 10.4 | 72 | 15.1 | 59 | 5.8 | |
| 72 | 10.4 | 73 | 15.0 | 59 | 5.8 | |
| 74 | 10.1 | 90 | 13.6 | 40 | 6.5 | |
| 74 | 10.1 | 66 | 16.4 | 96 | 4.1 | |
| 74 | 10.1 | 47 | 18.4 | 137 | 2.6 | |
| 77 | 10.0 | 98 | 12.8 | 33 | 7.3 | |
| 78 | 9.8 | 93 | 13.4 | 45 | 6.2 | |
| 79 | 9.7 | 73 | 15.0 | 76 | 4.9 | |
| 79 | 9.7 | 68 | 16.0 | 99 | 3.8 | |
| 81 | 9.6 | 112 | 11.4 | 26 | 8.0 | |
| 81 | 9.6 | 96 | 12.9 | 42 | 6.4 | |
| 81 | 9.6 | 81 | 14.3 | 63 | 5.4 | |
| 81 | 9.6 | 73 | 15.0 | 90 | 4.3 | |
| 81 | 9.5 | 80 | 14.5 | 85 | 4.6 | |
| 86 | 9.3 | 104 | 12.3 | 45 | 6.2 | |
| 86 | 9.3 | 96 | 12.9 | 53 | 6.1 | |
| 86 | 9.3 | 85 | 13.9 | 74 | 5.0 | |
| 89 | 9.2 | 94 | 13.2 | 68 | 5.2 | |
| 90 | 9.1 | 90 | 13.6 | 79 | 4.8 | |
| 90 | 9.1 | 78 | 14.8 | 105 | 3.7 | |
| 90 | 9.1 | 73 | 15.0 | 113 | 3.5 | |
| 93 | 9.0 | 109 | 11.5 | 37 | 6.7 | |
| 94 | 8.9 | 92 | 13.5 | 81 | 4.7 | |
| 94 | 8.9 | 83 | 14.0 | 85 | 4.6 | |
| 96 | 8.7 | 69 | 15.8 | 128 | 2.9 | |
| 97 | 8.6 | 82 | 14.3 | 99 | 3.8 | |
| 98 | 8.5 | 107 | 11.9 | 67 | 5.3 | |
| 99 | 8.4 | 83 | 14.0 | 96 | 4.1 | |
| 100 | 8.3 | 109 | 11.5 | 63 | 5.4 | |
| 100 | 8.3 | 73 | 15.0 | 152 | 2.1 | |
| 102 | 8.1 | 152 | 6.3 | 16 | 9.8 | |
| 103 | 8.0 | 143 | 7.9 | 24 | 8.3 | |
| 103 | 8.0 | 85 | 13.9 | 141 | 2.4 | |
| 105 | 7.9 | 114 | 11.1 | 76 | 4.9 | |
| 105 | 7.9 | 102 | 12.6 | 108 | 3.6 | |
| 105 | 7.9 | 95 | 13.1 | 118 | 3.2 | |
| 108 | 7.8 | 89 | 13.7 | 118 | 3.2 | |
| 109 | 7.6 | 107 | 11.9 | 113 | 3.5 | |
| 110 | 7.5 | 106 | 12.1 | 108 | 3.6 | |
| 110 | 7.5 | 98 | 12.8 | 143 | 2.3 | |
| 112 | 7.4 | 132 | 8.9 | 53 | 6.1 | |
| 112 | 7.4 | 121 | 10.3 | 85 | 4.6 | |
| 114 | 7.3 | 103 | 12.5 | 147 | 2.2 | |
| 114 | 7.3 | 100 | 12.7 | 152 | 2.1 | |
| 116 | 7.2 | 117 | 10.7 | 99 | 3.8 | |
| 116 | 7.2 | 115 | 11.0 | 105 | 3.7 | |
| 116 | 7.2 | 113 | 11.3 | 118 | 3.2 | |
| 119 | 7.0 | 123 | 10.2 | 99 | 3.8 | |
| 119 | 7.0 | 116 | 10.8 | 115 | 3.4 | |
| 119 | 7.0 | 109 | 11.5 | 130 | 2.8 | |
| 122 | 6.9 | 120 | 10.5 | 108 | 3.6 | |
| 123 | 6.7 | 104 | 12.3 | 160 | 1.9 | |
| 124 | 6.5 | 121 | 10.3 | 130 | 2.8 | |
| 125 | 6.4 | 130 | 9.0 | 105 | 3.7 | |
| 125 | 6.4 | 118 | 10.6 | 139 | 2.5 | |
| 125 | 6.4 | 118 | 10.6 | 152 | 2.1 | |
| 128 | 6.2 | 134 | 8.7 | 108 | 3.6 | |
| 128 | 6.2 | 126 | 9.7 | 127 | 3.0 | |
| 130 | 6.1 | 155 | 5.5 | 37 | 6.7 | |
| 130 | 6.1 | 139 | 8.3 | 96 | 4.1 | |
| 130 | 6.1 | 129 | 9.3 | 124 | 3.1 | |
| 130 | 6.1 | 126 | 9.7 | 130 | 2.8 | |
| 134 | 5.9 | 130 | 9.0 | 118 | 3.2 | |
| 134 | 5.9 | 137 | 8.5 | 118 | 3.2 | |
| 134 | 5.9 | 125 | 9.9 | 158 | 2.0 | |
| 137 | 5.8 | 147 | 7.3 | 173 | 1.1 | |
| 138 | 5.7 | 143 | 7.9 | 152 | 2.1 | |
| 138 | 5.7 | 124 | 10.1 | 158 | 2.0 | |
| 140 | 5.6 | 150 | 7.0 | 90 | 4.3 | |
| 140 | 5.6 | 126 | 9.7 | 152 | 2.1 | |
| 142 | 5.5 | 138 | 8.4 | 137 | 2.6 | |
| 142 | 5.5 | 133 | 8.8 | 139 | 2.5 | |
| 142 | 5.5 | 134 | 8.7 | 143 | 2.3 | |
| 145 | 5.4 | 142 | 8.1 | 134 | 2.7 | |
| 145 | 5.4 | 134 | 8.7 | 147 | 2.2 | |
| 147 | 5.2 | 140 | 8.2 | 141 | 2.4 | |
| 147 | 5.2 | 140 | 8.2 | 143 | 2.3 | |
| 149 | 5.1 | 145 | 7.6 | 134 | 2.7 | |
| 150 | 4.5 | 153 | 6.2 | 130 | 2.8 | |
| 150 | 4.5 | 148 | 7.2 | 160 | 1.9 | |
| 152 | 4.4 | 148 | 7.2 | 163 | 1.7 | |
| 152 | 4.4 | 145 | 7.6 | 171 | 1.2 | |
| 154 | 4.1 | 164 | 4.7 | 115 | 3.4 | |
| 155 | 4.0 | 161 | 4.9 | 124 | 3.1 | |
| 156 | 4.0 | 157 | 5.2 | 128 | 2.9 | |
| 158 | 3.8 | 154 | 6.1 | 170 | 1.5 | |
| 156 | 3.8 | 151 | 6.6 | 171 | 1.2 | |
| 159 | 3.7 | 164 | 4.7 | 134 | 2.7 | |
| 159 | 3.7 | 157 | 5.2 | 143 | 2.3 | |
| 159 | 3.7 | 157 | 5.2 | 147 | 2.2 | |
| 162 | 3.5 | 163 | 4.8 | 177 | 0.9 | |
| 163 | 3.4 | 156 | 5.3 | 163 | 1.7 | |
| 163 | 3.4 | 166 | 4.6 | 163 | 1.7 | |
| 165 | 3.3 | 161 | 4.9 | 162 | 1.8 | |
| 165 | 3.3 | 160 | 5.0 | 163 | 1.7 | |
| 167 | 3.2 | 167 | 4.4 | 147 | 2.2 | |
| 167 | 3.2 | 170 | 4.2 | 147 | 2.2 | |
| 169 | 3.1 | 179 | 2.5 | 108 | 3.6 | |
| 169 | 3.1 | 177 | 3.0 | 124 | 3.1 | |
| 169 | 3.1 | 170 | 4.2 | 152 | 2.1 | |
| 172 | 2.9 | 167 | 4.4 | 163 | 1.7 | |
| 173 | 2.7 | 174 | 3.6 | 169 | 1.6 | |
| 173 | 2.7 | 175 | 3.5 | 181 | 0.8 | |
| 175 | 2.6 | 169 | 4.3 | 175 | 1.0 | |
| 176 | 2.4 | 173 | 3.8 | 173 | 1.1 | |
| 176 | 2.4 | 172 | 3.9 | 177 | 0.9 | |
| 178 | 2.2 | 179 | 2.5 | 163 | 1.7 | |
| 179 | 2.0 | 176 | 3.2 | 177 | 0.9 | |
| 180 | 1.7 | 181 | 2.1 | 175 | 1.0 | |
| 181 | 1.6 | 178 | 2.8 | 182 | 0.5 | |
| 182 | 0.5 | 183 | 0.0 | 177 | 0.9 | |
| 183 | 0.4 | 182 | 0.8 | 183 | 0.3 |
- ^u Data was recently updated (April 2018).
- ^b Suicide attempts are illegal in this country, and punishable by imprisonment or other penalties. This might be the reason for the low suicide rate in these countries. See also Suicide legislation.
List by other sources and years (1985–2017)
| Rank | Regions | Male | Female | Average | Year |
|---|---|---|---|---|---|
| 1 | 116.9 | 45.0 | 83.0 (0.0830%) | 2011 | |
| 2 | 65.1 | 12.4 | 36.7 (0.0367%) | 2013 | |
| 3 | 39.0 | 13.4 | 26.4 (0.0264%) | 2006 | |
| 4 | 36.2 | 15.0 | 25.6 (0.0256%) | 2016 | |
| 5 | 43.0 | 9.4 | 25.6 (0.0256%) | 2008 | |
| 6 | 34.6 | 9.4 | 21.8 (0.0218%) | 2011 | |
| 7 | 34.8 | 9.24 | 21.3 (0.0213%) | 2011 | |
| 8 | 21.1 (0.0211%) | 2013 | |||
| 9 | 19.8 (0.0198%) | 2012 | |||
| 10 | 19.0 (0.0190%) | 2013 | |||
| 11 | 20.5 (0.0205%) | 2017 | |||
| 12 | 17.6 (0.0176%) | 2008 | |||
| 13 | 24.9 | 9.0 | 17.3 (0.0173%) | 2011 | |
| 14 | 17.0 (0.0170%) | 2009 | |||
| 15 | 23.4 | 10.2 | 16.8 (0.0168%) | 2017 | |
| 17 | 16.5 (0.0165%) | 2012 | |||
| 18 | 16.3 (0.0163%) | 2013 | |||
| 19 | 16.2 (0.0162%) | 2011 | |||
| 20 | 23.8 | 7.1 | 15.45 (0.01545%) | 2009 | |
| 21 | 15.4 (0.0154%) | 2005 | |||
| 22 | 20.5 | 9.7 | 15.1 (0.0151%) | 2011 | |
| 23 | 27.3 | 4.5 | 14.8 (0.0148%) | 2010 | |
| 24 | 22.8 | 7.4 | 14.7 (0.0147%) | 2010 | |
| 25 | 23.9 | 4.8 | 14.4 (0.0144%) | 2005 | |
| 22.3 | 6.9 | 14.4 (0.0144%) | 2014 | ||
| – | 23.1 | 5.8 | 14.2 (0.0142%) | 2008 | |
| 28 | 21.8 | 6.0 | 13.9 (0.0126%) | 2016 | |
| 29 | 13.8 (0.0138%) | 2017 | |||
| 30 | 13.7 (0.0137%) | 2017 | |||
| 31 | 13.6 (0.0136%) | 2012 | |||
| 32 | 12.8 (0.0128%) | 2010 | |||
| 33 | 18.9 | 6.4 | 12.5 (0.0125%) | 2013 | |
| 34 | 19.0 | 5.5 | 12.3 (0.0123%) | 2008 | |
| 18.8 | 6.2 | 12.3 (0.0123%) | 2008 | ||
| 19.0 | 5.8 | 12.3 (0.0123%) | 2014–15 | ||
| 16.2 | 8.8 | 12.3 (0.0123%) | 2011 | ||
| 38 | 17.3 | 6.9 | 12.0 (0.0120%) | 2012 | |
| 20 | 4.0 | 12.0 (0.0120%) | 2015 | ||
| 40 | 20.8 | 3.7 | 11.9 (0.0119%) | 2009 | |
| 14.0 | 5.0 | 11.9 (0.0119%) | 2012 | ||
| 42 | 18.2 | 5.1 | 11.8 (0.0118%) | 2011 | |
| 43 | 16.9 | 5.3 | 11.5 (0.0115%) | 2009 | |
| 44 | 18.3 | 4.6 | 11.3 (0.0113%) | 2009 | |
| 45 | 18.2 | 4.2 | 11.2 (0.0112%) | 2007 | |
| 46 | 17 | 5.8 | 11.2 (0.0112%) | 2011 | |
| 47 | 18.0 | 6.0 | 12.0 (0.0012%) | 2015 | |
| 48 | 17.9 | 3.8 | 10.7 (0.0107%) | 2006 | |
| 49 | 13.0 | 7.8 | 10.5 (0.0105%) | 2009 | |
| 50 | 17.4 | 3.4 | 10.3 (0.0103%) | 2013 | |
| 13.3 | 7.3 | 10.3 (0.0103%) | 2012 | ||
| 52 | 12.0 (0.012%) | 2014 | |||
| 53 | 17.4 | 2.8 | 9.9 (0.0099%) | 2011 | |
| 54 | 9.8 (0.0098%) | 2014 | |||
| 55 | 14.1 | 3.6 | 8.8 (0.0088%) | 2009 | |
| 56 | 13.8 | 3.5 | 8.6 (0.0086%) | 1998 | |
| 57 | 12.7 | 4.1 | 8.3 (0.0083%) | 2013 | |
| 58 | 12.6 | 3.9 | 8.0 (0.008%) | 2009 | |
| 12.9 | 3.6 | 8.0 (0.008%) | 2008 | ||
| 59 | 12.7 | 3.8 | 8.0 (0.0080%) | 2016 | |
| 60 | 10.6 | 5.2 | 7.9 (0.0079%) | 1990 | |
| 61 | 13.2 | 2.9 | 7.8 (0.0078%) | 2008 | |
| 62 | 12.6 | 3.0 | 7.7 (0.0077%) | 2008 | |
| 63 | 10.5 | 3.6 | 7.1 (0.0071%) | 2009 | |
| 64 | 11.8 | 1.9 | 6.8 (0.0068%) | 2008 | |
| 65 | 10.2 | 1.9 | 6.1 (0.0061%) | 2009 | |
| 66 | 9.7 | 2.58 | 6.03 (0.0613%) | 2013 | |
| 67 | 8.6 | 3.1 | 5.85 (0.0058%) | 2011 | |
| 68 | 9.9 | 2.1 | 5.8 (0.0058%) | 2007 | |
| 9.0 | 2.6 | 5.8 (0.0058%) | 2006 | ||
| 70 | 9.0 | 1.9 | 5.5 (0.0055%) | 2008 | |
| 71 | 7.9 | 2.0 | 4.9 (0.0049%) | 2007 | |
| 72 | 7.7 | 2.0 | 4.8 (0.0048%) | 2008 | |
| 3.9 | 2.1 | 4.8 (0.0048%) | 2013 | ||
| 74 | 7.0 | 2.3 | 4.7 (0.0047%) | 2005 | |
| 75 | 4.6 (0.0046%) | 2008 | |||
| 76 | 7.1 | 1.7 | 4.3 (0.0043%) | 2009 | |
| 77 | 4.19 (0.00419%) | 2013 | |||
| 78 | 4.7 | 3.3 | 4.0 (0.004%) | 2003 | |
| 6.8 | 1.3 | 4.0 (0.004%) | 2008 | ||
| 80 | 3.84 (0.00384%) | 2011 | |||
| 81 | 4.0 | 3.5 | 3.8 (0.0038%) | 2006 | |
| 82 | 6.6 | 0.7 | 3.7 (0.0037%) | 2008 | |
| 5.4 | 1.9 | 3.7 (0.0037%) | 2008 | ||
| 84 | 5.1 | 2.0 | 3.6 (0.0036%) | 2008 | |
| 5.9 | 1.3 | 3.6 (0.0036%) | 2009 | ||
| 5.6 | 1.7 | 3.6 (0.0036%) | 2008 | ||
| 87 | 7.3 | 0.0 | 3.5 (0.0035%) | 2006 | |
| 6.1 | 1.0 | 3.5 (0.0035%) | 2009 | ||
| 89 | 5.9 | 1.0 | 3.4 (0.0034%) | 2008 | |
| 90 | 5.3 | 1.2 | 3.2 (0.0032%) | 2007 | |
| 91 | 4.5 | 1.0 | 2.75 (0.00275%) | 2005 | |
| 92 | 2.9 | 2.3 | 2.6 (0.0026%) | 2001 | |
| 93 | 4.9 | 0.0 | 2.4 (0.0024%) | 2005 | |
| 94 | 3.9 | 0.7 | 2.3 (0.0023%) | 2005 | |
| 95 | 2.8 | 1.1 | 1.9 (0.0019%) | 2008 | |
| 96 | 1.9 | 1.7 | 1.8 (0.0018%) | 2009 | |
| 97 | 1.9 | 0.6 | 1.2 (0.0012%) | 2005 | |
| 98 | 1.45 | 0.71 | 1.10 (0.0011%) | 2012 | |
| 99 | 1.1 | 0.6 | 0.9 (0.0009%) | 2000 | |
| 0.0 | 1.8 | 0.9 (0.0009%) | 1987 | ||
| 101 | 1.0 | 0.3 | 0.6 (0.0006%) | 2007 | |
| 102 | 0.7 | 0.0 | 0.3 (0.0003%) | 2005 | |
| 103 | 0.3 | 0.0 | 0.1 (0.0001%) | 1990 | |
| 0.2 | 0.0 | 0.1 (0.0001%) | 1985 | ||
| 0.2 | 0.0 | 0.1 (0.0001%) | 2008 | ||
| 0.1 | 0.0 | 0.1 (0.0001%) | 2009 | ||
| 107 | 0.0 | 0.0 | 0.0 (0%) | 2008 | |
| 0.0 | 0.0 | 0.0 (0%) | 1995 | ||
| 0.0 | 0.0 | 0.0 (0%) | 1995 | ||
| 0.0 | 0.0 | 0.0 (0%) | 2003 | ||
| 0.0 | 0.0 | 0.0 (0%) | 2003 |
| Income group (% of global pop) | Suicides, 2012 (in thousands) | Global % | Rate (2012) | Male:Female (2012) |
|---|---|---|---|---|
| High-income countries (18.3%) | 197 | 24.5% | 12.7 | 3.5 : 1 |
| Upper-middle-income countries (34.3%) | 192 | 23.8% | 7.5 | 1.3 : 1 |
| Lower-middle-income countries (35.4%) | 333 | 41.4% | 14.1 | 1.7 : 1 |
| Low-income countries (12.0%) | 82 | 10.2% | 13.4 | 1.7 : 1 |
| Global (100.0%) | 804 | 100.0% | 11.4 | 1.9 : 1 |
See also
Notes
- ↑ Data updated in April 2017. Since April 2018, a revision for 2015 rates is available at World Health Organization's website, including year 2016 rates.[11]
- ↑ To proportion and compare the prevalence of suicide for different countries, WHO adjusts for age (age-standardization) every country's crude mortality rate based on demographic parameters and general mortality data (life expectancy) including other relevant statistical data such as median population ages, sex ratios and age distribution (i.e. age-groups), enhancing cross-national comparability. Another way to think of it, is that since populations age structures are often very different, but the likelihood of dying by suicide is generally increased with age, in order to avoid masking the sensible differences given by each country's age distributions, countries' rates are reciprocally weighted into the overall trend to globally frame national suicide rates, and the epidemiological prevalence of suicide. Age-standardization works over time as a measure of the prevalence of suicide across diversely populated countries, by rounding down when populations are composed of a higher percentage of older people compared to the "standard" population, and viceversa.
- ↑ Europe is the most suicidal region of the world according to crude rates.[8][7]
- ↑ Recently released figures by official Belgian authorities suggest a considerably higher rate of 17.0 persons (total) per 100,000 people per annum in 2009 (5,712 cases in a population of 10,749,000 (=10,666,866 as of 1 January 2008 increasing by 0,77% per annum.) as of 1 January 2009)."Toenemend aantal zelfdodingen in Belgie" (in Dutch). 2011. Archived from the original on 2012-12-05.
- ↑ The number of death in Belgium in 2008 due to suicide "zichzelf schade toebrengen" was reported at 2000 out of a total of 103.760 death. These death comprise 1453 men and 547 women. This puts the suicide rate at about 19 per 100.000. See statbel: http://statbel.fgov.be/nl/binaries/NL%20-%20Tableau%201%2E3_T_2008_tcm325-168456.pdf Archived 28 September 2013 at the Wayback Machine.
- ↑ These indicated rates refer to aged 15 and over.
- The updated figure of suicide rates in Belgium for 2011 is 2,084 on a total population of 10,933,607, equivalent to 18.96 per 100,000 inhabitants (source: Het Nieuwsblad, 10 April 2014).
References
- ↑ "Suicide rates, age standardized - Data by country". World Health Organization (archived on 17 Jan 2018). 2015. Archived from the original on 17 January 2018. Retrieved 13 April 2017.
- 1 2 3 WHO (2002). "Self-directed violence" (PDF). www.who.int.
- ↑ John R. Cutcliffe (Editor), José Santos (Editor), Paul S. Links (Editor), Juveria Zaheer (Editor) (2016). "Routledge International Handbook of Clinical Suicide Research". Routledge.
- ↑ Jodi O'Brien (Editor) (2009). "Encyclopedia of Gender and Society (p. 817)". SAGE Publications.
- ↑ "Restrict pesticides to reduce suicides: WHO". World Health Organization. August 2017. Retrieved 23 September 2017.
- ↑ "Press Conference by World Health Organization on Suicide Prevention" (Press Conference). United Nations Department of Public Information. 8 September 2006. Retrieved 11 June 2012.
- 1 2 "2015 Suicide rates per (100 000 population) Crude rates Data by WHO region". WHO. Retrieved 26 March 2018.
- 1 2 "Suicide rate is highest in Europe: UN health agency report". euronews. 18 May 2017.
- ↑ "Back from the edge - A dramatic decline in suicides". economist.com. 28 June 2014.
- ↑ "Suicide - Challenges and obstacles". who.int. August 2017.
- 1 2 "Suicide rates, crude - Data by WHO region, 2015 (updated April 2018)". WHO. 2018-04-17.
- ↑ "Suicide rates, crude - Data by country, 2015". WHO (archived on 19 Apr 2017). 2017-04-04. Archived from the original on 2017-04-19. Retrieved 30 May 2018.
- ↑ Elizabeth Scowcroft (February 2012). "Suicide Statistics Report 2012" (PDF). www.samaritans.org. Samaritans.
- ↑ "Suicide rates, age standardized - Data by WHO Region". WHO (archived on 17 Jan 2018). 2015. Archived from the original on 17 January 2018. Retrieved 13 April 2017.
- ↑ "Suicide Statistics — AFSP". American Foundation for Suicide Prevention.
- ↑ "Suicide rates Data by country". World Health Organization. 2016. Retrieved 23 September 2018.
- 1 2 3 Värnik, P. (2012). "Suicide in the World". International Journal of Environmental Research and Public Health. 9 (12): 760–71. doi:10.3390/ijerph9030760. PMC 3367275. PMID 22690161.
- ↑ Unless otherwise stated all statistics are from WHO: "Suicide rates per 100,000 by country, year and sex (Table)". World Health Organization. 2011. Archived from the original on 22 January 2012. Retrieved 2012-01-26.
- ↑ "The Suicide Capital of the World". Retrieved 13 March 2013.
- ↑ "Rising suicide rate baffles Greenland". Retrieved 13 March 2013.
- ↑ "StatBank Greenland - Suicide by methode, place, age, time and sex [SUELDM2]".
- ↑ "Savižudybių statistika;". Valstybinis psichikos sveikatos centras. Retrieved 2013-09-09.
- ↑ "2016년 사망원인 통계" (in Korean). 통계청. 2016. Retrieved 2017-09-22.
- ↑ Unless otherwise stated all statistics are from WHO: "Suicide rates per 100,000 by country, year and sex (Table)". Statistični urad Republike Slovenije. 2011. Archived from the original on 22 January 2012. Retrieved 2012-01-26.
- ↑ De Silva, Varuni; Hanwella, Raveen; Senanayake, Madhri (December 2012). "Age and sex specific suicide rates in Sri Lanka from 1995-2011". Sri Lanka Journal of Psychiatry. 3 (2): 7. doi:10.4038/sljpsyc.v3i2.5131.
- ↑ "KSH Stadat database, causes of death (1949-2013)" (in Hungarian). Hungarian Central Statistical Office (KSH). Retrieved 2014-10-31.
- ↑ Хаустова О. О. Самогубства та побутова смертність в Україні: підсумки 2012 року // Український вісник психоневрології. — 2013. — В. 4 (77). — Т. 21. — С. 12-18.
- ↑ http://www.spkc.gov.lv/file_download/2097/2_Mirstiba_2013.pdf%5Bpermanent+dead+link%5D
- ↑ "National Statistical Committee of the Republic of Belarus (for 2017);" (PDF) (in Russian). Belstat. Archived from the original (PDF) on 14 May 2018. Retrieved 2018-05-14.
- ↑ "Report of Statistical Office of the Republic of Serbia". Retrieved 2013-05-27.
- ↑ "Eurostat - Tables, Graphs and Maps Interface (TGM) table". Retrieved 25 May 2016.
- 1 2 3 4 5 6 7 "Death Due To Suicide". Eurostat. European Commission. 2009. Retrieved 2010-01-10.
- ↑ "Number of Suicides in Japan Declines for Eighth Consecutive Year".
- ↑ "Grave preocupación por tasa en alza de 16,5 suicidios cada 100.000 habitantes" (in Spanish). Uruguay. 18 July 2013. Retrieved 2016-02-12.
- ↑ "Odsjek za mentalne poremećaje s registrom za psihoze i registrom izvršenih samoubojstava" (in Croatian). HZJZ. Archived from the original on 28 March 2016.
- ↑ "World Suicide Death Rate Rankings (WHO)" (PDF). 2011-12-16.
- ↑ Burrows, Stephanie; Laflamme, Lucie (February 2006). "Suicide Mortality in South Africa". Social Psychiatry and Psychiatric Epidemiology. 41 (2): 108–114. doi:10.1007/s00127-005-0004-4. . Note: This data is for urban areas only. The data available for the whole of South Africa in 2007 are: men 1.4, women 0.4, total 0.9 (source: WHO)
- ↑ "Causes of death, Department of Health, Taiwan" (XLS). Retrieved 2013-05-20.
- 1 2 "Archived copy". Archived from the original on 14 November 2012. Retrieved 26 April 2013.
- ↑ "Number of suicides 1921-2014, Statistics Finland". 2015-12-30.
- ↑ Värnik, P (2012-03-02). "Suicide in the World- Table 2 - Suicide by gender and age groups in WHO regions, estimates for 2008". Int J Environ Res Public Health. 9 (3): 760–71. doi:10.3390/ijerph9030760. PMC 3367275. PMID 22690161.
- ↑ "Deaths: Final Data for 2016". CDC. Retrieved 26 July 2018.
- ↑ "INFORMATION ABOUT THE MORTALITY OF THE POPULATION FOR THE CAUSES OF DEATH FOR THE RUSSIAN FEDERATION - January - December 2017" (in Russian). Rosstat. Retrieved 2018-01-29.
- ↑ SRNA (2012-04-16). "BiH: Prošle godine ubilo se 507 lica, od čega 16 maloletnika". SRNA. Archived from the original on 2013-09-27. Retrieved 4 December 2012.
- ↑ "Health - Causes of Death in Germany" (PDF) (in German). 2013.
- ↑ "NZ suicide rates rise for first time in four years". New Zealand Herald. 2015-10-06. ISSN 1170-0777. Retrieved 2015-10-06.
- ↑ "Chief Coroner releases provisional annual suicide figures for the 2014/15 year". Coronial Services of New Zealand. 2015-10-06. Retrieved 2016-02-12.
- ↑ "Centre for Suicide Research and Prevention". Hong Kong. 2013.
- ↑ "Dödsorsaker 2012" [Causes of Death 2012] (PDF). www.socialstyrelsen.se - 2013-8-6.pdf (in Swedish and English). Statistics Sweden. 2013.
- ↑ Sociedade Portuguesa de Suicidologia. "Estatística - Sociedade Portuguesa de Suicidologia". Retrieved 25 May 2016.
- ↑ "UK suicide rate rises 'significantly' in 2011". BBC News. 22 January 2013.
- ↑ "Suicides and suicide rate, by sex and by age group, Canada".
- ↑ "36 died from own hand". Hagstofa Íslands/Statistical Bureau of Iceland. Morgunblaðið. 2010. Retrieved 2010-09-21.
- ↑ statistique, Office fédéral de la. "Développement durable". www.bfs.admin.ch. Archived from the original on 4 March 2016. Retrieved 15 October 2014.
- ↑ Central Statistics Office. "Vital Statistics - Fourth Quarter and Yearly Summary - 2013" (PDF).
- ↑ Samaritians of Singapore. "Suicide Statistics in Singapore" (PDF). Archived from the original (PDF) on 29 October 2013.
- ↑ Statistics, c=AU; o=Commonwealth of Australia; ou=Australian Bureau of. "Attachment Not Found". abs.gov.au.
- ↑ "Back from the edge - The first of two articles on China's suicide rate looks at the effect of urbanisation". The Economist. June 28, 2014.
- ↑ "Suicides and suicide rate, by sex and by age group, Spain". June 27, 2015.
- ↑ "Suicide Rates: Thailand". Archived from the original on 6 March 2016.
- ↑ "Suicide in Israel - 1981-2009 Suicides, Suicide Attempts 2004-2010" (PDF) (in IW). Retrieved 2013-09-09.
- ↑ "Iranian Legal Medicine Organization". 2013. Archived from the original on 12 January 2014. Retrieved 12 January 2014. www.lmo.ir
- ↑ "Tehran has the highest rate of suicide in Iran" (in Persian). Bahar Newspaper. 2013. Archived from the original on 20 September 2013. via Google Translate
- ↑ "TÜİK İntihar İstatistikleri". www.tuik.gov.tr.
- ↑ "WHO | Suicide rates per 100,000 by country, year and sex (Table)". Who.int. 2009-12-07. Archived from the original on 27 September 2010. Retrieved 2010-09-30.
- ↑ "Mortalidad y otros (Mortality and others)" (PDF). IUDPAS. 1 March 2011. Archived from the original (PDF) on 28 September 2013. Retrieved 22 January 2013.
- ↑ Chief, Barbara Mae Dacanay, Bureau (17 July 2012). "Suicide rate has steadily risen in Philippines for 21 years — report".
- ↑ Based on a population of 180.4 million in 2012 (Population Reference Bureau), a sex ratio of 1.06 males/female (CIA World Factbook, 2013) and figures from 'State of Human Rights in 2012' by the Human Rights Commission of Pakistan: 1,976 persons committed suicide in 2012 across the country of which 626 were women.
- ↑ "Suicide rates (per 100,000), by gender, Jordan, 1965-2008" (PDF). World Health Organization.
- ↑ World Health Organization (2014). "Preventing suicide - A global imperative" (PDF). www.who.int.
- ↑ Grinshteyn, Erin; Hemenway, David (March 2016). "Violent Death Rates: The US Compared with Other High-income OECD Countries, 2010". The American Journal of Medicine. 129 (3): 266–273. doi:10.1016/j.amjmed.2015.10.025. (Table 4). (PDF).
External links
- Suicide rates by country, 1950-2011 published by the World Health Organization (WHO).
- Top Ten Most Suicidal Countries published by International Business Times
- SA has the eighth-highest suicide rate in the world, psychiatric illnesses are on the rise and stress has become normalised published by Mail & Guardian
| Suicide crisis | | |
|---|---|---|
| Social aspects | ||
| Suicide types | ||
| Epidemiology | ||
| History | ||
| Related | ||
| By country | ||