List of European countries by life expectancy
Map
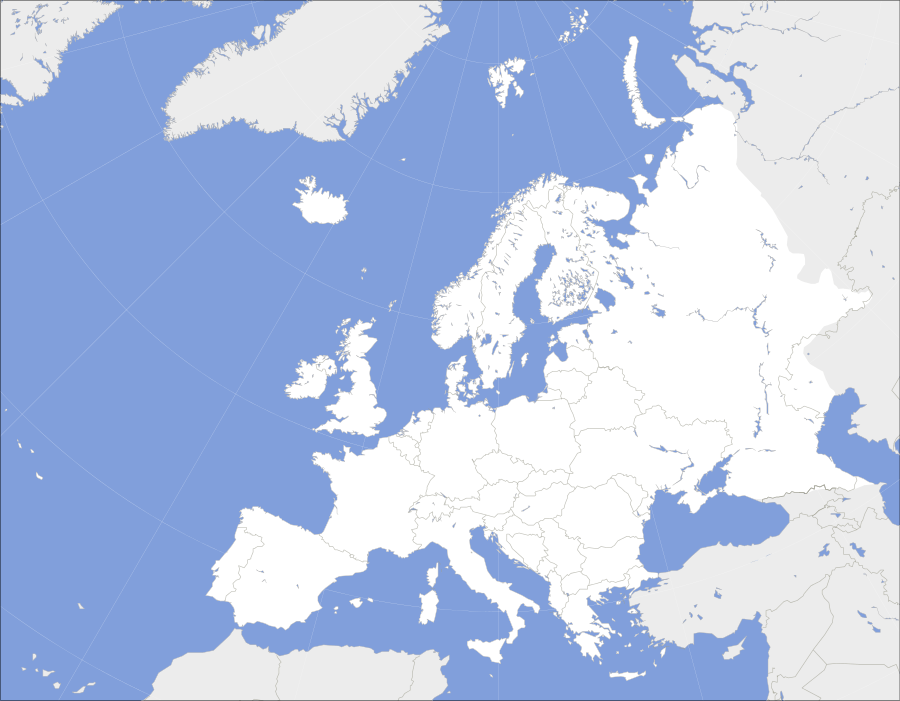
The map and table below cites life expectancy per country from The World Bank's 2015 statistics.[1] Hotter colours indicate lower life expectancy, colder colours indicate high life expectancy.
Life expectancy by Country
| Country | Life expectancy |
|---|---|
| 72 | |
| 82 | |
| 74 | |
| 81 | |
| 77 | |
| 75 | |
| 77 | |
| 80 | |
| 79 | |
| 81 | |
| 77 | |
| 81 | |
| 83 | |
| 81 | |
| 82 | |
| 76 | |
| 83 | |
| 82 | |
| 83 | |
| 72 | |
| 74 | |
| 82 | |
| 75 | |
| 82 | |
| 76 | |
| 82 | |
| 71 | |
| 77 | |
| 82 | |
| 82 | |
| 78 | |
| 82 | |
| 75 | |
| 71 | |
| 75 | |
| 77 | |
| 81 | |
| 83 | |
| 83 | |
| 83 | |
| 75 | |
| 71 | |
| 82 | |
See also
Plotted maps
- European countries by electricity consumption per person
- European countries by employment in agriculture (% of employed)
- European countries by fossil fuel use (% of total energy)
- European countries by health expense per person
- European countries by military expenditure as a percentage of government expenditure
- European countries by percent of population aged 0-14
- European countries by percentage of urban population
- European countries by percentage of women in national parliaments
- List of European countries by number of Internet users
- International organisations in Europe
- List of European countries by budget revenues
- List of European countries by budget revenues per capita
- List of European countries by GDP (nominal) per capita
- List of European countries by GDP (PPP) per capita
- List of European countries by GNI (nominal) per capita
- List of European countries by GNI (PPP) per capita
- List of countries by GDP (nominal) per capita
- List of countries by GDP (PPP) per capita
- List of countries by GDP (nominal)
- List of countries by GDP (PPP)
References
- ↑ "Life expectancy at birth, total (years)". WORLDBANK.org. The World Bank. Retrieved 10 August 2015.
This article is issued from
Wikipedia.
The text is licensed under Creative Commons - Attribution - Sharealike.
Additional terms may apply for the media files.