List of African countries by population
This is a list of African countries and dependent territories sorted by population, which is sorted by the 2015 mid-year normalized demographic projections.
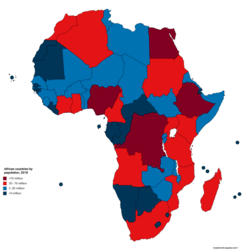
African countries by population, 2018
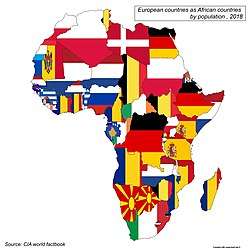
European countries as African countries by population
Table
| Rank | Country (or dependent territory) |
July 1, 2015 projection[1] |
% of pop. |
Average relative annual growth (%)[2] |
Average absolute annual growth [3] |
Estimated doubling time (Years)[4] |
Official figure (where available) |
Date of last figure |
Source |
|---|---|---|---|---|---|---|---|---|---|
| 1 | 181,563,000 | 15.98 | 2.91 | 4,731,000 | 24 | 173,000,000 | 2013 | Official estimate | |
| 2 | 103,764,000 | 7.81 | 2.41 | 2,424,000 | 29 | 99,391,000 | 2015 | Official estimate | |
| 3 | 89,125,000 | 7.68 | 2.29 | 2,028,000 | 31 | 94,408,000 | October 12, 2018 | Official population clock | |
| 4 | 77,267,000 | 6.70 | 3.13 | 2,390,000 | 22 | 86,026,000 | July 1, 2015 | Official estimate | |
| 5 | 54,957,000 | 4.77 | 1.61 | 873,000 | 43 | 54,956,900 | July 1, 2015 | Official estimate | |
| 6 | 51,046,000 | 4.23 | 2.97 | 1,414,000 | 24 | 51,046,000 | 2015 | Official estimate | |
| 7 | 45,533,000 | 3.84 | 2.87 | 1,196,000 | 24 | 45,533,000 | 2015 | Official estimate | |
| 8 | 40,235,000 | 3.33 | 3.07 | 912,000 | 23 | 40,235,000 | 2015 | Official estimate | |
| 9 | 39,670,000 | 3.46 | 2.07 | 768,000 | 34 | 40,100,000 | January 1, 2016 | Official estimate | |
| 10 | 37,102,000 | 3.10 | 3.09 | 1,201,000 | 23 | 34,856,813 | August 28, 2014 | Preliminary 2014 census result | |
| 11 | 34,380,000 | 3.33 | 1.24 | 412,000 | 56 | 33,337,529 | September 1, 2014 | Preliminary 2014 census result | |
| 12 | 28,013,000 | 2.23 | 2.74 | 702,000 | 26 | 28,013,000 | 2015 | Official estimate | |
| 13 | 27,414,000 | 2.40 | 2.48 | 621,000 | 28 | 27,043,093 | 2014 | Official estimate | |
| 14 | 25,326,000 | 2.20 | 3.43 | 839,000 | 21 | 24,383,301 | May 16, 2014 | Preliminary 2014 census result | |
| 15 | 23,126,000 | 2.02 | 2.55 | 451,000 | 27 | 22,671,331 | May 15, 2014 | Preliminary 2014 census result | |
| 16 | 23,043,000 | 2.00 | 2.71 | 609,000 | 26 | 22,434,363 | 2014 | Official estimate | |
| 17 | 21,918,000 | 1.90 | 2.65 | 565,000 | 27 | 21,917,602 | 2015 | Official estimate | |
| 18 | 18,880,000 | 1.64 | 3.86 | 701,000 | 18 | 17,138,707 | December 10, 2012 | Final 2012 census result | |
| 19 | 18,450,000 | 1.60 | 3.26 | 582,000 | 22 | 18,450,494 | 2015 | Official estimate | |
| 20 | 17,796,000 | 1.54 | 3.30 | 568,000 | 21 | 14,528,662 | April 1, 2009 | Final 2009 census result | |
| 21 | 16,307,000 | 1.41 | 3.18 | 502,000 | 22 | 16,832,900 | July 1, 2016 | Official estimate | |
| 22 | 15,474,000 | 1.34 | 3.00 | 451,000 | 23 | 15,473,905 | 2015 | Official estimate | |
| 23 | 14,317,996 | 0.95 | 1.54 | 166,000 | 45 | 12,316,895 | January 1, 2016 | Official estimate | |
| 24 | 14,150,000 | 1.23 | 2.92 | 401,000 | 24 | 14,354,690 | 2015 | Official estimate | |
| 25 | 13,675,000 | 1.19 | 3.57 | 471,000 | 20 | 11,039,873 | May 20, 2009 | Final 2009 census result | |
| 26 | 13,503,000 | 1.17 | 1.17 | 156,000 | 60 | 13,061,239 | August 17, 2012 | Final 2012 census result | |
| 27 | 12,519,000 | 1.09 | 5.95 | 703,000 | 12 | 8,260,490 | April 22, 2008 | 2008 census result | |
| 28 | 11,324,000 | 0.98 | 2.61 | 288,000 | 27 | 10,515,973 | August 15, 2012 | Final 2012 census result | |
| 29 | 11,118,000 | 0.96 | 1.04 | 114,000 | 67 | 10,982,754 | April 23, 2014 | Preliminary 2014 census result | |
| 30 | 10,935,000 | 0.95 | 2.30 | 246,000 | 30 | 10,628,972 | April 2, 2014 | Preliminary 2014 census result | |
| 31 | 10,782,000 | 0.93 | 3.54 | 369,000 | 20 | 10,008,749 | May 11, 2013 | Final 2013 census result | |
| 32 | 9,824,000 | 0.85 | 2.93 | 280,000 | 24 | 9,823,828 | 2015 | Official estimate | |
| 33 | 7,065,000 | 0.61 | 2.87 | 197,000 | 25 | 6,191,155 | November 6, 2010 | Final 2010 census result | |
| 34 | 6,895,000 | 0.60 | 5.49 | 359,000 | 13 | 6,536,000 | July 1, 2014 | Official estimate | |
| 35 | 6,513,000 | 0.56 | 2.57 | 163,000 | 27 | 6,348,350 | 2014 | Official estimate | |
| 36 | 6,278,000 | 0.54 | 1.13 | 70,000 | 62 | 5,298,152 | April 15, 2006 | 2006 census result | |
| 37 | 4,706,000 | 0.41 | 2.98 | 136,000 | 24 | 3,697,490 | April 28, 2007 | 2007 census result | |
| 38 | 4,659,080 | 0.42 | 2.00 | 96,000 | 35 | 3,859,139 | 2017 | ||
| 39 | 4,046,000 | 0.35 | 2.09 | 83,000 | 33 | 3,476,608 | March 21, 2008 | Final 2008 census result | |
| 40 | 3,632,000 | 0.31 | 2.43 | 86,000 | 29 | 3,718,678 | 2016 | Official estimate | |
| 41 | 2,281,000 | 0.20 | 2.01 | 45,000 | 35 | 2,280,700 | July 1, 2015 | Official estimate | |
| 42 | 2,176,000 | 0.19 | 1.92 | 41,000 | 36 | 2,024,904 | August 22, 2011 | Final 2011 census result | |
| 43 | 2,022,000 | 0.18 | 3.27 | 64,000 | 22 | 1,882,450 | April 15, 2013 | Preliminary 2013 census result | |
| 44 | 1,996,000 | 0.17 | 4.23 | 81,000 | 17 | 1,222,442 | July 4, 2015 | Preliminary 2015 census result | |
| 45 | 1,908,000 | 0.17 | 0.21 | 4,000 | 330 | 1,894,194 | 2011 | Official estimate | |
| 46 | 1,873,000 | 0.16 | 1.85 | 34,000 | 38 | 1,802,278 | October 5, 2013 | Preliminary 2013 census result | |
| 47 | 1,788,000 | 0.16 | 2.58 | 45,000 | 27 | 1,530,673 | 2015 | Official estimate | |
| 48 | 1,263,000 | 0.11 | 0.16 | 2,000 | 437 | 1,261,208 | July 1, 2014 | Official estimate | |
| 49 | 1,119,000 | 0.10 | 1.18 | 13,000 | 59 | 1,119,375 | 2015 | Official estimate | |
| 50 | 961,000 | 0.08 | 2.67 | 25,000 | 26 | 864,618 | July 1, 2011 | Official estimate | |
| 51 | 853,000 | 0.07 | 0.71 | 6,000 | 98 | 840,974 | January 1, 2013 | Official estimate | |
| 52 | 783,000 | 0.07 | 2.62 | 20,000 | 27 | 806,200 | July 1, 2016 | Official estimate | |
| 53 | 525,000 | 0.05 | 1.35 | 7,000 | 52 | 491,875 | June 16, 2010 | Final 2010 census result | |
| 54 | Western Sahara[6] | 509,000 | 0.04 | 1.80 | 9,000 | 39 | 510,713 | September 2, 2014 | Preliminary 2014 census result |
| 55 | 229,000 | 0.02 | 2.69 | 6,000 | 26 | 212,600 | August 21, 2012 | 2012 census result | |
| 56 | 194,000 | 0.02 | 2.65 | 5,000 | 27 | 179,200 | May 13, 2012 | Final 2012 census result | |
| 57 | 97,000 | 0.01 | 1.04 | 1,000 | 67 | 90,945 | August 26, 2010 | Final 2010 census result | |
| 58 | 4,000 | <0.01 | 0.0 | 0 | - | 5,633 | June 2016 | 2016 census result | |
| Total | 1,153,308,000 | 100.00 | 2.68 | 30,155,000 | 26 |
African population by country (top 8).
Nigeria (15.38%)
Ethiopia (8.37%)
Egypt (7.65%)
Democratic Republic of the Congo (6.57%)
Tanzania (4.55%)
South Africa (4.47%)
Kenya (3.88%)
Sudan (3.38%)
Other (45.75%)
See also
Notes
- ↑ Calculated, when available, from the latest national censuses or most recent official estimates (many of which are cited in their respective column), using the exponential formula shown on the List of countries by past and future population article. This is done to normalize the different populations to a unique date, so that they are really comparable.
- ↑ It corresponds to the following formula: projection2015/projection2014x100-100.
- ↑ It corresponds to the calculation: projection2015*annual_growth/100.
- ↑ It corresponds to the formula: LN(2)/LN(growth/100+1), which produces exactly the same result as LOG10(2)/LOG10(growth/100+1).
- ↑ It excludes the population of the disputed territory of the Western Sahara (the so-called Sahrawi Arab Democratic Republic. If it was included, the Moroccan September 2014 census would result in 33,848,242 inhabitants and its mid-2015 demographic projection would give some 34,198,000 inhab.
- ↑ Administration is split between Morocco and the Sahrawi Arab Democratic Republic, both of which claim the entire territory.
This article is issued from
Wikipedia.
The text is licensed under Creative Commons - Attribution - Sharealike.
Additional terms may apply for the media files.