List of countries by literacy rate
This is a list of countries by literacy rate. The figures represented are almost entirely collected by the UNESCO Institute for Statistics (UIS) on behalf of UNESCO with 2015 estimates based on people aged 15 or over who can read and write. Where data is taken from a different source, notes are provided. The data is collated by mostly using surveys within the last ten years which are self-declared by the persons in question.[1] UIS provide estimates based on these for the year 2015 with a Global Age-specific Literacy Projections Model (GALP).[2]
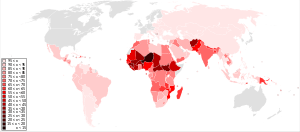
The global literacy rate for all people aged 15 and above is 86.3%. The global literacy rate for all males is 90.0% and the rate for all females is 82.7%. The rate varies throughout the world with developed nations having a rate of 99.2% (2013); Oceania having 71.3%; South and West Asia having 70.2% (2015) and sub-Saharan Africa at 64.0% (2015).[3] Over 75% of the world's 781 million illiterate adults are found in South Asia, West Asia and sub-Saharan Africa and women represent almost two-thirds of all illiterate adults globally.[4]
List of UN member states
| Country | UNESCO[3] | Non-UNESCO literacy rate | |||
|---|---|---|---|---|---|
| Literacy rate (all) | Male literacy | Female literacy | Gender difference[note 1] | ||
| 86.3% | 90.0% | 82.7% | 7.3% | ||
| 38.2% | 52.0% | 24.2% | 27.8% | ||
| 97.6% | 98.4% | 96.8% | 1.6% | ||
| 80.2% | 87.2% | 73.1% | 14.0% | 87.7%[5] | |
| not reported by UNESCO 2015 | |||||
| 71.1% | 82.0% | 60.7% | 21.3% | ||
| not reported by UNESCO 2015 | 99.0%(2013)[3][note 2] | ||||
| 98.1% | 98.0% | 98.1% | -0.1% | ||
| 99.8% | 99.8% | 99.7% | 0.1% | ||
| not reported by UNESCO 2015 | |||||
| not reported by UNESCO 2015 | |||||
| 99.8% | 99.9% | 99.7% | 0.2% | ||
| not reported by UNESCO 2015 | |||||
| 95.7% | 96.9% | 93.5% | 3.5% | ||
| 72.8%[note 3] | 75.6% | 69.9% | 5.7% | 71% (2014)[6] | |
| not reported by UNESCO 2015 | |||||
| 99.7% | 99.8% | 99.7% | 0.1% | ||
| not reported by UNESCO 2015 | |||||
| 82.7% | 82.3% | 83.0% | -0.7% | ||
| 38.4% | 49.9% | 27.3% | 22.6% | ||
| 64.9% | 73.1% | 55.0% | 18.1% | ||
| 95.7% | 97.8% | 93.6% | 4.2% | ||
| 98.5% | 99.5% | 97.5% | 2.1% | 97.2% (2013)[7][note 4] | |
| 88.5% | 88.0% | 88.9% | -0.9% | ||
| 91.7% | 91.4% | 92.1% | -0.7% | ||
| 96.4% | 97.7% | 95.1% | 2.6% | ||
| 98.4% | 98.7% | 98.1% | 0.7% | ||
| 36% | 43.0% | 29.3% | 13.7% | ||
| 85.6% | 88.2% | 83.1% | 5.1% | ||
| 87.6% | 92.1% | 83.1% | 9.0% | ||
| 77.2% | 84.5% | 70.5% | 13.9% | ||
| 75% | 81.2% | 68.9% | 12.3% | ||
| not reported by UNESCO 2015 | |||||
| 36.8% | 50.7% | 24.4% | 26.4% | ||
| 40.2% | 48.5% | 31.9% | 16.6% | ||
| 97.3% | 97.4% | 97.2% | 0.2% | ||
| 96.4% | 98.2% | 94.5% | 3.7% | ||
| 94.7% | 94.6% | 94.8% | -0.2% | ||
| 77.8% | 81.8% | 73.7% | 8.1% | ||
| 79.3% | 86.4% | 72.9% | 13.6% | ||
| 77.3% | 88.9% | 66.0% | 22.8% | ||
| 97.8% | 97.7% | 97.8% | -0.1% | ||
| 43.1% | 53.1% | 32.5% | 20.6% | ||
| 99.3% | 99.7% | 98.9% | 0.7% | ||
| 99.7% | 99.7% | 99.8% | -0.1% | ||
| 99.1% | 99.5% | 98.7% | 0.8% | ||
| not reported by UNESCO 2015 | |||||
| not reported by UNESCO 2015 | |||||
| not reported by UNESCO 2015 | |||||
| not reported by UNESCO 2015 | |||||
| 91.8% | 91.2% | 92.3% | -1.1% | ||
| 94.5% | 95.4% | 93.5% | 1.8% | ||
| 75.2% | 83.2% | 67.3% | 16.0% | ||
| 88.4% | 90.7% | 86.4% | 4.3% | ||
| 95.3% | 97.4% | 93.0% | 4.4% | ||
| 73.8% | 82.4% | 65.5% | 16.9% | ||
| 99.8% | 99.8% | 99.8% | 0.0% | ||
| 49.1% | 57.2% | 41.1% | 16.1% | ||
| not reported by UNESCO 2015 | |||||
| not reported by UNESCO 2015 | |||||
| not reported by UNESCO 2015 | |||||
| 83.2% | 85.3% | 81.0% | 4.3% | ||
| 55.5% | 63.9% | 47.6% | 16.3% | ||
| 99.8% | 99.8% | 99.7% | 0.1% | ||
| not reported by UNESCO 2015 | |||||
| 76.6% | 82.0% | 71.4% | 10.7% | ||
| 97.7% | 98.5% | 96.9% | 1.6% | ||
| not reported by UNESCO 2015 | |||||
| 79.3% | 84.7% | 74.4% | 10.4% | ||
| 30.4% | 38.1% | 22.8% | 15.3% | ||
| 59.9% | 71.8% | 48.3% | 23.5% | ||
| 88.5% | 87.2% | 89.8% | -2.6% | ||
| 60.7% | 64.3% | 57.3% | 7.0% | ||
| 88.5% | 88.4% | 88.6% | -0.1% | ||
| 99.1% | 99.1% | 99.0% | 0.2% | ||
| not reported by UNESCO 2015 | |||||
| 72.1% | 80.9% | 62.8% | 18.1% | 74.0% (2011)[8][note 5] | |
| 93.9% | 96.3% | 91.5% | 4.7% | ||
| 86.8% | 91.2% | 82.5% | 8.7% | ||
| 43.7% | 43.0% | 38.0% | 5.0% | 78.5%[9] | |
| not reported by UNESCO 2015 | |||||
| not reported by UNESCO 2015 | 97.8% (2011)[4][note 6] | ||||
| 99.2% | 99.4% | 99.0% | 0.4% | ||
| 88.7% | 84.0% | 93.1% | -9.1% | ||
| not reported by UNESCO 2015 | |||||
| 97.9% (in 2012) | 98.4% | 97.4% | 1.0% | ||
| 99.8% | 99.8% | 99.8% | 0.0% | ||
| 78% | 81.1% | 74.9% | 6.2% | ||
| not reported by UNESCO 2015 | |||||
| 100.0% | 100.0% | 100.0% | 0.0% | ||
| not reported by UNESCO 2015 | |||||
| 96.2% | 96.9% | 95.0% | 1.9% | ||
| 99.5% | 99.6% | 99.4% | 0.2% | ||
| 79.9% | 87.1% | 72.8% | 14.3% | ||
| 99.9% | 99.9% | 99.9% | 0.0% | ||
| 93.9% | 96.0% | 91.8% | 4.1% | ||
| 79.4% | 70.1% | 88.3% | -18.2% | ||
| 47.6% | 62.4% | 32.8% | 29.6% | ||
| 91% | 96.7% | 85.6% | 11.1% | ||
| not reported by UNESCO 2015 | |||||
| 99.8% | 99.8% | 99.8% | 0.0% | ||
| not reported by UNESCO 2015 | |||||
| 97.8% | 98.8% | 96.8% | 2.0% | ||
| 64.7% | 66.7% | 62.6% | 4.1% | ||
| 65.8% | 73.0% | 58.6% | 14.4% | ||
| 94.6% | 96.2% | 93.2% | 3.0% | ||
| 99.3% | 99.8% | 98.8% | 0.9% | ||
| 38.7% | 48.2% | 29.2% | 19.0% | ||
| 94.1% | 92.5% | 95.7% | -3.2% | ||
| not reported by UNESCO 2015 | |||||
| 52.1% | 62.6% | 41.6% | 21.0% | ||
| 90.6% | 92.9% | 88.5% | 4.4% | ||
| 94.4% | 95.6% | 93.3% | 2.2% | ||
| not reported by UNESCO 2015 | |||||
| 99.4% | 99.7% | 99.1% | 0.7% | ||
| not reported by UNESCO 2015 | |||||
| 98.4% | 98.2% | 98.6% | -0.4% | ||
| 98.7% | 99.5% | 98.0% | 1.4% | ||
| 72.4% | 82.7% | 62.5% | 20.2% | ||
| 58.8% | 73.3% | 45.4% | 27.9% | ||
| 75.6%[note 7] | 80.0% | 71.9% | 8.1% | ||
| 81.9% | 79.2% | 84.5% | -5.3% | ||
| not reported by UNESCO 2015 | |||||
| 64.7% | 75.6% | 55.1% | 20.5% | ||
| not reported by UNESCO 2015 | |||||
| not reported by UNESCO 2015 | |||||
| 82.8% | 82.4% | 83.2% | -0.9% | ||
| 19.1% | 27.3% | 11.0% | 16.3% | ||
| 59.6% | 69.2% | 49.7% | 19.5% | 71.6% (2010)[11][note 8] | |
| not reported by UNESCO 2015 | |||||
| 94.8% | 96.9% | 90.0% | 6.9% | ||
| 56.4% | 69.6% | 42.7% | 26.9% | ||
| 99.5% | 99.5% | 99.6% | -0.1% | ||
| 95% | 95.7% | 94.4% | 1.2% | ||
| 64.2% | 65.6% | 62.8% | 2.8% | ||
| 95.6% | 96.1% | 95.0% | 1.1% | ||
| 94.5% | 97.3% | 91.7% | 5.6% | ||
| 96.3% | 95.8% | 96.8% | -1.0% | ||
| 99.8% | 99.9% | 99.7% | 0.2% | ||
| 95.4% | 96.9% | 94.1% | 2.8% | ||
| 97.8% | 97.9% | 97.3% | 0.6% | ||
| 98.8% | 99.1% | 98.5% | 0.6% | ||
| 99.7% | 99.7% | 99.7% | 0.0% | ||
| 70.5% | 73.2% | 68.0% | 5.2% | ||
| not reported by UNESCO 2015 | |||||
| not reported by UNESCO 2015 | |||||
| not reported by UNESCO 2015 | |||||
| 99% | 98.9% | 99.1% | -0.2% | ||
| not reported by UNESCO 2015 | |||||
| 74.9% | 81.8% | 68.4% | 13.4% | ||
| 94.7% | 97.0% | 91.1% | 5.9% | ||
| 55.7% | 68.5% | 43.8% | 24.6% | ||
| 98.1% | 99.1% | 97.2% | 1.9% | ||
| 95.2% | 94.7% | 95.7% | -1.0% | ||
| 48.1% | 58.7% | 37.7% | 21.1% | ||
| 96.8% | 98.7% | 95.1% | 3.6% | ||
| 99.6% | 99.6% | 99.6% | 0.0% | ||
| 99.7% | 99.7% | 99.7% | 0.0% | ||
| not reported by UNESCO 2015 | 84.1% (2015)[4][note 9] | ||||
| not reported by UNESCO 2015 | |||||
| 94.3% | 95.5% | 93.1% | 2.4% | ||
| 26.8% | 34.8% | 19.2% | 15.6% | ||
| 98.1% | 98.7% | 97.5% | 1.3% | ||
| 92.6% | 93.6% | 91.7% | 1.9% | ||
| 53.5% | 59.80% | 46.7% | 13.1% | ||
| 95.6% | 96.1% | 95.0% | 1.1% | ||
| 87.5% | 87.4% | 87.5% | -0.1% | ||
| not reported by UNESCO 2015 | |||||
| not reported by UNESCO 2015 | |||||
| 86.4% | 91.7% | 81.0% | 10.7% | ||
| 99.8% | 99.8% | 99.7% | 0.1% | ||
| 80.3% | 84.8% | 75.9% | 9.0% | ||
| 96.7% | 96.6% | 96.7% | -0.1% | ||
| 67.5% | 71.5% | 63.4% | 8.1% | ||
| 66.5% | 78.3% | 55.3% | 23.0% | ||
| 99.4% | 99.3% | 99.4% | -0.1% | ||
| 99% | 99.2% | 98.7% | 0.5% | ||
| 81.8% | 89.6% | 74.2% | 15.4% | ||
| 95% | 98.4% | 91.8% | 6.6% | ||
| 99.7% | 99.8% | 99.6% | 0.1% | ||
| not reported by UNESCO 2015 | |||||
| 73.9% | 80.8% | 66.9% | 14.0% | ||
| 99.8% | 99.8% | 99.7% | 0.1% | ||
| 93.8% | 93.1% | 95.8% | -2.6% | ||
| not reported by UNESCO 2015 | |||||
| not reported by UNESCO 2015 | |||||
| 98.4% | 98.1% | 98.7% | -0.6% | ||
| 99.6% | 99.7% | 99.5% | 0.3% | ||
| 85.2% | 86.6% | 83.8% | 2.8% | ||
| 95.4% | 95.0% | 95.7% | -0.7% | ||
| 94.5% | 96.3% | 92.8% | 3.4% | ||
| 70.1% | 85.1% | 55.0% | 30.1% | ||
| 63.4% | 70.9% | 56.0% | 14.9% | ||
| 86.5% | 88.5% | 84.6% | 4.0% | ||
List of other states and territories
See also
Notes
- ↑ Gender difference is calculated as the male literacy rate minus the female literacy rate. Negative values shows countries with higher female rates than male.
- ↑ The breakdown by gender is 98.4% male, 99.4% female (difference of -1.0%)
- ↑ Adult rate: 72.76%. By gender: M=75.62%,F=69.90%. All figures 2016.[6]
- ↑ Gender breakdown is 99.2% male and 95.2 for females. "Data on literacy were collected for persons aged 10 or more years who did not receive any kind of formal education or with incomplete primary education. A person capable of reading with understanding and writing a statement on his/her daily routine shall be considered to be a literate person."
- ↑ The breakdown by gender is 82.1% male, 65.5% female (difference of 16.6%)
- ↑ The breakdown by gender is 98.7% male, 95.8% female (difference of 2.9%)
- ↑ Adult rate: 75.55%. By gender: M=80.01%,F=71.85%. All figures 2016.[10]
- ↑ The breakdown by gender is 79.3% male, 63.7% female (difference is 15.6%)
- ↑ The breakdown by gender is 88.9% male, 79.2% female (difference is 9.7%)
References
- ↑ "Literacy Statistics Metadata Information Table". UNESCO Institute for Statistics. September 2015. Retrieved 19 November 2015.
- ↑ Lutz, Wolfgang & Scherbov, Sergei (July 2006). Global Age-specific Literacy Projections Model (GALP): Rationale, Methodology and Software (PDF). Adult Education and Literacy Statistics Programme. UNESCO Institute for Statistics.
- 1 2 3 4 5 6 7 8 9 10 11 12 13 "Adult literacy rate, population 15+ years (both sexes, female, male)". UIS Data Centre. UNESCO. August 2015. Retrieved 19 November 2015.
- 1 2 3 4 "Country Comparison to the World of Literacy Rate". The World Factbook. Central Intelligence Agency. Retrieved 1 November 2015.
- ↑ "«Le taux d'analphabétisme a baissé à 12% en Algérie»". La Tribune. 24 January 2017. Archived from the original on 22 October 2017. Retrieved 2 July 2017.
- 1 2 Bangladesh - Literacy rate (2017). Bangladesh rises the literacy rate. Expansion Publication.
- ↑ "BiH Census 2013" (PDF). BHAS. 2016. p. 138.
- ↑ "State of Literacy" (PDF). Census India. 2011. Retrieved 24 December 2016.
- ↑ https://www.unicef.org/infobycountry/iraq_statistics.html
- ↑
- ↑ "National Literacy Survey". National Bureau of Statistics. June 2010. Retrieved 5 September 2015.
- ↑ "Non-member States". United Nations. Archived from the original on 9 May 2009. Retrieved 12 November 2015.
- ↑ "Republic of China's population over the age of 15 education statistics" (in Chinese). Ministry of the Interior. 25 February 2017. Archived from the original on 2017-04-24. Retrieved 23 April 2017.
External links
- World Bank – Literacy rate, adult total (% of people ages 15 and above), for historical use.