List of countries by intentional homicide rate
.svg.png)
List of countries by intentional homicide rate per year per 100,000 inhabitants.[1][note 1] The reliability of underlying national murder rate data may vary.[2] UNODC data is used in the main table below.[1] In some cases it is not as up to date as other sources. See farther down as to why its data is used over other sources.
Intentional homicide demographics are affected by changes in trauma care, leading to changed lethality of violent assaults, so the intentional homicide rate may not necessarily indicate the overall level of societal violence.[3] They may also be under-reported for political reasons.[4][5]
A study undertaken by the Geneva Declaration on Armed Violence and Development estimated that there were approximately 490,000 intentional homicides in 2004. The study estimated that the global rate was 7.6 intentional homicides per 100,000 inhabitants for 2004.[6] UNODC (United Nations Office on Drugs and Crime) reported a global average intentional homicide rate of 6.2 per 100,000 population for 2012 (in their report titled "Global Study on Homicide 2013").[7][8] UNODC calculated a rate of 6.9 in 2010.[9]
Definition
Intentional homicide is defined by the United Nations Office on Drugs and Crime (UNODC) in its Global Study on Homicide report:[11]
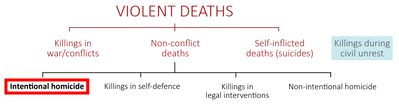
Within the broad range of violent deaths, the core element of intentional homicide is the complete liability of the direct perpetrator, which thus excludes killings directly related to war or conflicts, self-inflicted death (suicide), killings due to legal interventions or justifiable killings (such as self-defence), and those deaths caused when the perpetrator was reckless or negligent but did not intend to take a human life (non-intentional homicide).
Though some discrepancies exist in how specific categories of intentional killings are classified, the definitions used by countries to record data are generally close to the UNODC definition, making the homicide rates highly comparable at the international level.[12] UNODC uses the homicide rate as a proxy for overall violence, as this type of crime is one of the most accurately reported and internationally comparable indicators.[13]
Figures from the Global Study on Homicide are based on the UNODC Homicide Statistics dataset, which is derived from the criminal justice or public health systems of a variety of countries and territories.[14] The homicide rates derived from criminal justice data (typically recorded by police authorities) and the public health system data (recorded when the cause of death is established) may diverge substantially for some countries.[15] The two sources usually match in the Americas, Europe and Oceania, but there are large discrepancies for the three African countries reporting both sources.[16] For the 70 countries in which neither source was made available, figures were derived from WHO statistical models.[15]
Deaths resulting from an armed conflict between states are never included in the count.[17] Killings caused by a non-international armed conflict may or may not be included, depending on the intensity of hostilities and whether it is classified as 'civil unrest' or a clash between organized armed groups.[17]
UNODC's global study
All data in this section comes from the Statistics Online website of the Research and Analysis Branch of UNODC (United Nations Office on Drugs and Crime).[18]
By region
Rates are calculated per 100,000 inhabitants.
| Region | Rate | Count |
|---|---|---|
| Americas | 16.3 | 157,000 |
| Africa | 12.5 | 135,000 |
| World | 6.2 | 437,000 |
| Europe | 3.0 | 22,000 |
| Oceania | 3.0 | 1,100 |
| Asia | 2.9 | 122,000 |
By country
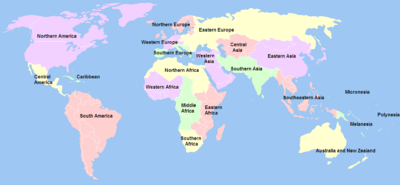
The regions and region names in the table are based on the United Nations geoscheme since the table sources are United Nations Office on Drugs and Crime (UNODC) reports.[19][20]
- There is a total yearly count of homicides for each country. Rates are calculated per 100,000 inhabitants.
- Subregion names are based on the United Nations geoscheme.
- Row numbers on the left are fixed.
Table
UNODC murder rates: murders per 100,000 inhabitants.[1]
|
|
Country subdivisions
Rates. Click the "show" links next to the country names at the top left of each chart. The references are linked from the sources column.
Australia
| Sources | 2002 | 2003 | 2004 | 2005 | 2006 | 2007 | 2008 | 2009 | 2010 | 2011 | |
|---|---|---|---|---|---|---|---|---|---|---|---|
| | [21][22][23] | 1.3 | 1.2 | 1.1 | 1.0 | 1.6 | 1.0 | 1.1 | 1.2 | 1.4 | 1.0 |
| | [21][22][23] | 1.9 | 1.2 | 0.4 | 0.6 | 0.9 | 0.6 | 1.4 | 0.9 | 1.0 | 0.8 |
| | [21][22][23] | 1.8 | 1.7 | 2.1 | 1.8 | 1.7 | 2.4 | 1.6 | 1.3 | 1.4 | 1.6 |
| | [21][22][23] | 1.5 | 1.4 | 1.6 | 1.2 | 1.5 | 1.6 | 1.3 | 1.1 | 1.4 | 1.6 |
| | [21][22][23] | 1.9 | 2.2 | 1.3 | 1.6 | 1.4 | 1.5 | 1.3 | 1.3 | 1.2 | 1.2 |
| | [21][22][23] | 0.0 | 0.6 | 0.9 | 0.9 | 0.6 | 0.4 | 1.2 | 0.9 | 0.9 | 1.1 |
| | [21][22][23] | 1.8 | 1.7 | 1.6 | 2.2 | 1.4 | 1.7 | 2.4 | 2.1 | 1.1 | 1.4 |
| | [21][22][23] | 1.2 | 0.4 | 0.7 | 1.0 | 0.9 | 0.7 | 0.8 | 1.1 | 0.8 | 1.0 |
Canada
| 2005 | 2006 | 2007 | 2008 | 2009 | 2010 | 2011 | 2012 | 2013 | 2014 | 2015 | 2016 | ||
|---|---|---|---|---|---|---|---|---|---|---|---|---|---|
| |
0.39 | 2.4 | 1.37 | 0.59 | 0.98 | 0.20 | 0.77 | 0.76 | 0.57 | 1.33 | 0.38 | 0.57 | 1.32 |
| |
0.00 | 0.00 | 0.73 | 0.00 | 1.43 | 0.00 | 0.00 | 0.69 | 0.00 | 0.69 | 2.05 | 0.68 | 0.00 |
| |
1.49 | 2.13 | 1.71 | 1.39 | 1.28 | 1.60 | 2.34 | 2.33 | 1.80 | 1.38 | 0.64 | 1.27 | 1.37 |
| |
0.93 | 1.20 | 0.94 | 1.08 | 0.40 | 1.60 | 1.20 | 1.06 | 0.79 | 0.93 | 1.33 | 1.46 | 1.45 |
| |
1.47 | 1.32 | 1.22 | 1.17 | 1.19 | 1.12 | 1.07 | 1.31 | 1.34 | 0.86 | 0.85 | 0.93 | 0.80 |
| |
1.51 | 1.75 | 1.55 | 1.58 | 1.36 | 1.36 | 1.44 | 1.21 | 1.22 | 1.24 | 1.14 | 1.26 | 1.47 |
| |
4.26 | 4.16 | 3.29 | 5.11 | 4.48 | 4.67 | 3.69 | 4.30 | 4.24 | 4.03 | 3.51 | 3.63 | 3.19 |
| |
3.91 | 4.33 | 4.23 | 3.00 | 2.96 | 3.50 | 3.14 | 3.56 | 2.67 | 2.80 | 2.14 | 3.79 | 4.69 |
| |
2.65 | 3.25 | 2.78 | 2.51 | 3.06 | 2.59 | 2.04 | 2.95 | 2.21 | 2.05 | 2.57 | 3.17 | 2.73 |
| |
2.72 | 2.41 | 2.55 | 2.04 | 2.67 | 2.65 | 1.86 | 1.96 | 1.56 | 1.66 | 1.92 | 2.03 | 1.83 |
| |
22.24 | 3.13 | 0.00 | 6.14 | 9.05 | 5.94 | 2.89 | 0.00 | 0.00 | 0.00 | 8.11 | 2.67 | 10.67 |
| |
9.24 | 0.00 | 0.00 | 4.59 | 6.87 | 4.58 | 2.31 | 6.90 | 11.46 | 4.56 | 6.82 | 11.34 | 6.75 |
| |
13.40 | 6.59 | 6.49 | 22.38 | 12.66 | 18.64 | 17.99 | 20.47 | 14.40 | 11.29 | 10.93 | 5.52 | 2.70 |
Mexico
| Sources | 2006 | 2007 | 2008 | 2009 | 2010 | 2011 | 2012 | 2013 | 2014 | 2015 | 2016 | 2017 | |
|---|---|---|---|---|---|---|---|---|---|---|---|---|---|
| | [25] | 5.12 | 4.86 | 5.23 | 8.06 | 14.11 | 24.54 | 41.87 | 25.49 | 13.92 | 23.08 | 71.22 | 96.61 |
| | [25] | 3.54 | 4.79 | 4.63 | 4.94 | 7.39 | 5.65 | 5.03 | 7.80 | 9.45 | 19.77 | 24.40 | 69.15 |
| | [25] | 25.17 | 23.88 | 28.13 | 41.90 | 43.55 | 62.13 | 66.01 | 59.22 | 42.69 | 56.50 | 61.67 | 64.26 |
| | [25] | 16.22 | 16.80 | 27.47 | 23.67 | 27.41 | 20.55 | 17.73 | 22.92 | 20.80 | 23.82 | 33.38 | 58.36 |
| | [25] | 22.12 | 26.91 | 41.48 | 44.35 | 60.11 | 50.72 | 40.99 | 33.45 | 28.59 | 28.65 | 31.93 | 43.89 |
| | [25] | 17.85 | 18.27 | 59.16 | 90.56 | 110.71 | 86.68 | 55.49 | 39.69 | 29.56 | 25.47 | 32.89 | 41.72 |
| | [25] | 3.45 | 4.52 | 5.01 | 5.09 | 7.29 | 7.81 | 12.69 | 10.77 | 7.29 | 14.91 | 28.96 | 35.12 |
| | [25] | 9.33 | 6.54 | 7.70 | 17.81 | 31.00 | 30.43 | 46.57 | 31.85 | 21.92 | 25.78 | 31.70 | 30.63 |
| | [25] | 15.52 | 12.28 | 13.04 | 16.61 | 14.95 | 17.34 | 16.80 | 19.91 | 19.81 | 16.90 | 27.81 | 27.41 |
| | [25] | 9.36 | 11.91 | 14.93 | 18.59 | 23.98 | 17.06 | 17.83 | 20.17 | 19.64 | 17.46 | 19.81 | 23.01 |
| | [25] | 28.69 | 25.12 | 19.27 | 19.59 | 17.22 | 16.43 | 12.01 | 13.54 | 16.06 | 18.74 | 21.55 | 22.63 |
| | [25] | 11.06 | 8.32 | 9.51 | 8.75 | 21.62 | 25.32 | 29.72 | 16.06 | 17.93 | 15.04 | 16.60 | 22.22 |
| | [25] | 10.13 | 14.45 | 15.21 | 13.55 | 17.32 | 19.28 | 17.36 | 14.41 | 11.24 | 14.48 | 10.19 | 21.57 |
| | [25] | 5.82 | 6.37 | 6.30 | 4.54 | 7.56 | 11.42 | 12.32 | 10.89 | 6.10 | 7.02 | 15.52 | 20.10 |
| | [25] | 9.45 | 10.43 | 13.89 | 13.66 | 33.10 | 40.28 | 21.12 | 12.81 | 9.16 | 6.78 | 3.13 | 20.10 |
| | [25] | 4.54 | 4.26 | 4.73 | 7.52 | 7.86 | 10.76 | 13.60 | 11.21 | 12.29 | 15.11 | 16.39 | 18.55 |
| | [25] | 6.07 | 5.48 | 6.40 | 7.77 | 11.93 | 16.20 | 15.49 | 14.19 | 11.57 | 12.85 | 14.37 | 16.88 |
| | [25] | 5.24 | 6.06 | 8.53 | 6.10 | 15.94 | 15.18 | 14.80 | 9.66 | 8.39 | 8.75 | 11.02 | 16.74 |
| | [25] | 7.73 | 8.88 | 6.72 | 5.25 | 6.35 | 7.10 | 5.37 | 6.00 | 7.12 | 9.77 | 11.46 | 15.96 |
| | [25] | 7.42 | 7.10 | 7.50 | 7.14 | 7.08 | 10.43 | 9.63 | 6.74 | 5.51 | 8.06 | 9.43 | 14.56 |
| | [25] | 4.08 | 6.31 | 5.76 | 5.75 | 17.53 | 41.75 | 29.97 | 14.55 | 9.77 | 8.87 | 12.49 | 12.54 |
| | [25] | 12.93 | 15.57 | 26.41 | 56.36 | 61.32 | 45.20 | 36.15 | 27.54 | 18.03 | 13.49 | 13.35 | 12.50 |
| | [25] | 7.23 | 7.96 | 7.95 | 8.34 | 9.07 | 8.72 | 8.74 | 8.42 | 8.44 | 9.64 | 10.78 | 12.31 |
| | [25] | 19.08 | 7.63 | 8.38 | 8.78 | 7.40 | 9.54 | 13.22 | 11.81 | 12.00 | 12.27 | 11.99 | 11.75 |
| | [25] | 16.80 | N/A | 3.65 | 4.11 | 4.05 | 5.89 | 4.82 | 5.63 | 4.84 | 4.62 | 5.94 | 9.29 |
| | [25] | 7.76 | 7.64 | 6.85 | 10.32 | 10.46 | 12.31 | 11.35 | 9.83 | 7.89 | 9.56 | 8.80 | 8.83 |
| | [25] | 3.03 | 3.26 | 3.26 | 4.96 | 3.19 | 5.21 | 5.75 | 5.71 | 5.22 | 6.93 | 5.85 | 8.53 |
| | [25] | 4.15 | 4.54 | 6.62 | 8.75 | 14.63 | 23.42 | 27.01 | 22.32 | 13.33 | 9.93 | 7.54 | 7.62 |
| | [25] | 3.58 | 4.53 | 5.56 | 4.98 | 7.05 | 6.92 | 7.96 | 7.61 | 7.27 | 5.84 | 9.12 | 7.17 |
| | [25] | 3.99 | 5.73 | 5.34 | 5.17 | 4.98 | 4.07 | 3.00 | 4.38 | 4.96 | 4.97 | 5.18 | 6.79 |
| | [25] | 2.33 | 4.32 | 5.46 | 5.61 | 6.19 | 6.09 | 3.57 | 3.19 | 3.31 | 2.95 | 2.84 | 6.13 |
| | [25] | 1.17 | 1.58 | 2.44 | 1.69 | 1.82 | 2.29 | 1.87 | 1.94 | 2.01 | 2.50 | 2.33 | 2.12 |
United States
| Sources | 2000 | 2001 | 2002 | 2003 | 2004 | 2005 | 2006 | 2007 | 2008 | 2009 | 2010 | 2011 | 2012 | |
|---|---|---|---|---|---|---|---|---|---|---|---|---|---|---|
| | [26] | 41.8 | 40.3 | 46.4 | 44.7 | 35.7 | 33.5 | 29.1 | 30.8 | 31.4 | 24.2 | 21.8 | 17.4 | 13.9 |
| | [27] | 18.22 | 19.57 | 20.48 | 20.69 | 21.02 | 20.39 | 19.82 | 19.41 | 21.47 | 23.82 | 26.22 | 30.6 | 26.46 |
| | [26] | 12.5 | 11.2 | 13.2 | 13.0 | 12.7 | 10.0 | 12.9 | 14.6 | 12.3 | 11.8 | 11.0 | 11.1 | 10.8 |
| | [26] | 7.4 | 5.4 | 8.2 | 6.2 | 8.9 | 7.5 | 6.9 | 9.3 | 8.1 | 9.9 | 6.8 | 7.6 | 5.6 |
| | [26] | 8.1 | 8.3 | 9.4 | 9.5 | 9.4 | 9.9 | 9.7 | 9.9 | 8.8 | 7.7 | 7.4 | 6.8 | 6.3 |
| | [26] | 7.2 | 7.4 | 7.3 | 6.8 | 6.1 | 7.2 | 6.9 | 6.6 | 6.6 | 7.4 | 5.6 | 5.9 | 6.0 |
| | [26] | 7.4 | 8.5 | 6.8 | 6.6 | 5.6 | 8.2 | 8.3 | 8.9 | 7.5 | 6.8 | 5.7 | 6.2 | 7.1 |
| | [26] | 9.0 | 9.9 | 9.2 | 9.3 | 7.8 | 7.4 | 7.9 | 6.9 | 8.0 | 6.6 | 6.9 | 7.8 | 7.4 |
| | [26] | 6.2 | 6.6 | 5.8 | 5.1 | 6.1 | 6.9 | 6.3 | 6.2 | 7.7 | 6.5 | 7.0 | 6.1 | 6.5 |
| | [26] | 6.7 | 6.7 | 6.8 | 6.1 | 6.4 | 6.2 | 7.1 | 6.6 | 5.5 | 6.2 | 5.9 | 6.2 | 7.0 |
| | [26] | 7.3 | 8.1 | 7.3 | 7.3 | 6.8 | 7.4 | 8.4 | 8.3 | 6.9 | 6.7 | 5.7 | 6.8 | 6.9 |
| | [26] | 6.3 | 5.5 | 5.2 | 6.6 | 6.4 | 6.8 | 7.3 | 7.0 | 5.8 | 6.2 | 4.6 | 5.4 | 5.9 |
| | [26] | 5.3 | 5.3 | 4.7 | 5.9 | 5.3 | 5.3 | 5.9 | 6.2 | 5.9 | 6.3 | 5.2 | 5.6 | 5.7 |
| | [26] | 7.2 | 7.8 | 7.6 | 7.1 | 6.1 | 6.0 | 6.1 | 5.9 | 6.1 | 6.0 | 5.5 | 6.1 | 5.8 |
| | [26] | 6.5 | 8.6 | 8.4 | 8.8 | 7.4 | 8.5 | 9.1 | 7.5 | 6.3 | 5.9 | 5.8 | 5.1 | 4.5 |
| | [26] | 8.0 | 7.1 | 7.1 | 7.6 | 6.9 | 6.2 | 6.5 | 7.5 | 6.6 | 5.8 | 5.7 | 5.6 | 5.9 |
| | [26] | 5.6 | 5.3 | 5.5 | 5.4 | 5.4 | 5.0 | 6.2 | 6.6 | 6.4 | 5.5 | 5.2 | 5.2 | 5.2 |
| | [26] | 7.0 | 7.5 | 7.1 | 7.9 | 7.2 | 7.5 | 8.6 | 8.6 | 7.1 | 5.8 | 6.4 | 6.1 | 5.5 |
| | [26] | 5.9 | 6.2 | 6.0 | 6.4 | 6.1 | 6.1 | 5.9 | 5.9 | 5.6 | 5.4 | 4.9 | 4.4 | 4.4 |
| | [26] | 6.1 | 6.4 | 6.8 | 6.8 | 6.7 | 6.9 | 6.8 | 6.2 | 5.8 | 5.3 | 4.8 | 4.8 | 5.0 |
| | [26] | 7.0 | 6.2 | 6.6 | 6.0 | 6.2 | 6.7 | 6.1 | 6.4 | 6.5 | 5.2 | 5.0 | 5.2 | 4.9 |
| | [26] | 4.9 | 5.3 | 5.1 | 5.2 | 5.2 | 6.1 | 6.0 | 5.8 | 5.7 | 5.3 | 5.1 | 5.0 | 5.4 |
| | [26] | 5.8 | 6.7 | 5.9 | 5.5 | 5.1 | 5.7 | 5.7 | 5.5 | 5.0 | 4.9 | 4.1 | 4.7 | 4.7 |
| | [26] | 3.2 | 2.9 | 3.2 | 2.6 | 3.4 | 4.4 | 4.9 | 4.5 | 6.5 | 4.6 | 5.7 | 5.3 | 6.2 |
| | [26] | 2.5 | 2.2 | 3.2 | 4.0 | 3.8 | 4.5 | 4.4 | 3.6 | 3.7 | 4.6 | 3.1 | 4.7 | 3.9 |
| | [26] | 3.7 | 4.0 | 4.6 | 4.6 | 4.4 | 5.1 | 4.9 | 4.6 | 4.8 | 4.6 | 4.2 | 4.3 | 4.3 |
| | [26] | 5.7 | 5.1 | 5.3 | 5.6 | 5.2 | 6.1 | 5.3 | 5.4 | 4.8 | 4.7 | 4.7 | 3.8 | 3.8 |
| | [26] | 6.3 | 3.4 | 2.9 | 4.6 | 4.5 | 3.7 | 4.5 | 3.8 | 4.0 | 4.4 | 3.4 | 3.9 | 2.9 |
| | [26] | 4.8 | 4.4 | 4.7 | 4.4 | 5.7 | 4.6 | 4.1 | 4.9 | 4.7 | 4.3 | 4.3 | 3.5 | 4.5 |
| | [26] | 5.0 | 5.0 | 4.8 | 4.9 | 4.6 | 4.5 | 4.8 | 4.2 | 4.3 | 4.0 | 4.5 | 3.9 | 3.5 |
| | [26] | 3.4 | 3.9 | 4.0 | 4.7 | 4.5 | 4.8 | 4.9 | 4.4 | 4.3 | 3.7 | 4.2 | 4.3 | 4.4 |
| | [26] | 3.1 | 3.6 | 4.0 | 4.1 | 4.4 | 3.7 | 3.6 | 3.2 | 3.3 | 3.2 | 2.6 | 3.0 | 3.1 |
| | [26] | 4.3 | 6.2 | 5.1 | 6.0 | 5.6 | 4.8 | 5.4 | 6.3 | 3.9 | 3.1 | 4.3 | 4.1 | 4.1 |
| | [26] | 2.9 | 3.1 | 2.4 | 3.2 | 2.9 | 3.0 | 3.9 | 3.2 | 3.8 | 3.0 | 3.7 | 3.6 | 4.1 |
| | [26] | 2.2 | 3.8 | 1.8 | 3.3 | 3.2 | 1.9 | 3.5 | 2.8 | 4.1 | 3.3 | 2.5 | 2.9 | 2.7 |
| | [26] | 4.3 | 3.7 | 3.8 | 2.3 | 2.4 | 3.2 | 2.5 | 1.8 | 3.0 | 3.0 | 2.8 | 1.9 | 3.2 |
| | [26] | 3.3 | 3.0 | 3.0 | 3.0 | 3.1 | 3.3 | 3.1 | 2.7 | 2.9 | 2.9 | 2.3 | 2.4 | 3.0 |
| | [26] | 2.0 | 2.0 | 2.2 | 2.7 | 2.2 | 2.7 | 2.8 | 2.9 | 2.9 | 2.6 | 3.3 | 2.8 | 1.8 |
| | [26] | 0.9 | 0.9 | 1.4 | 1.3 | 2.2 | 2.3 | 3.8 | 3.9 | 4.6 | 3.7 | 2.8 | 2.4 | 3.0 |
| | [26] | 3.2 | 3.6 | 2.8 | 3.3 | 2.8 | 3.7 | 3.0 | 3.3 | 2.6 | 2.6 | 2.7 | 2.4 | 3.0 |
| | [26] | 2.4 | 1.8 | 3.0 | 2.8 | 2.2 | 2.8 | 2.5 | 4.0 | 2.3 | 2.0 | 1.4 | 3.2 | 2.4 |
| | [26] | 3.7 | 2.5 | 2.8 | 3.2 | 2.3 | 2.5 | 2.9 | 4.0 | 3.9 | 2.3 | 3.0 | 3.7 | 2.9 |
| | [26] | 2.0 | 2.4 | 2.0 | 1.9 | 2.5 | 2.2 | 2.4 | 2.0 | 2.3 | 2.3 | 2.5 | 2.2 | 2.4 |
| | [26] | 1.2 | 1.5 | 1.1 | 1.2 | 1.4 | 1.4 | 1.7 | 1.5 | 2.4 | 2.0 | 1.8 | 2.0 | 1.9 |
| | [26] | 2.9 | 2.6 | 1.9 | 1.8 | 2.6 | 1.9 | 1.6 | 1.9 | 2.0 | 1.8 | 1.8 | 1.5 | 2.1 |
| | [26] | 0.6 | 1.1 | 0.8 | 1.4 | 1.3 | 1.9 | 2.2 | 2.7 | 1.7 | 1.9 | 1.5 | 3.5 | 4.0 |
| | [26] | 1.2 | 2.3 | 2.7 | 1.9 | 2.2 | 2.4 | 2.4 | 3.3 | 1.5 | 1.6 | 1.4 | 2.2 | 1.8 |
| | [26] | 3.1 | 2.4 | 2.2 | 2.5 | 2.2 | 2.2 | 2.4 | 2.2 | 2.1 | 1.4 | 1.8 | 1.4 | 1.8 |
| | [26] | 1.9 | 2.9 | 2.0 | 2.6 | 1.9 | 2.2 | 2.0 | 2.2 | 1.5 | 1.4 | 1.9 | 1.8 | 1.8 |
| | [26] | 1.6 | 1.7 | 1.5 | 1.7 | 1.5 | 1.3 | 1.8 | 1.3 | 2.6 | 1.3 | 1.2 | 1.4 | 1.5 |
| | [26] | 1.5 | 1.1 | 2.1 | 2.4 | 2.6 | 1.3 | 2.2 | 2.1 | 2.7 | 1.3 | 1.1 | 1.8 | 1.3 |
| | [26] | 1.8 | 1.3 | 0.9 | 1.3 | 1.3 | 1.5 | 1.0 | 0.9 | 1.1 | 0.8 | 1.0 | 1.2 | 1.1 |
| | [28] | 4.9 | 5.4 | 4.2 | 6.4 | 0.6 |
Brazil
| 2000 | 2001 | 2002 | 2003 | 2004 | 2005 | 2006 | 2007 | 2008 | 2009 | 2010 | 2011 | 2012 | 2013 | 2014 | 2015 | 2016 | 2017 | |
|---|---|---|---|---|---|---|---|---|---|---|---|---|---|---|---|---|---|---|
| 9.0 | 11.2 | 10.6 | 14.2 | 11.7 | 13.5 | 14.9 | 19.1 | 23.0 | 25.5 | 25.6 | 33.0 | 34.8 | 42.9 | 47.0 | 44.9 | 53.4 | 68.0 | |
| 19.4 | 21.2 | 25.7 | 22.5 | 18.7 | 18.5 | 23.0 | 19.5 | 19.6 | 22.1 | 22.5 | 22.0 | 27.4 | 30.1 | 29.4 | 27.0 | 44.4 | 63.9 | |
| 16.5 | 17.2 | 18.9 | 20.1 | 20.0 | 21.0 | 21.8 | 23.2 | 23.9 | 25.3 | 31.8 | 32.7 | 44.6 | 50.9 | 52.3 | 46.7 | 40.6 | 59.1 | |
| 53.8 | 58.5 | 54.5 | 55.3 | 50.7 | 51.5 | 52.6 | 53.0 | 50.9 | 45.0 | 39.5 | 39.2 | 37.3 | 33.9 | 36.2 | 41.2 | 47.3 | 57.3 | |
| 25.6 | 29.3 | 34.3 | 35.7 | 35.1 | 39.9 | 53.1 | 59.5 | 60.3 | 59.3 | 66.9 | 71.4 | 64.6 | 65.1 | 62.8 | 52.3 | 54.2 | 56.9 | |
| 23.5 | 23.3 | 29.3 | 29.7 | 24.4 | 24.7 | 29.2 | 25.7 | 27.8 | 32.3 | 32.7 | 35.0 | 41.6 | 44.0 | 49.4 | 58.1 | 64.7 | 55.7 | |
| 32.5 | 36.9 | 35.0 | 35.5 | 31.3 | 33.0 | 32.8 | 27.0 | 34.2 | 30.3 | 38.8 | 30.5 | 36.2 | 30.6 | 34.1 | 38.2 | 48.7 | 53.9 | |
| 13.0 | 15.1 | 18.3 | 21.0 | 22.7 | 27.6 | 29.2 | 30.3 | 39.1 | 40.2 | 46.4 | 40.0 | 41.4 | 42.7 | 42.7 | 45.0 | 50.8 | 53.4 | |
| 9.4 | 11.9 | 13.0 | 16.0 | 16.6 | 20.9 | 23.7 | 26.0 | 33.2 | 37.1 | 41.7 | 39.4 | 43.4 | 37.8 | 40.0 | 39.5 | 46.9 | 45.1 | |
| 39.5 | 31.7 | 34.9 | 29.7 | 22.6 | 24.3 | 27.5 | 27.9 | 25.4 | 28.0 | 26.9 | 20.6 | 30.7 | 43.8 | 31.8 | 40.1 | 39.7 | 44.0 | |
| 51.0 | 50.5 | 56.5 | 52.7 | 49.2 | 48.2 | 47.5 | 41.6 | 35.7 | 33.5 | 35.4 | 29.7 | 29.4 | 31.2 | 34.7 | 30.6 | 36.4 | 40.4 | |
| 20.1 | 21.2 | 24.4 | 23.7 | 26.4 | 26.1 | 26.3 | 26.0 | 30.7 | 32.1 | 33.0 | 37.4 | 45.4 | 46.2 | 44.3 | 45.3 | 45.3 | 39.3 | |
| 46.8 | 46.7 | 51.2 | 50.5 | 49.4 | 47.0 | 50.9 | 53.3 | 56.4 | 56.9 | 51.0 | 47.1 | 46.6 | 42.2 | 41.4 | 36.9 | 32.0 | 37.4 | |
| 15.1 | 14.1 | 17.4 | 17.6 | 18.6 | 20.7 | 22.8 | 23.7 | 27.5 | 33.5 | 38.6 | 42.6 | 40.0 | 39.6 | 39.3 | 38.3 | 33.9 | 31.9 | |
| 39.8 | 38.5 | 37.0 | 35.0 | 32.1 | 32.4 | 31.4 | 30.5 | 31.7 | 33.3 | 32.0 | 32.8 | 34.5 | 36.4 | 42.1 | 36.8 | 35.7 | 31.5 | |
| 19.9 | 16.5 | 17.3 | 18.5 | 16.9 | 18.5 | 21.1 | 21.1 | 24.8 | 27.0 | 31.1 | 36.5 | 37.4 | 31.3 | 32.0 | 37.4 | 36.3 | 31.3 | |
| 26.7 | 27.8 | 28.4 | 28.9 | 27.0 | 26.1 | 26.6 | 25.5 | 26.7 | 27.2 | 27.8 | 27.4 | 29.4 | 28.6 | 29.8 | 28.9 | 30.3 | 30.8 | |
| 6.1 | 9.4 | 9.9 | 13.0 | 11.7 | 15.3 | 15.7 | 18.0 | 20.3 | 22.0 | 23.1 | 23.9 | 26.5 | 31.8 | 35.9 | 35.3 | 34.6 | 29.4 | |
| 33.8 | 40.1 | 42.3 | 38.4 | 38.0 | 36.2 | 37.4 | 27.2 | 32.1 | 35.8 | 34.9 | 28.5 | 33.1 | 27.9 | 33.1 | 33.9 | 39.3 | 28.1 | |
| 16.3 | 17.9 | 18.3 | 18.1 | 18.5 | 18.6 | 18.1 | 19.8 | 21.9 | 20.5 | 19.5 | 19.4 | 22.1 | 20.8 | 24.3 | 26.2 | 28.6 | 26.7 | |
| 15.4 | 18.7 | 14.7 | 18.3 | 16.4 | 14.6 | 17.2 | 16.6 | 18.5 | 22.4 | 23.6 | 25.8 | 26.7 | 23.6 | 25.5 | 33.2 | 37.6 | 26.6 | |
| 18.5 | 21.0 | 22.7 | 25.5 | 28.1 | 29.0 | 29.8 | 29.5 | 32.5 | 34.6 | 34.3 | 32.1 | 33.0 | 26.7 | 26.9 | 26.3 | 27.4 | 22.6 | |
| 31.0 | 29.3 | 32.0 | 32.7 | 29.6 | 27.9 | 29.7 | 30.5 | 29.9 | 30.7 | 26.8 | 27.2 | 27.3 | 24.3 | 26.7 | 23.9 | 25.0 | 20.8 | |
| 8.2 | 9.7 | 10.9 | 10.8 | 11.8 | 12.2 | 13.8 | 12.5 | 11.6 | 12.2 | 13.2 | 14.0 | 16.6 | 18.8 | 22.4 | 20.3 | 21.8 | 20.2 | |
| 11.5 | 12.9 | 16.2 | 20.6 | 22.6 | 22.0 | 21.4 | 20.9 | 19.6 | 18.7 | 18.6 | 21.6 | 23.0 | 22.9 | 22.8 | 21.7 | 22.0 | 19.6 | |
| 37.5 | 36.9 | 34.7 | 39.1 | 36.5 | 28.2 | 27.7 | 29.2 | 31.8 | 33.8 | 30.6 | 34.6 | 36.0 | 30.0 | 29.6 | 25.5 | 25.5 | 18.2 | |
| 7.9 | 8.4 | 10.2 | 11.6 | 11.1 | 10.8 | 11.2 | 10.4 | 13.3 | 13.4 | 13.2 | 12.8 | 12.9 | 11.9 | 13.5 | 14.0 | 14.2 | 16.5 | |
| 42.2 | 41.8 | 38.0 | 35.9 | 28.6 | 21.9 | 20.4 | 15.4 | 15.4 | 15.8 | 14.6 | 14.0 | 15.7 | 13.8 | 14.0 | 12.2 | 10.9 | 10.7 |
- List of Russian federal subjects by murder rate
- Crime in South Africa (includes a table with the homicide rates from April 1994 to March 2011)
See also
- List of cities by murder rate
- List of countries by firearm-related death rate
- List of countries by incarceration rate
- List of countries by intentional death rate - homicide plus suicide.
- List of countries by intentional homicide rate by decade
- List of countries by life expectancy
- List of countries by suicide rate
- List of federal subjects of Russia by murder rate
- List of Mexican states by homicides
- List of U.S. states by homicide rate
Notes
- ↑ The 2013 PDF full report (Global Study on Homicide) has a methodological annex (pages 109ff) and a statistical annex (pages 121ff). The statistical annex has detailed charts for homicide counts and rates by country with data from 2000–2012. Map 7.2 on page 112 is a world map showing the homicide count for each country or territory. Page 21 states estimated total homicides of 437,000 worldwide. Figures 1.1 and 1.2 (pages 21 and 22) have exact rates and counts by regions. Figure 1.3 on page 23 is a bar chart of homicide rates for the subregions. Figure 1.16 on page 34 shows timeline graphs by subregion.
- ↑ The UNODC report has bar charts and timeline graphs of homicide rates for subregions. But the report does not list exact rate numbers. Subregion counts are not found in the report, but may be calculated by manually totaling the counts for each country in a subregion.
References
- 1 2 3 4 "UNODC Statistics Online". United Nations Office On Drugs and Crime. Retrieved 12 May 2018. ".
- ↑ Richards, Patsy (27 May 1999). "Homicide statistics, research paper 99/56" (PDF). London, UK: House of Commons of the United Kingdom library, Social and general statistics section. See page 7 for section called "Definition of the offence of homicide". See page 29 for table of nations and homicide rates for the years 1994-97. It also has further info on how homicide is defined across countries.
- ↑ Harris, Anthony R.; Stephen H. Thomas; Gene A. Fisher; David J. Hirsch (May 2002). "Murder and medicine: the lethality of criminal assault 1960–1999" (fee required). Homicide studies. 6 (2): 128–166. doi:10.1177/1088767902006002003.
- ↑ Fry, Don. Believing the news. ISBN 978-0-935742-11-4.
- ↑ Vizzard, William J. Shots in the dark. ISBN 978-0-8476-9560-7.
- ↑ Global Burden of Armed Violence Report (PDF) (report). Geneva, Switzerland: Geneva Declaration Secretariat. September 2008. pp. 67ff. ISBN 978-2-8288-0101-4.
data from 2004-2007
. The Geneva Declaration on Armed Violence and Development. - ↑ UNODC 2014, p. 12.
- ↑ Intentional homicide count and rate per 100,000 population, by country/territory (2000-2012). Data (in spreadsheet format) for UNODC report titled "Global Study on Homicide 2013". United Nations Office on Drugs and Crime (UNODC). Linked from Global Study on Homicide - Data: UNODC Homicide Statistics 2013
- ↑ 2011 Global Study on Homicide: Trends, Contexts, Data. "data from 2010 or latest available year". United Nations Office on Drugs and Crime (UNODC). Vienna, Austria.
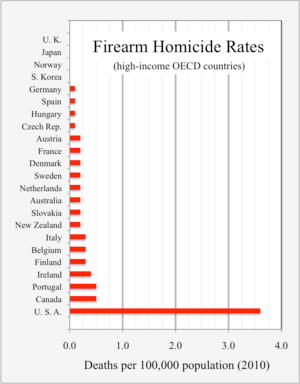
- ↑ Grinshteyn, Erin; Hemenway, David (March 2016). "Violent Death Rates: The US Compared with Other High-income OECD Countries, 2010". The American Journal of Medicine. 129 (3): 266–273. doi:10.1016/j.amjmed.2015.10.025. PMID 26551975. (Table 4). (PDF).
- ↑ UNODC 2014, p. 10.
- ↑ UNODC 2014, pp. 102-103.
- ↑ "Note of clarification about the Global Study on Homicide 2013". UNODC. 2 May 2014. Retrieved 9 May 2018.
- ↑ "Global Study on Homicide 2013: Executive Summary" (PDF). UNODC. p. 19. Retrieved 9 May 2018.
- 1 2 UNODC 2014, p. 99.
- ↑ UNODC 2014, p. 101.
- 1 2 UNODC 2014, p. 104.
- ↑ "Intentional homicide victims | Statistics and Data". dataunodc.un.org. Retrieved 2018-06-07.
- ↑ UNODC 2014, pp. 7-8.
- ↑ "Intentional Homicide Victims". UNODC. Retrieved 19 June 2018.
- 1 2 3 4 5 6 7 8 Dearden, Jack; Jones, Warwick. Homicide in Australia: 2006-07 National Homicide Monitoring Program annual report (PDF) (Report). Canberra: Australian Institute of Criminology. p. 113. Archived from the original (PDF) on 2012-11-16. Retrieved 2012-10-11.
- 1 2 3 4 5 6 7 8 Homicide Statistics: 2011 Australian Government report (Report). Canberra: Australian Institute of Criminology. Archived from the original on 2012-10-29. Retrieved 2016-02-15.
- 1 2 3 4 5 6 7 8 Recorded Crime-Victims (PDF) (Report). Canberra: Australian Bureau of Statistics. Retrieved 2016-02-15.
- ↑ "Canada Summary Tables". Statistics Canada. Retrieved 2016-12-03.
- 1 2 3 4 5 6 7 8 9 10 11 12 13 14 15 16 17 18 19 20 21 22 23 24 25 26 27 28 29 30 31 32 "Crime rates per 100,000 ihnabitants 1997-2017" (PDF) (in Spanish). Executive Secretariat of the National System for Public Security. 20 January 2018. p. 3. Retrieved 7 October 2018.
- 1 2 3 4 5 6 7 8 9 10 11 12 13 14 15 16 17 18 19 20 21 22 23 24 25 26 27 28 29 30 31 32 33 34 35 36 37 38 39 40 41 42 43 44 45 46 47 48 49 50 51 "State-by-state and National Crime Estimates by Year(s)". Federal Bureau of Investigation. Retrieved 2016-02-15.
- ↑ "UNODC Homicide Statistics". Universidad de Puerto Rico.
- ↑ "Homicide Trends 2003–2008". UNODC. Retrieved 2016-02-15.
- ↑ "Lista de unidades federativas do Brasil por taxa de homicídios", Wikipédia, a enciclopédia livre (in Portuguese), 2018-08-13, retrieved 2018-09-28
- Global Study on Homicide 2013: Trends, Contexts, Data (PDF). Vienna: United Nations Office on Drugs and Crime. March 2014. ISBN 9789210542050. Retrieved 9 May 2018.
External links

- The Homicide Monitor map. Made by Brazil-based think tank, The Igarapé Institute.