East North Central states
| East North Central Region | |
|---|---|
 | |
| Composition | |
| Metropolitan areas | |
| Largest city | Chicago |
| Area | |
| • Total | 299,170 sq mi (774,800 km2) |
| Population (2010 est.) | |
| • Total | 46,421,564 |
| • Density | 160/sq mi (60/km2) |
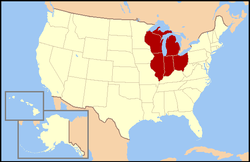
The East North Central states form one of the nine geographic subdivisions within the United States which are officially recognized by the United States Census Bureau. These states are near the Great Lakes.
The division contains five states: Illinois, Indiana, Michigan, Ohio, and Wisconsin. It is one of two divisions used to categorize the region of the U.S. generally called the "Midwest"; the other such division is the West North Central states (The Great Plains States). The region closely matches the area of the Northwest Territory, excepting a portion of Minnesota.
The East North Central division is a large part of the Great Lakes region, although the latter also includes Minnesota, New York, Pennsylvania, and the Canadian province of Ontario. It has a low rate of population growth and the estimated population as of 2015 is 46,787,011.[1] The region is part of the Great Lakes Megalopolis with an estimated 54 million people.
The Great Lakes provide access to the Atlantic Ocean via the Great Lakes Waterway and St. Lawrence Seaway, or by the Erie Canal and the Hudson River or via the Gulf of Mexico from the Mississippi River and the Illinois Waterway. Chicago and Detroit, two of the division's largest cities, are among the major ports of the United States.
Demographics
In 2010, the East North Central states (Great Lakes States) had a population of 46,421,564. This grew to an estimated 46,662,180 by 2013.[2] Illinois is the most populous state with 12,882,135 residents, while Wisconsin is the least populous state with 5,726,398 residents. Chicago is the region's most populous city and largest metropolitan area. According to the 2010 American Community Survey, 49.1% of the residents were male and 50.9% were female. Approximately 24.0% of the population were under 18 years of age, and 13.4% were over 65 years of age, and the median age for the region was 39.2.
In terms of race and ethnicity, White Americans made up 79.5% of the population, of which 75.7% were whites of non-Hispanic origin. Black Americans composed 12.1% of the region's population, of which 11.9% were blacks of non-Hispanic origin. American Indians and Alaskan Natives were 0.4% of the population and Asians were 2.7%. People who were of two or more races formed 2.1% of the population. And Hispanics and Latinos of any race made up 7.6%[3]
According to the 2010 Census, the top ten largest European ancestries were the following:[4]
German: 25.3 Irish: 12.5% English: 8.0 Polish: 6.5% Italian: 5.1% French and French Canadian: 3.5% Scandinavian: 3.5% (1.6% Norwegian, 1.5% Swedish, and 0.4% Danish) Dutch: 2.4% Scottish: 1.6% Hungarian: 0.9%
| State | 2010 population | Land area |
|---|---|---|
| Illinois | 12,882,135 | 57,915 |
| Indiana | 6,570,902 | 36,418 |
| Michigan | 9,895,622 | 96,716 |
| Ohio | 11,570,808 | 44,825 |
| Wisconsin | 5,726,398 | 65,497 |
| City | 2010 population | |
|---|---|---|
| 1 | Chicago, Illinois | 2,718,782 |
| 2 | Indianapolis, Indiana | 843,393 |
| 3 | Columbus, Ohio | 822,553 |
| 4 | Detroit, Michigan | 688,701 |
| 5 | Milwaukee, Wisconsin | 599,164 |
| 6 | Cleveland, Ohio | 390,113 |
| 7 | Cincinnati, Ohio | 297,517 |
| 8 | Toledo, Ohio | 282,313 |
| 9 | Fort Wayne, Indiana | 256,496 |
| 10 | Madison, Wisconsin | 243,344 |
| Metro Area (MSA) | 2010 population | |
|---|---|---|
| 1 | Chicago, IL-IN-WI | 9,537,289 |
| 2 | Detroit, MI | 4,294,983 |
| 3 | Cincinnati, OH-KY-IN | 2,137,406 |
| 4 | Cleveland, OH | 2,064,725 |
| 5 | Columbus, OH | 1,967,066 |
| 6 | Indianapolis, IN | 1,953,961 |
| 7 | Milwaukee, WI | 1,569,659 |
| 8 | Grand Rapids, MI | 1,016,603 |
| 9 | Dayton, OH | 802,489 |
| 10 | Akron, OH | 705,686 |
Language
English is, by far, the most common language spoken at home. Approximately 89.3% of all residents (38.3 million people) over the age of five spoke only English at home. Roughly 2,516,000 people (5.9% of the population) spoke Spanish at home, and roughly 2,016,000 people (5.8% of the population) spoke another languages at home. Slight around 270,000 (0.6%) spoke German at home, although this figure ranges from 2% to 37% in Northeast Ohio, which is also home to a large Amish community.[5][6]
Politics
| Parties | ||||
| Democratic-Republican | Democratic | Whig | Republican | Progressive |
- Bold denotes election winner.
References
- ↑ "Table 4".
- ↑ Bureau, U.S. Census. "American FactFinder - Results".
- ↑ "Archived copy". Archived from the original on 2014-03-05. Retrieved 2012-02-25.
- ↑ Bureau, U.S. Census. "American FactFinder - Results". Archived from the original on 2012-05-30.
- ↑ "Archived copy". Archived from the original on 2013-08-15. Retrieved 2013-08-10.
- ↑ "Archived copy". Archived from the original on 2011-12-30. Retrieved 2012-07-29.