Burlington (electoral district)
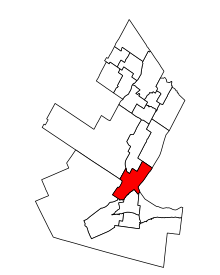 Burlington in relation to other Ontario electoral districts (2015 boundaries) | |||
| Federal electoral district | |||
| Legislature | House of Commons | ||
| MP |
Liberal | ||
| District created | 1976 | ||
| First contested | 1979 | ||
| Last contested | 2015 | ||
| District webpage | profile, map | ||
| Demographics | |||
| Population (2011)[1] | 120,569 | ||
| Electors (2015) | 94,679 | ||
| Area (km²)[2] | 84 | ||
| Pop. density (per km²) | 1,435.3 | ||
| Census divisions | Halton | ||
| Census subdivisions | Burlington | ||
.png)
Burlington is a federal electoral district in Halton Region, Ontario, Canada, that has been represented in the House of Commons of Canada since 1979.
Geography
It consists of the southern part of the city of Burlington, Ontario.
The riding consists of the neighbourhoods of Aldershot, Maple, Freeman, Wellington Square, Dynes, Roseland, Longmoor, Shoreacres, Pinedale, Elizabeth Gardens, Palmer, Mountainside, Brant Hills, and Tyandaga in Burlington.
History
Burlington was created in 1976 from Halton—Wentworth.
This riding gained small territories from Halton and Ancaster—Dundas—Flamborough—Westdale during the 2012 electoral redistribution.
Members of Parliament
This riding has elected the following Members of Parliament:
| Parliament | Years | Member | Party | |
|---|---|---|---|---|
| Burlington Riding created from Halton—Wentworth |
||||
| 31st | 1979–1980 | Bill Kempling | Progressive Conservative | |
| 32nd | 1980–1984 | |||
| 33rd | 1984–1988 | |||
| 34th | 1988–1993 | |||
| 35th | 1993–1997 | Paddy Torsney | Liberal | |
| 36th | 1997–2000 | |||
| 37th | 2000–2004 | |||
| 38th | 2004–2006 | |||
| 39th | 2006–2008 | Mike Wallace | Conservative | |
| 40th | 2008–2011 | |||
| 41st | 2011–2015 | |||
| 42nd | 2015–Present | Karina Gould | Liberal | |
Election results
| Canadian federal election, 2015 | ||||||||
|---|---|---|---|---|---|---|---|---|
| Party | Candidate | Votes | % | ±% | Expenditures | |||
| Liberal | Karina Gould | 32,229 | 45.98 | +22.74 | $104,313.08 | |||
| Conservative | Mike Wallace | 29,780 | 42.48 | -11.66 | $105,053.18 | |||
| New Democratic | David Laird | 6,381 | 9.10 | -9.75 | $28,503.64 | |||
| Green | Vince Fiorito | 1,710 | 2.44 | -1.10 | $1,631.97 | |||
| Total valid votes/Expense limit | 70,100 | 100.00 | $239,840.79 | |||||
| Total rejected ballots | 263 | 0.37 | ||||||
| Turnout | 70,363 | 73.58 | ||||||
| Eligible voters | 95,624 | |||||||
| Liberal gain from Conservative | Swing | +17.20 | ||||||
| Source: Elections Canada[3][4] | ||||||||
| 2011 federal election redistributed results[5] | |||
|---|---|---|---|
| Party | Vote | % | |
| Conservative | 33,162 | 54.14 | |
| Liberal | 14,235 | 23.24 | |
| New Democratic | 11,549 | 18.85 | |
| Green | 2,166 | 3.54 | |
| Others | 140 | 0.23 | |
| Canadian federal election, 2011 | ||||||||
|---|---|---|---|---|---|---|---|---|
| Party | Candidate | Votes | % | ±% | Expenditures | |||
| Conservative | Mike Wallace | 32,958 | 54.16 | +5.56 | $87,782.46 | |||
| Liberal | Alyssa Brierley | 14,154 | 23.26 | -9.99 | $83,688.54 | |||
| New Democratic | David Carter Laird | 11,449 | 18.81 | +7.61 | $17,387.19 | |||
| Green | Graham Mayberry | 2,151 | 3.53 | -3.40 | $4,138.76 | |||
| Marxist–Leninist | Elaine Baetz | 140 | 0.23 | – | ||||
| Total valid votes/Expense limit | 60,852 | 100.00 | – | $94,992.81 | ||||
| Total rejected ballots | 175 | 0.29 | -0.12 | |||||
| Turnout | 61,027 | 67.02 | +2.03 | |||||
| Eligible voters | 91,058 | – | – | |||||
| Canadian federal election, 2008 | ||||||||
|---|---|---|---|---|---|---|---|---|
| Party | Candidate | Votes | % | ±% | Expenditures | |||
| Conservative | Mike Wallace | 28,614 | 48.60 | +5.50 | $82,440 | |||
| Liberal | Paddy Torsney | 19,577 | 33.25 | -5.86 | $86,026 | |||
| New Democratic | David Carter Laird | 6,597 | 11.20 | -1.24 | $21,862 | |||
| Green | Marnie Mellish | 4,083 | 6.93 | +1.60 | $2,280 | |||
| Total valid votes/Expense limit | 58,871 | 100.00 | – | $92,099 | ||||
| Total rejected ballots | 239 | 0.40 | +0.05 | |||||
| Turnout | 59,110 | 64.99 | ||||||
| Canadian federal election, 2006 | ||||||||
|---|---|---|---|---|---|---|---|---|
| Party | Candidate | Votes | % | ±% | ||||
| Conservative | Mike Wallace | 28,030 | 43.10 | +4.8 | ||||
| Liberal | Paddy Torsney | 25,431 | 39.11 | -5.9 | ||||
| New Democratic | David Carter Laird | 8,090 | 12.44 | +1.6 | ||||
| Green | Rick Goldring | 3,471 | 5.33 | +0.1 | ||||
| Total valid votes | 65,022 | 100.0 | ||||||
| Total rejected ballots | 227 | 0.35 | ||||||
| Turnout | 65,249 | 72.96 | ||||||
| Canadian federal election, 2004 | ||||||||
|---|---|---|---|---|---|---|---|---|
| Party | Candidate | Votes | % | ±% | ||||
| Liberal | Paddy Torsney | 27,423 | 45.0 | -1.8 | ||||
| Conservative | Mike Wallace | 23,389 | 38.4 | -9.6 | ||||
| New Democratic | David Carter Laird | 6,581 | 10.8 | +7.2 | ||||
| Green | Angela Reid | 3,169 | 5.2 | |||||
| Christian Heritage | John Herman Wubs | 429 | 0.7 | |||||
| Total valid votes | 60,991 | 100.0 | ||||||
Note: Conservative vote is compared to the total of the Canadian Alliance vote and Progressive Conservative vote in 2000 election.
| Canadian federal election, 2000 | ||||||||
|---|---|---|---|---|---|---|---|---|
| Party | Candidate | Votes | % | ±% | ||||
| Liberal | Paddy Torsney | 22,175 | 46.8 | +2.7 | ||||
| Alliance | Don Pennell | 11,500 | 24.3 | +6.9 | ||||
| Progressive Conservative | Stephen Collinson | 11,240 | 23.7 | -9.0 | ||||
| New Democratic | Larry McMahon | 1,722 | 3.6 | -1.5 | ||||
| Green | Tom Snyder | 771 | 1.6 | |||||
| Total valid votes | 47,408 | 100.0 | ||||||
Note: Canadian Alliance vote is compared to the Reform vote in 1997 election.
| Canadian federal election, 1997 | ||||||||
|---|---|---|---|---|---|---|---|---|
| Party | Candidate | Votes | % | ±% | ||||
| Liberal | Paddy Torsney | 22,042 | 44.1 | 0.0 | ||||
| Progressive Conservative | Mike Kuegle | 16,344 | 32.7 | +6.5 | ||||
| Reform | Terry Lamping | 8,662 | 17.3 | -5.9 | ||||
| New Democratic | Jim Hough | 2,561 | 5.1 | +2.1 | ||||
| Canadian Action | Ann Marsden | 352 | 0.7 | |||||
| Total valid votes | 49,961 | 100.0 | ||||||
| Canadian federal election, 1993 | ||||||||
|---|---|---|---|---|---|---|---|---|
| Party | Candidate | Votes | % | ±% | ||||
| Liberal | Paddy Torsney | 22,785 | 44.1 | +17.5 | ||||
| Progressive Conservative | Mike Kuegle | 13,540 | 26.2 | -25.9 | ||||
| Reform | Hugh Ramolla | 11,984 | 23.2 | |||||
| New Democratic | Jim Hough | 1,554 | 3.0 | -13.1 | ||||
| Independent | Bill Barlett | 929 | 1.8 | |||||
| National | Bill Watson | 535 | 1.0 | |||||
| Natural Law | Ursula Kropfel | 336 | 0.7 | |||||
| Total valid votes | 51,663 | 100.0 | ||||||
| Canadian federal election, 1988 | ||||||||
|---|---|---|---|---|---|---|---|---|
| Party | Candidate | Votes | % | ±% | ||||
| Progressive Conservative | Bill Kempling | 26,293 | 52.1 | -9.9 | ||||
| Liberal | James Smith | 13,448 | 26.6 | +7.8 | ||||
| New Democratic | Jane Mulkewich | 8,149 | 16.1 | -3.1 | ||||
| Christian Heritage | Ron Bremer | 2,285 | 4.5 | |||||
| Libertarian | Dan Riga | 321 | 0.6 | |||||
| Total valid votes | 50,496 | 100.0 | ||||||
| Canadian federal election, 1984 | ||||||||
|---|---|---|---|---|---|---|---|---|
| Party | Candidate | Votes | % | ±% | ||||
| Progressive Conservative | Bill Kempling | 37,577 | 61.9 | +11.2 | ||||
| New Democratic | Walter Mulkewich | 11,687 | 19.3 | +3.6 | ||||
| Liberal | Fred Schwenger | 11,406 | 18.8 | -14.0 | ||||
| Total valid votes | 60,670 | 100.0 | ||||||
| Canadian federal election, 1980 | ||||||||
|---|---|---|---|---|---|---|---|---|
| Party | Candidate | Votes | % | ±% | ||||
| Progressive Conservative | Bill Kempling | 27,212 | 50.8 | -5.6 | ||||
| Liberal | Tom Sutherland | 17,574 | 32.8 | +4.6 | ||||
| New Democratic | Danny Dunleavy | 8,421 | 15.7 | +1.0 | ||||
| Libertarian | Bruno S. Oberski | 341 | 0.6 | 0.0 | ||||
| Marxist–Leninist | Charles Boylan | 63 | 0.1 | 0.0 | ||||
| Total valid votes | 53,611 | 100.0 | ||||||
| Canadian federal election, 1979 | ||||||||
|---|---|---|---|---|---|---|---|---|
| Party | Candidate | Votes | % | |||||
| Progressive Conservative | Bill Kempling | 32,225 | 56.4 | |||||
| Liberal | Tom Sutherland | 16,100 | 28.2 | |||||
| New Democratic | Danny Dunleavy | 8,421 | 14.7 | |||||
| Libertarian | John Lawson | 365 | 0.6 | |||||
| Marxist–Leninist | Charles Boylan | 62 | 0.1 | |||||
| Total valid votes | 57,173 | 100.0 | ||||||
See also
References
- "(Code 35010) Census Profile". 2011 census. Statistics Canada. 2012. Retrieved 2012-03-02.
- Federal riding history from the Library of Parliament
- Burlington District
- Campaign expense data from Elections Canada
.png)