Greater Manila Area
The Greater Manila Area generally refers to the contiguous urbanization surrounding Metro Manila, and ambiguously there are several terms.
Definitions
Greater Manila Area may describe:
- Metro Manila, a first-level administrative unit of Philippines under the governance of Metropolitan Manila Development Authority, considered the core of the greater metro area.
- A term in common usage, Mega Manila, is used to describe a region that is bound to Manila economically. There are 2 definitions. Both terms are based on administrative divisions (entire provinces) that encompass wide ranges of settlements and/or rural areas and do not take into account huge differences among localities.
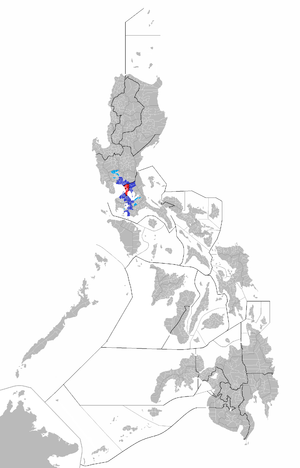
- The built-up area surrounding Manila, which is constantly being developed. (It can be seen by air or satellite and does not fit neatly into provinces, or even city limits). To disambiguate from the two above terms which are in common use, it may be deemed Greater Manila Area. This article is about this contiguous built-up zone. The built-up zone covers Metro Manila as well as parts of the neighboring provinces of Laguna, Cavite, Rizal, Bulacan, Pampanga, Batangas, Tarlac and Nueva Ecija. Though sprawl continues to absorb new zones, some urban zones (notably Angeles and San Fernando of Pampanga) are independent clusters of settlements surrounded by non-urban areas; Manila's belt of urbanization has yet to absorb them.
Province-level data
Of the above-mentioned provinces, there are stark development contrasts ranging from dense suburban to rural areas within a province.
Overall, the density of provinces around Metro Manila is far higher than the national average. Cavite and Batangas, for example, is 1,888.9 per square km or 6.17 times the national average. Similarly, Rizal, Laguna, Bulacan, Pampanga, Tarlac and Nueva Ecija all have population density over twice the national average of 306 per square km. The sum total population of these provinces ignoring finer details of locality data, is about 25.5 million using 2010 census figures.
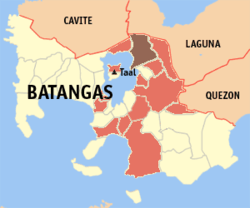
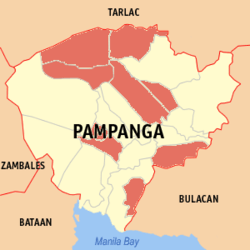

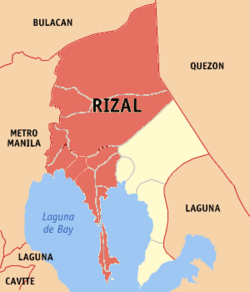
Table 1
Localities which have at least 1,000 people per square kilometer and are in a contiguous 1,000+ people/km2 density zone with Metro Manila:
| Region | Population (2010 Census figures)[1] | Area (km²) | Density (per km²) |
|---|---|---|---|
| Metro Manila | 11,553,427 | 636 | 18,166 |
| Lipa, Batangas | 260,568 | 209.4 | 2,942.2 |
| Santo Tomas | 113,105 | 95.41 | 1,185.5 |
| Tanauan*, Batangas | 142,537 | 147.2 | 968 |
| Malvar | 41,730 | 33.0 | 1,264.5 |
| Padre Garcia | 42,942 | 41.51 | 1,264.5 |
| Mataas na Kahoy | 25,400 | 22.1 | 1,149.3 |
| San Jose | 61,307 | 53.29 | 1,150.4 |
| San Pascual | 57,200 | 50.7 | 1,128.2 |
| Batangas City | 295,231 | 282.96 | 1,150.4 |
| Talisay | 39,120 | 28.2 | 1,387.2 |
| Bauan | 79,831 | 53.3 | 1,497.7 |
| Batangas Subtotal | 1,158,971 | 1017.07 | 1,139.5 |
| Meycauayan | 196,569 | 22.10 | 8,894 |
| Marilao | 160,452 | 26.25 | 6,112 |
| Santa Maria | 205,258 | 90.92 | 2,258 |
| San Jose del Monte | 439,090 | 165.10 | 2,659 |
| Bocaue | 105,817 | 31.87 | 3,320 |
| Malolos | 223,069 | 67.30 | 3,314 |
| Balagtas, Bulacan | 62,684 | 32.05 | 1,956 |
| Bulacan, Bulacan* | 72,289 | 72.9 | 972.5 |
| Guiguinto | 89,225 | 21.48 | 4,153 |
| Plaridel, Bulacan | 99,817 | 41.0 | 2,434 |
| Pandi, Bulacan | 60,637 | 31.7 | 1,912 |
| Calumpit, Bulacan | 98,017 | 56.25 | 1,442 |
| Pulilan, Bulacan | 85,008 | 30 | 2,834 |
| Hagonoy, Bulacan | 126,329 | 103.10 | 1,225.3 |
| Baliuag, Bulacan | 136,982 | 41.88 | 3,270 |
| Obando, Bulacan | 56,258 | 52.1 | 1,079.8 |
| Paombong, Bulacan | 53,510 | 46.3 | 1,155.7 |
| Bulacan Subtotal | 2,271,011 | 919.58 | 2,470 |
| Trece Martires | 155,713 | 39.10 | 4,000 |
| Bacoor | 441,197 | 52.4 | 8,419 |
| Imus | 253,158 | 64.7 | 3,912 |
| Kawit | 76,405 | 16.7 | 4,575 |
| General Trias | 218,387 | 108.7 | 2,009 |
| Gen. Mariano Alvarez, Cavite | 136,613 | 11.4 | 11,983 |
| Carmona | 68,135 | 30.9 | 2,205 |
| Cavite City | 104,581 | 20.8 | 5,028 |
| Tanza | 171,795 | 98.2 | 1,749 |
| Rosario | 94,228 | 8.2 | 11,491 |
| Noveleta | 46,336 | 8.6 | 8,565 |
| Naic | 87,058 | 86.0 | 1,012 |
| Silang* | 199,285 | 209.4 | 952 |
| Cavite Subtotal | 2,609,221 | 845.2 | 5,069 |
| San Pedro | 281,808 | 24.05 | 11,717.6 |
| Biñan | 262,735 | 39.1 | 6,827 |
| Santa Rosa | 266,943 | 39.1 | 6,827 |
| Cabuyao | 205,376 | 43.3 | 4,743 |
| Calamba | 360,281 | 144.8 | 2,488 |
| Los Baños | 109,210 | 56.5 | 1,746 |
| Bay | 50,756 | 42.66 | 1,189.8 |
| San Pablo | 237,259 | 197.6 | 1,200 |
| Laguna Subtotal | 1,763,789 | 587.11 | 3004.18 |
| Apalit, Pampanga | 97,296 | 72.14 | 1,348.7 |
| Masantol, Pampanga | 50,984 | 48.25 | 1,056.6 |
| Pampanga Subtotal | 148,280 | 120.39 | 1,231.6 |
| Antipolo | 633,971 | 306.10 | 2,071.12 |
| Cainta | 289,833 | 26.81 | 10,810.63 |
| San Mateo | 184,860 | 55.09 | 3,355.60 |
| Taytay | 262,485 | 38.80 | 6,765.08 |
| Angono | 97,209 | 26.22 | 3,707.44 |
| Binangonan | 238,931 | 66.34 | 3,601.61 |
| Rodriguez | 223,594 | 172.85 | 1,293.57 |
| Cardona | 44,942 | 28.56 | 1,573.6 |
| Morong | 50,538 | 37.58 | 1,344.8 |
| Teresa | 44,436 | 18.61 | 2,387.7 |
| Rizal Subtotal | 2,070,799 | 776.96 | 2,665.2 |
| Totals of contiguous localities* | 21,419,785 | 4,863.21 | 4,404.45 |
Notes:
- This city is included because its current population is projected to exceed 1,000 people per square km and completely surrounded by localities that match these criteria, as well as possibility of an undercount.
- Localities densities of 1,000 people/km2 in a contiguous 1,000+ people/km2 density zone with Metro Manila
Table 2
Localities not contiguous with Metro Manila's 1000+ people/km2 density zone, but with a density over 1000:
| Locality | Population (2010 Census figures)[1] | Area (km²) | Density (per km²) |
|---|---|---|---|
| Taal, Batangas | 39,120 | 28.2 | 1,729.1 |
| Santa Teresita, Batangas | 16,891 | 16.3 | 1,036.2 |
| San Nicolas, Batangas | 19,046 | 14.3 | 1,331.8 |
| Mendez, Cavite | 26,757 | 20.7 | 1,292.6 |
| Victoria, Laguna | 33,829 | 22.35 | 1,513.6 |
| Pagsanjan, Laguna | 35,944 | 26.36 | 1,363.6 |
| Pila, Laguna | 44,227 | 31.2 | 1,417.5 |
| Santa Cruz, Laguna | 101,914 | 38.59 | 2,640.9 |
| Guagua, Pampanga | 104,284 | 31.19 | 3,343.5 |
| Angeles, Pampanga | 314,493 | 66.16 | 4,753.52 |
| Mabalacat, Pampanga | 203,307 | 165.8 | 1,226.22 |
| Magalang, Pampanga | 98,595 | 97.32 | 1,013.1 |
| Mexico, Pampanga | 141,298 | 117.41 | 1,203.5 |
| Santa Ana, Pampanga | 49,756 | 39.84 | 1,248.9 |
| Santa Rita, Pampanga | 36,723 | 29.76 | 1,233.9 |
| San Fernando, Pampanga | 269,365 | 67.74 | 3,977 |
| Totals | 1,132,242 | 647.42 | 2,058 |
See also
References
- 1 2 "Total Population and Annual Population Growth Rates by Region: Population Censuses 1995, 2000, and 2007". National Statistics Office of the Philippines. Archived from the original on 20 November 2008. Retrieved 21 December 2009.