Bramalea—Gore—Malton
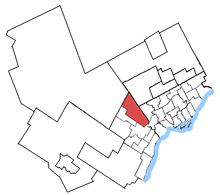 Bramalea—Gore—Malton in relation to neighbouring electoral districts | |
| Coordinates: |
43°43′24″N 79°41′34″W / 43.72333°N 79.69278°WCoordinates: 43°43′24″N 79°41′34″W / 43.72333°N 79.69278°W Location of the constituency office in Brampton (as of 3 September 2010) |
| Defunct federal electoral district | |
| Legislature | House of Commons |
| District created | 1987 |
| District abolished | 2013 |
| First contested | 1988 |
| Last contested | 2011 |
| District webpage | profile, map |
| Demographics | |
| Population (2011)[1] | 192,020 |
| Electors (2011) | 100,002 |
| Area (km²)[2] | 143.04 |
| Census divisions | Peel |
| Census subdivisions | Mississauga, Brampton |
.png)
Bramalea—Gore—Malton (formerly known as Brampton—Malton and Bramalea—Gore—Malton—Springdale) was a federal electoral district in Ontario, Canada, that was represented in the House of Commons of Canada. In 2015, it was dissolved into the ridings of Brampton East, Mississauga—Malton, Brampton Centre and Brampton North.
The district was created as "Brampton—Malton" in 1987 from Brampton—Georgetown and Mississauga North. The name was changed to "Bramalea—Gore—Malton" in 1990, and to "Bramalea—Gore—Malton—Springdale" in 1998
In 2003, Bramalea—Gore—Malton—Springdale was abolished when it was redistributed between a new "Bramalea—Gore—Malton", Brampton—Springdale and Mississauga—Brampton South ridings.
In 2001, it had a population of 119,886 and an area of 151 km2.
It includes the neighbourhoods of Colerane, Ebenezer, Woodhill, Bramalea and Gorewood Acres in the City of Brampton and the neighbourhoods of Malton, Marvin Heights and Ridgewood in the City of Mississauga.
41.9% of people in Bramalea—Gore—Malton are of East Indian ethnic origin, the highest such percentage in Canada.[3] Slightly more than a quarter of the population (25.1%) are immigrants from Southern Asia, which is also the highest such figure for any riding.[4][5]
Member of Parliament
This riding has elected the following Member of Parliament:
| Parliament | Years | Member | Party | |
|---|---|---|---|---|
| Brampton—Malton Riding created from Brampton—Georgetown and Mississauga North |
||||
| 34th | 1988–1993 | Harry Chadwick | Progressive Conservative | |
| Bramalea—Gore—Malton | ||||
| 35th | 1993–1997 | Gurbax Singh Malhi | Liberal | |
| 36th | 1997–2000 | |||
| Bramalea—Gore—Malton—Springdale | ||||
| 37th | 2000–2004 | Gurbax Singh Malhi | Liberal | |
| Bramalea—Gore—Malton | ||||
| 38th | 2004–2006 | Gurbax Singh Malhi | Liberal | |
| 39th | 2006–2008 | |||
| 40th | 2008–2011 | |||
| 41st | 2011–2015 | Bal Gosal | Conservative | |
| Riding dissolved into Brampton East, Mississauga—Malton, Brampton Centre and Brampton North |
||||
Federal election results
| Canadian federal election, 2011 | ||||||||
|---|---|---|---|---|---|---|---|---|
| Party | Candidate | Votes | % | ±% | Expenditures | |||
| Conservative | Bal Gosal | 19,907 | 34.44 | -2.68 | – | |||
| New Democratic | Jagmeet Singh Dhaliwal | 19,368 | 33.51 | +24.49 | – | |||
| Liberal | Gurbax Singh Malhi | 16,402 | 29.40 | -15.65 | – | |||
| Green | John Moulton | 1,748 | 3.02 | -2.14 | – | |||
| Marxist–Leninist | Frank Chilelli | 371 | 0.64 | +0.02 | ||||
| Total valid votes | 57,796 | 100.00 | – | |||||
| Total rejected ballots | 454 | 0.80 | +0.18 | |||||
| Turnout | 58,250 | 54.75 | +5.01 | – | ||||
| Eligible voters | 106,395 | – | – | |||||
| Canadian federal election, 2008 | ||||||||
|---|---|---|---|---|---|---|---|---|
| Party | Candidate | Votes | % | ±% | Expenditures | |||
| Liberal | Gurbax Singh Malhi | 22,272 | 45.05 | -5.7 | $85,496 | |||
| Conservative | Stella Ambler | 18,353 | 37.12 | +4.6 | $91,704 | |||
| New Democratic | Jash Puniya | 5,945 | 12.02 | -0.8 | $21,613 | |||
| Green | Mark Pajot | 2,551 | 5.16 | +1.8 | $869 | |||
| Marxist–Leninist | Frank Chilelli | 309 | 0.62 | +0.1 | ||||
| Total valid votes/Expense limit | 49,430 | 100.00 | $97,671 | |||||
| Total rejected ballots | 307 | 0.62 | – | |||||
| Turnout | 49,737 | 49.74 | – | – | ||||
| Canadian federal election, 2006 | ||||||||
|---|---|---|---|---|---|---|---|---|
| Party | Candidate | Votes | % | ±% | ||||
| Liberal | Gurbax Singh Malhi | 25,349 | 50.7 | +1.2 | ||||
| Conservative | John Sprovieri | 16,310 | 32.6 | +2.0 | ||||
| New Democratic | Cesar Martello | 6,400 | 12.8 | -2.1 | ||||
| Green | Ernst Braendli | 1,721 | 3.4 | -1.1 | ||||
| Marxist–Leninist | Frank Chilelli | 233 | 0.5 | -0.1 | ||||
| Total valid votes | 50,013 | 100.0 | ||||||
| Canadian federal election, 2004 | ||||||||
|---|---|---|---|---|---|---|---|---|
| Party | Candidate | Votes | % | ±% | ||||
| Liberal | Gurbax Singh Malhi | 20,394 | 49.5 | -7.5 | ||||
| Conservative | Raminder Gill | 12,594 | 30.6 | -3.9 | ||||
| New Democratic | Fernando Miranda | 6,113 | 15.0 | 10.0 | ||||
| Green | Sharleen McDowall | 1,832 | 4.5 | |||||
| Marxist–Leninist | Frank Chilelli | 237 | 0.6 | -0.1 | ||||
| Total valid votes | 41,170 | 100.0 | ||||||
Note: Conservative vote is compared to the total of the Canadian Alliance vote and Progressive Conservative vote in 2000 election.
Bramalea—Gore—Malton—Springdale
| Canadian federal election, 2000 | ||||||||
|---|---|---|---|---|---|---|---|---|
| Party | Candidate | Votes | % | ±% | ||||
| Liberal | Gurbax Malhi | 21,917 | 57.1 | +10.7 | ||||
| Alliance | Gurdish Mangat | 7,214 | 18.8 | -2.5 | ||||
| Progressive Conservative | Danny Varaich | 6,019 | 15.7 | -10.4 | ||||
| New Democratic | Vishnu Roche | 1,864 | 4.9 | -0.7 | ||||
| Independent | Gurinder Malhi | 783 | 2.0 | |||||
| Communist | Jim R. Bridgewood | 350 | 0.9 | |||||
| Marxist–Leninist | David Greig | 269 | 0.7 | 0.0 | ||||
| Total valid votes | 38,416 | 100.0 | ||||||
Note: Canadian Alliance vote is compared to the Reform vote in 1997 election.
| Canadian federal election, 1997 | ||||||||
|---|---|---|---|---|---|---|---|---|
| Party | Candidate | Votes | % | ±% | ||||
| Liberal | Gurbax Malhi | 18,933 | 46.4 | +3.5 | ||||
| Progressive Conservative | Beryl Ford | 10,655 | 26.1 | +7.1 | ||||
| Reform | Darlene Florence | 8,685 | 21.3 | -8.2 | ||||
| New Democratic | Abdul Majeed | 2,281 | 5.6 | +0.5 | ||||
| Marxist–Leninist | Philip Fernandez | 279 | 0.7 | +0.5 | ||||
| Total valid votes | 40,833 | 100.0 | ||||||
| Canadian federal election, 1993 | ||||||||
|---|---|---|---|---|---|---|---|---|
| Party | Candidate | Votes | % | ±% | ||||
| Liberal | Gurbax Malhi | 16,530 | 42.9 | +8.5 | ||||
| Reform | Darlene Florence | 11,376 | 29.5 | |||||
| Progressive Conservative | Harry Chadwick | 7,338 | 19.0 | -22.5 | ||||
| New Democratic | Paul Ledgister | 1,977 | 5.1 | -17.3 | ||||
| National | Jack Ardis | 480 | 1.2 | |||||
| Natural Law | Bill Davies | 279 | 0.7 | |||||
| Independent | John E. Maxwell | 261 | 0.7 | |||||
| Green | Bill Emms | 215 | 0.6 | |||||
| Marxist–Leninist | Iqbai Sumbal | 89 | 0.2 | -0.1 | ||||
| Total valid votes | 38,545 | 100.0 | ||||||
Brampton—Malton
| Canadian federal election, 1988 | ||||||||
|---|---|---|---|---|---|---|---|---|
| Party | Candidate | Votes | % | |||||
| Progressive Conservative | Harry Chadwick | 16,427 | 41.5 | |||||
| Liberal | Gurjit Grewal | 13,612 | 34.4 | |||||
| New Democratic | Paul Ledgister | 8,887 | 22.5 | |||||
| Libertarian | Karl von Harten | 350 | 0.9 | |||||
| Communist | Jim R. Bridgewood | 158 | 0.4 | |||||
| Independent | Iqbai Sumbal | 112 | 0.3 | |||||
| Total valid votes | 39,546 | 100.0 | ||||||
See also
References
- "(Code 35006) Census Profile". 2011 census. Statistics Canada. 2012. Retrieved 2012-03-01.
- Federal riding history:
- Campaign expense data from Elections Canada
Notes
- ↑ Statistics Canada
- ↑ Statistics Canada
- ↑ "2Profile of Ethnic Origin and Visible Minorities for Canada, Provinces, Territories and Federal Electoral Districts (2003 Representation Order), 2006 Census". 2.statcan.gc.ca. Retrieved 2012-12-02.
- ↑ "Immigrant Status and Place of Birth (38), Sex (3) and Age Groups (10) for the Population of Canada, Provinces, Territories and Federal Electoral Districts (2003 Representation Order), 2006 Census - 20% Sample Data". 2.statcan.gc.ca. Retrieved 2012-11-23.
- ↑ "Appendix J Comparison of places of birth disseminated in 2006, 2001 and 1996". 2.statcan.ca. 2009-11-20. Retrieved 2012-11-30.