Vladimirci
Vladimirci (Serbian Cyrillic: Владимирци) is a village and municipality located in the Mačva District of western Serbia. According to the 2011 census results, the population of the village is 1,898, while population of the municipality is 14,546.
Vladimirci Владимирци | |
|---|---|
Town and municipality | |
 House in front of which is monument to Milovan Glišić | |
 Coat of arms | |
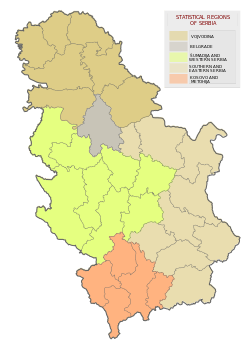
 Location of the municipality of Vladimirci within Serbia | |
| Coordinates: 44°37′N 19°47′E | |
| Country | |
| Region | Šumadija and Western Serbia |
| District | Mačva |
| Municipality status | 11 December 1924 |
| Settlements | 29 |
| Government | |
| • Mayor | Mijailo Milovanović (SRS) |
| Area | |
| • Town | 9.46 km2 (3.65 sq mi) |
| • Municipality | 338 km2 (131 sq mi) |
| Elevation | 103 m (338 ft) |
| Population (2011 census)[2] | |
| • Town | 1,898 |
| • Town density | 200/km2 (520/sq mi) |
| • Municipality | 14,546 |
| • Municipality density | 43/km2 (110/sq mi) |
| Time zone | UTC+1 (CET) |
| • Summer (DST) | UTC+2 (CEST) |
| Postal code | 15225 |
| Area code | +381(0)15 |
| Car plates | ŠA |
| Website | www |
Name
The name of the settlement in Serbian is in the plural, and therefore it is grammatically correct to refer to it as "Vladimirci are" instead of "Vladimirci is". A hypothetical singular version of the name would be Vladimirac.
History
On 11 December 1924, King of Yugoslavia Alexander I declared Vladimirci a municipality.
Settlements
Aside from the town of Vladimirci, the municipality includes the following settlements:
Demographics
| Historical population | ||
|---|---|---|
| Year | Pop. | ±% p.a. |
| 1948 | 28,643 | — |
| 1953 | 30,068 | +0.98% |
| 1961 | 28,281 | −0.76% |
| 1971 | 26,729 | −0.56% |
| 1981 | 25,281 | −0.56% |
| 1991 | 23,335 | −0.80% |
| 2002 | 20,373 | −1.23% |
| 2011 | 17,462 | −1.70% |
| Source: [3] | ||
According to the 2011 census results, the municipality of Vladimirci has 17,462 inhabitants.
Ethnic groups
The ethnic composition of the municipality:[4]
| Ethnic group | Population | % |
|---|---|---|
| Serbs | 16,799 | 96.20% |
| Roma | 181 | 1.04% |
| Croats | 20 | 0.11% |
| Macedonians | 17 | 0.10% |
| Romanians | 14 | 0.08% |
| Bunjevci | 12 | 0.07% |
| Montenegrins | 11 | 0.06% |
| Slovaks | 7 | 0.04% |
| Yugoslavs | 7 | 0.04% |
| Macedonians | 7 | 0.04% |
| Others | 387 | 2.22% |
| Total | 17,462 |
Economy
The following table gives a preview of total number of employed people per their core activity (as of 2017):[5]
| Activity | Total |
|---|---|
| Agriculture, forestry and fishing | 42 |
| Mining | 37 |
| Processing industry | 880 |
| Distribution of power, gas and water | 6 |
| Distribution of water and water waste management | 52 |
| Construction | 92 |
| Wholesale and retail, repair | 377 |
| Traffic, storage and communication | 81 |
| Hotels and restaurants | 46 |
| Media and telecommunications | 15 |
| Finance and insurance | 4 |
| Property stock and charter | 1 |
| Professional, scientific, innovative and technical activities | 63 |
| Administrative and other services | 10 |
| Administration and social assurance | 151 |
| Education | 242 |
| Healthcare and social work | 147 |
| Art, leisure and recreation | 16 |
| Other services | 32 |
| Total | 2,296 |
Gallery
 Panorama of Vladimirci
 Town buildings
 Town buildings
 Town park
See also
- List of places in Serbia
References
- "Municipalities of Serbia, 2006". Statistical Office of Serbia. Retrieved 2010-11-28.
- "2011 Census of Population, Households and Dwellings in the Republic of Serbia: Comparative Overview of the Number of Population in 1948, 1953, 1961, 1971, 1981, 1991, 2002 and 2011, Data by settlements" (PDF). Statistical Office of Republic Of Serbia, Belgrade. 2014. ISBN 978-86-6161-109-4. Retrieved 2014-06-27.
- "2011 Census of Population, Households and Dwellings in the Republic of Serbia" (PDF). stat.gov.rs. Statistical Office of the Republic of Serbia. Retrieved 18 August 2017.
- "Population by ethnicity and sex, by municipalities and cities" (PDF). stat.gov.rs. Statistical Office of Serbia. Retrieved 18 August 2017.
- "ОПШТИНЕ И РЕГИОНИ У РЕПУБЛИЦИ СРБИЈИ, 2018" (PDF). stat.gov.rs (in Serbian). Statistical Office of the Republic of Serbia. Retrieved 16 March 2019.
External links
| Wikimedia Commons has media related to Vladimirci. |
Seat: Vladimirci | ||
| Villages (2002 population) |
| |
| Landmarks |
| |