Vlasotince
Vlasotince (Serbian Cyrillic: Власотинце) is a town and municipality located in Jablanica District of southern Serbia. As of 2011, the municipality has 29,669 inhabitants, while the town itself has a population of 15,830 inhabitants.
Vlasotince Власотинце | |
|---|---|
Town and municipality | |
 Vlasotince, town centre | |
 Coat of arms | |
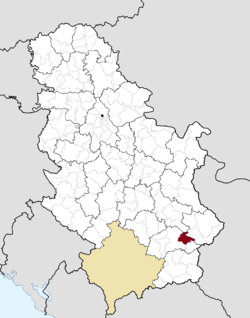 Location of the municipality of Vlasotince within Serbia | |
| Coordinates: 42°58′N 22°08′E | |
| Country | |
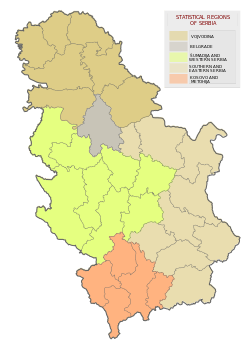
| Region | Southern and Eastern Serbia |
| District | Jablanica |
| Settlements | 48 |
| Area | |
| • Town | 15.91 km2 (6.14 sq mi) |
| • Municipality | 308 km2 (119 sq mi) |
| Elevation | 234 m (768 ft) |
| Population (2011 census)[2] | |
| • Town | 15,830 |
| • Town density | 990/km2 (2,600/sq mi) |
| • Municipality | 29,669 |
| • Municipality density | 96/km2 (250/sq mi) |
| Time zone | UTC+1 (CET) |
| • Summer (DST) | UTC+2 (CEST) |
| Postal code | 16210 |
| Area code | +381(0)16 |
| Car plates | VL |
| Website | vlasotince |

History
According to Turkish records, the town existed in the 15th century as a Turkish administrative center. After the Turks were forced out of Serbia, locals started growing wine grapes as a kind of complementary business to their building activities. They made Vlasotince the number one wine region in the former Yugoslavia and furthermore the biggest wine exporter in the Balkans. The craftsmanship and building skills of workers and builders from this region were appreciated in the former Yugoslavia and its surrounding neighbours until the Yugoslav Wars.
Settlements
Aside from the town of Vlasotince, the municipality includes the following settlements:
Demographics
| Historical population | ||
|---|---|---|
| Year | Pop. | ±% p.a. |
| 1948 | 33,845 | — |
| 1953 | 35,224 | +0.80% |
| 1961 | 35,625 | +0.14% |
| 1971 | 36,022 | +0.11% |
| 1981 | 35,863 | −0.04% |
| 1991 | 34,302 | −0.44% |
| 2002 | 33,312 | −0.27% |
| 2011 | 29,893 | −1.20% |
| Source: [3] | ||
According to the 2011 census results, the municipality of Vlasotince has a population of 29,893 inhabitants.
Economy
The following table gives a preview of total number of registered people employed in legal entities per their core activity (as of 2018):[4]
| Activity | Total |
|---|---|
| Agriculture, forestry and fishing | 46 |
| Mining and quarrying | 34 |
| Manufacturing | 2,446 |
| Electricity, gas, steam and air conditioning supply | 23 |
| Water supply; sewerage, waste management and remediation activities | 131 |
| Construction | 780 |
| Wholesale and retail trade, repair of motor vehicles and motorcycles | 810 |
| Transportation and storage | 119 |
| Accommodation and food services | 194 |
| Information and communication | 19 |
| Financial and insurance activities | 33 |
| Real estate activities | 2 |
| Professional, scientific and technical activities | 152 |
| Administrative and support service activities | 48 |
| Public administration and defense; compulsory social security | 272 |
| Education | 452 |
| Human health and social work activities | 351 |
| Arts, entertainment and recreation | 87 |
| Other service activities | 95 |
| Individual agricultural workers | 334 |
| Total | 6,429 |
Notable people
- Aleksandar Davinić, journalist
- Bogoljub Mitić Đoša, actor and comedian
- Nenad Filipović, athletics
- Predrag Filipović, athletics
- Slaviša Stojanović, football coach
- Tihomir Stanojević, police commander
See also
- Subdivisions of Serbia
References
- "Municipalities of Serbia, 2006". Statistical Office of Serbia. Retrieved 2010-11-28.
- "2011 Census of Population, Households and Dwellings in the Republic of Serbia: Comparative Overview of the Number of Population in 1948, 1953, 1961, 1971, 1981, 1991, 2002 and 2011, Data by settlements" (PDF). Statistical Office of Republic Of Serbia, Belgrade. 2014. ISBN 978-86-6161-109-4. Retrieved 2014-06-27.
- "2011 Census of Population, Households and Dwellings in the Republic of Serbia" (PDF). stat.gov.rs. Statistical Office of the Republic of Serbia. Retrieved 12 January 2017.
- "MUNICIPALITIES AND REGIONS OF THE REPUBLIC OF SERBIA, 2019" (PDF). stat.gov.rs. Statistical Office of the Republic of Serbia. 25 December 2019. Retrieved 28 December 2019.
External links
| Wikimedia Commons has media related to Vlasotince. |
Capital: Vlasotince | ||
| Villages |
| |
| Landmarks |
| |
| Culture |
| |
| Notable people |
| |