United States presidential election in Washington (state), 1992
|
| |||||||||||||||||||||||||||||||||
| |||||||||||||||||||||||||||||||||
| |||||||||||||||||||||||||||||||||
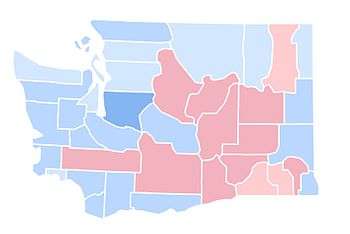 County Results
Clinton—50-60%
Clinton—40-50%
Clinton—30-40%
Bush—30-40%
Bush—40-50% | |||||||||||||||||||||||||||||||||
| |||||||||||||||||||||||||||||||||

| Elections in Washington |
|---|
 |
|
General elections
Gubernatorial elections
Attorney General elections Secretary of State elections State Senate elections State House elections State Supreme Court elections Other judicial elections |
|
|
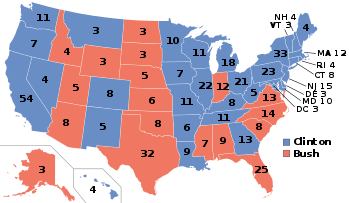
The 1992 United States presidential election in Washington took place on November 3, 1992, as part of the 1992 United States presidential election. Voters chose eleven representatives, or electors to the Electoral College, who voted for president and vice president.
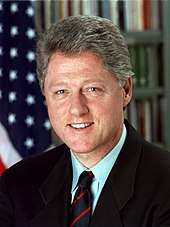
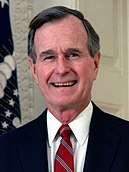
Washington was won by Governor Bill Clinton (D-Arkansas) with 43.41% of the popular vote over incumbent President George H.W. Bush (R-Texas) with 31.97%. Businessman Ross Perot (I-Texas) finished in third, with 23.68% of the popular vote.[1] Clinton ultimately won the national vote, defeating incumbent President Bush.[2] As of the 2016 presidential election, this was the last election in which Okanogan County voted for a Democratic Presidential nominee.[3] It was also the first occasion since Franklin D. Roosevelt’s 1936 landslide that Whitman County had supported a Democratic presidential candidate.[4]
Results
| United States presidential election in Washington, 1992[1] | |||||
|---|---|---|---|---|---|
| Party | Candidate | Votes | Percentage | Electoral votes | |
| Democratic | Bill Clinton | 993,037 | 43.41% | 11 | |
| Republican | George H.W. Bush (incumbent) | 731,234 | 31.97% | 0 | |
| Independent | Ross Perot | 541,780 | 23.68% | 0 | |
| Libertarian | Andre Marrou | 7,533 | 0.33% | 0 | |
| America First | James "Bo" Gritz | 4,854 | 0.21% | 0 | |
| Natural Law | John Hagelin | 2,456 | 0.11% | 0 | |
| U.S. Taxpayers' | Howard Phillips | 2,354 | 0.10% | 0 | |
| New Alliance | Lenora Fulani | 1,776 | 0.08% | 0 | |
| Independent | Ronald Daniels | 1,171 | 0.05% | 0 | |
| Democrats for Economic Recovery | Lyndon LaRouche | 855 | 0.04% | 0 | |
| Socialist Workers | James Warren | 515 | 0.02% | 0 | |
| Totals | 2,287,565 | 100.0% | 11 | ||
Results by county
| William Jefferson Clinton Democratic |
George Herbert Walker Bush Republican |
Henry Ross Perot Independent |
Various candidates Other parties |
Margin | Total votes cast | ||||||
|---|---|---|---|---|---|---|---|---|---|---|---|
| County | # | % | # | % | # | % | # | % | # | % | # |
| Adams | 1,449 | 31.60% | 2,087 | 45.52% | 1,010 | 22.03% | 39 | 0.85% | -638 | -13.91% | 4,585 |
| Asotin | 3,239 | 42.64% | 2,425 | 31.92% | 1,849 | 24.34% | 83 | 1.09% | 814 | 10.72% | 7,596 |
| Benton | 16,459 | 31.29% | 22,883 | 43.50% | 12,878 | 24.48% | 382 | 0.73% | -6,424 | -12.21% | 52,602 |
| Chelan | 7,860 | 33.48% | 10,716 | 45.65% | 4,606 | 19.62% | 294 | 1.25% | -2,856 | -12.17% | 23,476 |
| Clallam | 10,820 | 37.74% | 9,765 | 34.06% | 7,775 | 27.12% | 313 | 1.09% | 1,055 | 3.68% | 28,673 |
| Clark | 42,648 | 40.03% | 36,906 | 34.64% | 26,163 | 24.56% | 819 | 0.77% | 5,742 | 5.39% | 106,536 |
| Columbia | 668 | 34.90% | 761 | 39.76% | 466 | 24.35% | 19 | 0.99% | -93 | -4.86% | 1,914 |
| Cowlitz | 15,052 | 43.59% | 10,000 | 28.96% | 9,246 | 26.78% | 231 | 0.67% | 5,052 | 14.63% | 34,529 |
| Douglas | 3,731 | 33.77% | 4,920 | 44.53% | 2,315 | 20.95% | 82 | 0.74% | -1,189 | -10.76% | 11,048 |
| Ferry | 963 | 37.66% | 773 | 30.23% | 762 | 29.80% | 59 | 2.31% | 190 | 7.43% | 2,557 |
| Franklin | 3,743 | 34.22% | 4,486 | 41.02% | 2,597 | 23.75% | 111 | 1.01% | -743 | -6.79% | 10,937 |
| Garfield | 473 | 35.81% | 620 | 46.93% | 222 | 16.81% | 6 | 0.45% | -147 | -11.13% | 1,321 |
| Grant | 7,278 | 33.20% | 9,503 | 43.35% | 4,898 | 22.34% | 242 | 1.10% | -2,225 | -10.15% | 21,921 |
| Grays Harbor | 12,599 | 46.26% | 6,904 | 25.35% | 7,460 | 27.39% | 275 | 1.01% | 5,139[lower-alpha 1] | 18.87% | 27,238 |
| Island | 9,555 | 35.17% | 9,526 | 35.06% | 7,889 | 29.04% | 198 | 0.73% | 29 | 0.11% | 27,168 |
| Jefferson | 6,148 | 47.50% | 3,467 | 26.79% | 3,168 | 24.48% | 159 | 1.23% | 2,681 | 20.72% | 12,942 |
| King | 391,050 | 50.23% | 212,986 | 27.36% | 167,216 | 21.48% | 7,341 | 0.94% | 178,064 | 22.87% | 778,593 |
| Kitsap | 34,442 | 38.89% | 29,340 | 33.13% | 23,873 | 26.95% | 913 | 1.03% | 5,102 | 5.76% | 88,568 |
| Kittitas | 5,432 | 43.86% | 4,078 | 32.93% | 2,778 | 22.43% | 97 | 0.78% | 1,354 | 10.93% | 12,385 |
| Klickitat | 2,758 | 40.27% | 2,085 | 30.44% | 1,938 | 28.30% | 68 | 0.99% | 673 | 9.83% | 6,849 |
| Lewis | 7,810 | 28.75% | 12,316 | 45.33% | 6,684 | 24.60% | 358 | 1.32% | -4,506 | -16.59% | 27,168 |
| Lincoln | 1,653 | 33.48% | 2,152 | 43.59% | 1,098 | 22.24% | 34 | 0.69% | -499 | -10.11% | 4,937 |
| Mason | 8,076 | 41.15% | 5,776 | 29.43% | 5,577 | 28.42% | 197 | 1.00% | 2,300 | 11.72% | 19,626 |
| Okanogan | 5,015 | 38.48% | 4,265 | 32.72% | 3,541 | 27.17% | 212 | 1.63% | 750 | 5.75% | 13,033 |
| Pacific | 4,587 | 49.58% | 2,243 | 24.24% | 2,351 | 25.41% | 71 | 0.77% | 2,236[lower-alpha 1] | 24.17% | 9,252 |
| Pend Oreille | 1,798 | 38.13% | 1,528 | 32.40% | 1,340 | 28.41% | 50 | 1.06% | 270 | 5.73% | 4,716 |
| Pierce | 102,243 | 42.40% | 77,410 | 32.10% | 59,523 | 24.68% | 1,973 | 0.82% | 24,833 | 10.30% | 241,149 |
| San Juan | 3,353 | 47.11% | 1,901 | 26.71% | 1,776 | 24.95% | 87 | 1.22% | 1,452 | 20.40% | 7,117 |
| Skagit | 15,936 | 39.13% | 13,388 | 32.87% | 10,973 | 26.94% | 431 | 1.06% | 2,548 | 6.26% | 40,728 |
| Skamania | 1,474 | 40.05% | 1,102 | 29.95% | 1,050 | 28.53% | 54 | 1.47% | 372 | 10.11% | 3,680 |
| Snohomish | 88,643 | 39.32% | 69,137 | 30.67% | 65,838 | 29.21% | 1,812 | 0.80% | 19,506 | 8.65% | 225,430 |
| Spokane | 69,526 | 41.11% | 59,984 | 35.47% | 38,251 | 22.62% | 1,371 | 0.81% | 9,542 | 5.64% | 169,132 |
| Stevens | 4,960 | 33.54% | 5,706 | 38.59% | 3,769 | 25.49% | 352 | 2.38% | -746 | -5.04% | 14,787 |
| Thurston | 38,293 | 45.28% | 25,643 | 30.32% | 19,551 | 23.12% | 1,082 | 1.28% | 12,650 | 14.96% | 84,569 |
| Wahkiakum | 696 | 38.75% | 488 | 27.17% | 584 | 32.52% | 28 | 1.56% | 112[lower-alpha 1] | 6.24% | 1,796 |
| Walla Walla | 7,325 | 36.84% | 7,894 | 39.71% | 4,507 | 22.67% | 155 | 0.78% | -569 | -2.86% | 19,881 |
| Whatcom | 26,619 | 41.80% | 23,801 | 37.38% | 12,455 | 19.56% | 804 | 1.26% | 2,818 | 4.43% | 63,679 |
| Whitman | 7,637 | 43.69% | 6,428 | 36.78% | 3,220 | 18.42% | 193 | 1.10% | 1,209 | 6.92% | 17,478 |
| Yakima | 21,026 | 36.27% | 25,841 | 44.58% | 10,583 | 18.26% | 519 | 0.90% | -4,815 | -8.31% | 57,969 |
| Totals | 993,037 | 43.41% | 731,234 | 31.97% | 541,780 | 23.68% | 21,514 | 0.94% | 261,803 | 11.44% | 2,287,565 |
Notes
References
- 1 2 "1992 Presidential General Election Results - Washington". U.S. Election Atlas. Retrieved 11 June 2012.
- ↑ "1992 Presidential General Election Results". U.S. Election Atlas. Retrieved 11 June 2012.
- ↑ Sullivan, Robert David; ‘How the Red and Blue Map Evolved Over the Past Century’; America Magazine in The National Catholic Review; June 29, 2016
- ↑ Menendez, Albert J.; The Geography of Presidential Elections in the United States, 1868-2004, pp. 332-334 ISBN 0786422173