United States presidential election, 1928
|
| |||||||||||||||||||||||||||||
| |||||||||||||||||||||||||||||
531 electoral votes of the Electoral College 266 electoral votes needed to win | |||||||||||||||||||||||||||||
|---|---|---|---|---|---|---|---|---|---|---|---|---|---|---|---|---|---|---|---|---|---|---|---|---|---|---|---|---|---|
| Turnout |
56.9%[1] | ||||||||||||||||||||||||||||
| |||||||||||||||||||||||||||||
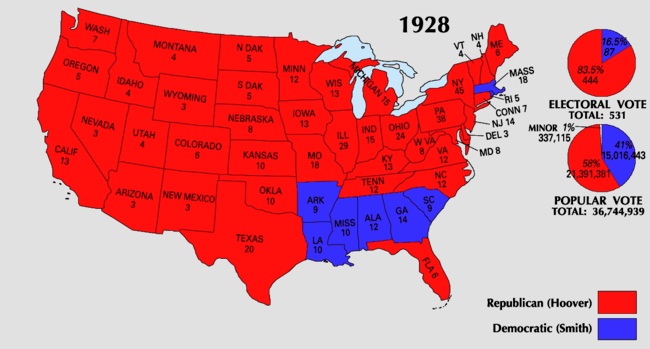
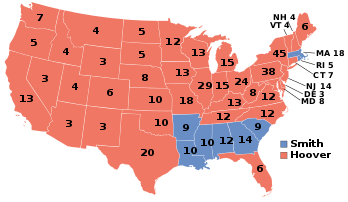  Presidential election results map. Red denotes states won by Hoover/Curtis, blue denotes those won by Smith/Robinson. Numbers indicate the number of electoral votes allotted to each state. | |||||||||||||||||||||||||||||
| |||||||||||||||||||||||||||||

The United States presidential election of 1928 was the 36th quadrennial presidential election, held on Tuesday, November 6, 1928. Republican Secretary of Commerce Herbert Hoover defeated the Democratic nominee, Governor Al Smith of New York. Hoover was the last Republican to win a presidential election until 1952.
After President Calvin Coolidge declined to seek reelection, Hoover emerged as his party's front-runner. As Hoover's intra-party opponents failed to unite around a candidate, Hoover received a large majority of the vote at the 1928 Republican National Convention. The strong state of the economy discouraged some Democrats from running, and Smith was nominated on the first ballot of the 1928 Democratic National Convention. Hoover and Smith had been widely known as potential presidential candidates long before the 1928 campaign, and both were generally regarded as outstanding leaders. Each candidate was a newcomer to the presidential race and presented in his person and record an appeal of unknown potency to the electorate. Each candidate also faced serious discontent within his party membership, and neither had the wholehearted support of his party organization.[2]
In the end, the Republicans were identified with the booming economy of the 1920s, whereas Smith, a Roman Catholic, suffered politically from anti-Catholic prejudice, his anti-prohibitionist stance, and his association with the legacy of corruption of Tammany Hall. Hoover won a third straight Republican landslide and made substantial inroads in the traditionally Democratic Solid South, winning several states that had not voted for a Republican since the end of Reconstruction. Hoover's victory made him the first president born west of the Mississippi River, and he is the most recent sitting member of the Cabinet to win a major party's presidential nomination.
Nominations
Republican Party nomination
 | |||||||||||||||||||||||||||||
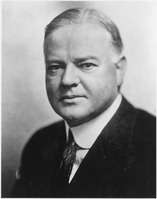
| Herbert Hoover | Charles Curtis | ||||||||||||||||||||||||||||
|---|---|---|---|---|---|---|---|---|---|---|---|---|---|---|---|---|---|---|---|---|---|---|---|---|---|---|---|---|---|
| for President | for Vice President | ||||||||||||||||||||||||||||
 |
 | ||||||||||||||||||||||||||||
| 3rd U.S. Secretary of Commerce (1921–1928) |
U.S. Senator from Kansas (1907–1913 & 1915–1929) | ||||||||||||||||||||||||||||
| Campaign | |||||||||||||||||||||||||||||
Republican candidates:

With President Coolidge choosing not to enter the race, the race for the nomination was wide open. The leading candidates were Secretary of Commerce Herbert Hoover, former Illinois Governor Frank Orren Lowden and Senate Majority Leader Charles Curtis. A draft-Coolidge movement failed to gain traction with party insiders and failed to persuade Coolidge himself.[3][4]
In the few primaries that mattered, Hoover did not perform as well as expected, and it was thought that the president or Vice-President Charles G. Dawes might accept a draft in case of a deadlock, but Lowden withdrew just as the convention was about to start, paving the way for a Hoover victory.[5]
The Republican Convention, held in Kansas City, Missouri, from June 12 to 15, nominated Hoover on the first ballot. With Hoover disinclined to interfere in the selection of his running mate, the party leaders were at first partial to giving Dawes a shot at a second term, but when this information leaked, Coolidge sent an angry telegram saying that he would consider a second nomination for Dawes, whom he hated, a "personal affront."[6] To attract votes from farmers concerned about Hoover's pro-business orientation, it was instead offered to Senator Curtis, who accepted. He was nominated overwhelmingly on the first ballot.[7]
In his acceptance speech eight weeks after the convention ended, Secretary Hoover said: "We in America today are nearer to the final triumph over poverty than ever before in the history of this land... We shall soon with the help of God be in sight of the day when poverty will be banished from this land."[8] The phrase would eventually haunt Hoover during the Great Depression.
| Presidential Ballot | Vice Presidential Ballot | ||
|---|---|---|---|
| Herbert Hoover | 837 | Charles Curtis | 1,052 |
| Frank Orren Lowden | 74 | Herman Ekern | 19 |
| Charles Curtis | 64 | Charles G. Dawes | 13 |
| James Eli Watson | 45 | Hanford MacNider | 2 |
| George W. Norris | 24 | ||
| Guy D. Goff | 18 | ||
| Calvin Coolidge | 17 | ||
| Charles G. Dawes | 4 | ||
| Charles Evans Hughes | 1 |
Democratic Party nomination
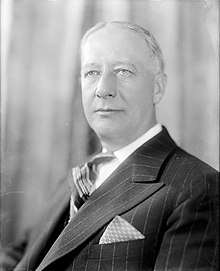
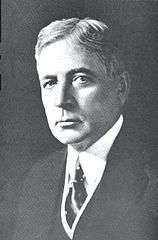
| Al Smith | Joseph T. Robinson | ||||||||||||||||||||||||||||
|---|---|---|---|---|---|---|---|---|---|---|---|---|---|---|---|---|---|---|---|---|---|---|---|---|---|---|---|---|---|
| for President | for Vice President | ||||||||||||||||||||||||||||
.png) |
 | ||||||||||||||||||||||||||||
| 42nd Governor of New York (1919–1920 & 1923–1928) |
U.S. Senator from Arkansas (1913–1937) | ||||||||||||||||||||||||||||
| Campaign | |||||||||||||||||||||||||||||
Democratic candidates:

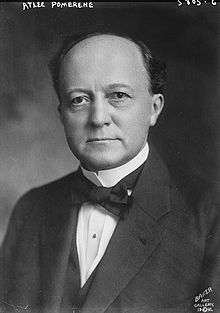 Former Senator Atlee Pomerene from Ohio
With the memory of the Teapot Dome scandal rapidly fading, and the current state of prosperity making the party's prospects look dim, most of the major Democratic leaders, such as William Gibbs McAdoo, were content to sit this one out. One who did not was New York Governor Al Smith, who had tried twice before to secure the Democratic nomination.[11]
The 1928 Democratic National Convention was held in Houston, Texas, on June 26 to 28, and Smith became the candidate on the first ballot.
The leadership asked the delegates to nominate Sen. Joseph Taylor Robinson of Arkansas, who was in many ways Smith's political polar opposite, to be his running mate, and he was nominated for vice-president.[12][13]
Smith was the first Roman Catholic to gain a major party's nomination for president, and his religion became an issue during the campaign. Many Protestants feared that Smith would take orders from church leaders in Rome in making decisions affecting the country.[14][15]
| Presidential Ballot | Vice Presidential Ballot | ||
|---|---|---|---|
| Al Smith | 849.17 | Joseph Taylor Robinson | 1,035.17 |
| Cordell Hull | 71.84 | Alben W. Barkley | 77 |
| Walter F. George | 52.5 | Nellie Tayloe Ross | 31 |
| James A. Reed | 52 | Henry Tureman Allen | 28 |
| Atlee Pomerene | 47 | George L. Berry | 17.5 |
| Jesse H. Jones | 43 | Dan Moody | 9.33 |
| Evans Woollen | 32 | Duncan U. Fletcher | 7 |
| Pat Harrison | 20 | John H. Taylor | 6 |
| William A. Ayres | 20 | Lewis Stevenson | 4 |
| Richard C. Watts | 18 | Evans Woollen | 2 |
| Gilbert Hitchcock | 16 | Joseph Patrick Tumulty | 100 |
| A. Victor Donahey | 5 | ||
| Houston Thompson | 2 | ||
| Theodore G. Bilbo | 1 |
Source: US President - D Convention. Our Campaigns. (March 10, 2011).
Prohibition Party nomination
The Prohibition Party Convention was held in Chicago from July 10 through July 12. Smith openly opposed Prohibition.[16] Some members of the Prohibition Party wanted to throw their support to Hoover, thinking that their candidate would not win and that they did not want their candidate to provide the margin by which Smith would win. Nonetheless, William F. Varney was nominated for president over Hoover by a margin of 68–45.
General election
The fall campaign
Anti-Catholicism was a significant problem for Smith's campaign. Protestant ministers warned that he would take orders from the pope who, many Americans sincerely believed, would move to the United States to rule the country from a fortress in Washington, D.C., if Smith won. According to a popular joke, after the election he sent a one-word telegram advising Pope Pius XI to "Unpack".[17][18] Beyond the conspiracy theories, a survey of 8,500 Southern Methodist Church ministers found only four who supported Smith, and the northern Methodists, Southern Baptists, and Disciples of Christ were similar in their opposition. Many voters who sincerely rejected bigotry and the anti-Catholic Ku Klux Klan—which had declined during the 1920s until the 1928 campaign revived it—justified their opposition to Smith on their belief that the Catholic Church was an "un-American", "alien culture" that opposed freedom and democracy.[18]
An example was a statement issued in September 1928 by the National Lutheran Editors' and Managers' Association that opposed Smith's election. The manifesto, written by Dr. Clarence Reinhold Tappert, warned about "the peculiar relation in which a faithful Catholic stands and the absolute allegiance he owes to a 'foreign sovereign' who does not only 'claim' supremacy also in secular affairs as a matter of principle and theory but who, time and again, has endeavored to put this claim into practical operation." The Catholic Church, the manifesto asserted, was hostile to American principles of separation of church and state and of religious toleration.[19] Groups circulated a million copies of a counterfeit oath claiming that fourth degree Knights of Columbus members swore to exterminate Freemasons and Protestants and commit violence against anyone, if the church so ordered.[20] Smith's opposition to Prohibition, a key reform promoted by Protestants, also lost him votes, as did his association with Tammany Hall. Because many anti-Catholics used these issues as a cover for their religious prejudices, Smith's campaign had difficulty denouncing anti-Catholicism as bigotry without offending others who favored Prohibition or disliked Tammany's corruption.[18]
Due to these issues, Smith lost several states of the Solid South that had been carried by Democrats since Reconstruction.[21] However, in many southern states with sizable African American populations (and where the vast majority of African Americans could not vote at the time), many believed that Hoover supported integration, or at least was not committed to maintaining segregation, which in turn overcame opposition to Smith's campaign. During the campaign, Mississippi Governor Theodore G. Bilbo claimed that Hoover had met with a black member of the Republican National Committee and danced with her. Hoover's campaign quickly denied the "untruthful and ignoble assertion".[22]
Smith's religion helped him with Roman Catholic New England immigrants (especially Irish-Americans and Italian-Americans), which may explain his narrow victories in traditionally Republican Massachusetts and Rhode Island, as well as his narrow loss in his home state of New York, where previous Democratic presidential candidates lost by double digits, but which Smith only lost by two percent.[23]
Results
The total vote exceeded that of 1924 by nearly eight million. It was nearly twice the vote cast in 1916 and nearly three times that of 1896. Every section in the Union increased its vote, the Mountain, East South Central and West South Central sections least of all. The greatest increases were in the heavily populated (Northeastern) Mid-Atlantic and East North Central sections, where more than 4,250,000 more votes were cast, more than half of the nationwide increase. There was an increase of over a million each in New York and Pennsylvania.[25]
Hoover won the election by a wide margin on pledges to continue the economic boom of the Coolidge years. He received more votes than any candidate of the Republican Party previously had in every state except five: Rhode Island, Iowa, North Dakota, South Carolina, and Tennessee.[26] The Hoover vote was greater than the Coolidge vote in 2,932 counties; it was less in 143 of the comparable counties.[27] The 21,400,000 votes cast for Hoover also touched the high-water mark for all votes for a presidential candidate up to that time and were an increase of more than 5,500,000 over the Coolidge vote four years earlier.[2] The Republican ticket made substantial inroads in the South: the heaviest Democratic losses were in the three Southern sections (South Atlantic, East South Central, West South Central). These losses included 215 counties that had never before supported a Republican presidential candidate, distributed as follows: Alabama (14), Arkansas (5), Florida (22), Georgia (4), Kentucky (28), Maryland (3), Mississippi (1), Missouri (10), North Carolina (16), Tennessee (3), Texas (64), Virginia (26), West Virginia (4). In Georgia, eight counties recorded more votes cast for "anti-Smith" electors than either of the two-party candidates,[25] while one county in Wyoming had no recorded votes.
The electoral votes of North Carolina and Virginia had not been awarded to a Republican since 1872, while Florida had not been carried by a Republican since the heavily disputed election of 1876. Texas was carried by a Republican for the first time in its history, leaving Georgia as the only remaining state never carried by a Republican presidential candidate. Georgia was eventually won by Barry Goldwater in 1964. In all, Smith carried only six of the eleven states of the former Confederacy, the lowest number carried by a Democratic candidate since the end of Reconstruction.
Smith polled more votes than any previous Democratic candidate in thirty of the 48 states, all but Alabama, Colorado, Delaware, Idaho, Kansas, Kentucky, Montana, Nevada, New Mexico, North Carolina, Oklahoma, Oregon, South Carolina, Tennessee, Texas, Utah, Virginia, and Washington. In only four of these (Tennessee, Oklahoma, Texas, and New Mexico) did Smith receive fewer votes than Davis had in 1924.[25]
Smith received nearly as many votes as Coolidge had in 1924, and his vote exceeded Davis's by more than six and half million.[25] The Democratic vote was greater than in 1924 in 2,080 counties; it fell off in 997 counties. In only one section did the Democratic vote drop below 38%, and that was the Pacific section, the only one in which the Republican percentage exceeded 60%. But the Democrats made gains in five sections. Of these counties, fourteen had never been Democratic and seven had been Democratic only once. The size and the nature of the distribution of the Democratic vote illustrates Smith's strengths and weaknesses as a candidate. Despite evidence of an increased Democratic vote, Smith's overwhelming defeat in the electoral college and the retention of so few Democratic counties reflected Hoover's greater appeal. Smith won the electoral votes of only the Deep Southern States of the Democratic Solid South (plus Robinson's home state of Arkansas) and the New England states of Massachusetts and Rhode Island, which had a large proportion of Catholic voters. His 87 electoral votes were the fewest a Democratic candidate had won since the 80 votes earned by Horatio Seymour in 1868 (not counting Horace Greeley in 1872, who was endorsed by the Democratic Party, but ran as a Liberal Republican). Hoover even triumphed by a narrow margin in Smith's home state of New York. Smith carried 914 counties, the fewest in the Fourth Party System. The Republican total leaped to 2,174 counties, a greater number than in the great overturn of 1920.[25]
Third-party support sank almost to the vanishing point, as the election of 1928 proved to be a two-party contest to a greater extent than any other in the Fourth Party System. Until the major split before the 1948 election in the Democratic Party between Southern Democrats and the more liberal Northern faction, no further significant third-party candidacies as seen in 1912 and 1924 were to occur. All "other" votes totaled only 1.08 percent of the national popular vote. The Socialist vote sank to 267,478, and in seven states there were no Socialist votes.[25]
This was the last election in which the Republicans won North Carolina until 1968, the last when they won Kentucky and West Virginia until 1956, the last when they won Arizona, California, Florida, Idaho, Illinois, Minnesota, Missouri, Montana, Nevada, New Mexico, Oklahoma, Tennessee, Texas, Utah, Virginia, and Washington until 1952, the last when they won Maryland, New Jersey, New York, and Oregon until 1948, the last when they won Ohio, Wisconsin, and Wyoming until 1944, and the last when they won Colorado, Indiana, Iowa, Kansas, Michigan, Nebraska, North Dakota and South Dakota until 1940. As of 2016 it remains the last election when the Republican candidate carried the three contiguous counties of Saint Louis County, Minnesota, Carlton County, Minnesota and Douglas County, Wisconsin, and the last until Donald Trump in 2016 when the Republicans carried neighboring Itasca County, Minnesota, Columbia County, Oregon or Grays Harbor County, Washington.[28] It is also the last occasion when Wayne County, Michigan supported a Republican candidate and the only occasion since 1908 when Republicans have carried Orange County, North Carolina.[28]
| Presidential candidate | Party | Home state | Popular vote | Electoral vote |
Running mate | |||
|---|---|---|---|---|---|---|---|---|
| Count | Percentage | Vice-presidential candidate | Home state | Electoral vote | ||||
| Herbert Hoover | Republican | California | 21,427,123 | 58.21% | 444 | Charles Curtis | Kansas | 444 |
| Al Smith | Democratic | New York | 15,015,464 | 40.80% | 87 | Joseph Taylor Robinson | Arkansas | 87 |
| Norman Thomas | Socialist | New York | 267,478 | 0.73% | 0 | James H. Maurer | Pennsylvania | 0 |
| William Z. Foster | Communist | Massachusetts | 48,551 | 0.13% | 0 | Benjamin Gitlow | New York | 0 |
| Verne L. Reynolds | Socialist Labor | Michigan | 21,590 | 0.06% | 0 | Jeremiah D. Crowley | New York | 0 |
| William F. Varney | Prohibition | New York | 20,095 | 0.05% | 0 | James Edgerton | Virginia | 0 |
| Frank Webb | Farmer-Labor | California | 6,390 | 0.02% | 0 | LeRoy R. Tillman | Georgia | 0 |
| Other | 321 | 0.00% | — | Other | — | |||
| Total | 36,807,012 | 100% | 531 | 531 | ||||
| Needed to win | 266 | 266 | ||||||
Source (Popular Vote): Leip, David. "1928 Presidential Election Results". Dave Leip's Atlas of U.S. Presidential Elections. Retrieved July 28, 2005.
Source (Electoral Vote): "Electoral College Box Scores 1789–1996". National Archives and Records Administration. Retrieved July 28, 2005.
Geography of results
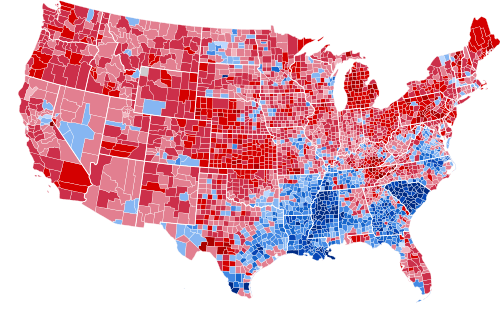 Results by county, shaded according to winning candidate's percentage of the vote
Cartographic gallery
 Map of presidential election results by county
 Map of Republican presidential election results by county
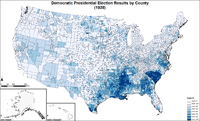 Map of Democratic presidential election results by county
 Map of "other" presidential election results by county
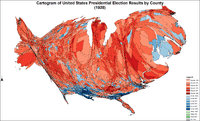 Cartogram of presidential election results by county
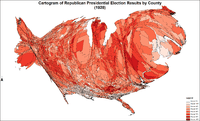 Cartogram of Republican presidential election results by county
 Cartogram of Democratic presidential election results by county
 Cartogram of "other" presidential election results by county
Results by state
| States won by Hoover/Curtis |
| States won by Smith/Robinson |
| Herbert Hoover Republican |
Alfred E. Smith Democratic |
Norman Thomas Socialist |
William Foster Communist |
Verne Reynolds Socialist Labor |
Margin | State Total | ||||||||||||||
|---|---|---|---|---|---|---|---|---|---|---|---|---|---|---|---|---|---|---|---|---|
| State | electoral votes |
# | % | electoral votes |
# | % | electoral votes |
# | % | electoral votes |
# | % | electoral votes |
# | % | electoral votes |
# | % | # | |
| Alabama | 12 | 120,725 | 48.49 | - | 127,797 | 51.33 | 12 | 460 | 0.18 | - | - | - | - | - | - | - | -7,072 | -2.84 | 248,982 | AL |
| Arizona | 3 | 52,533 | 57.57 | 3 | 38,537 | 42.23 | - | - | - | - | 184 | 0.20 | - | - | - | - | 13,996 | 15.34 | 91,254 | AZ |
| Arkansas | 9 | 77,751 | 39.33 | - | 119,196 | 60.29 | 9 | 429 | 0.22 | - | 317 | 0.16 | - | - | - | - | -41,445 | -20.96 | 197,693 | AR |
| California | 13 | 1,162,323 | 64.69 | 13 | 614,365 | 34.19 | - | 19,595 | 1.09 | - | 112 | 0.01 | - | - | - | - | 547,958 | 30.50 | 1,796,656 | CA |
| Colorado | 6 | 253,872 | 64.72 | 6 | 133,131 | 33.94 | - | 3,472 | 0.89 | - | 675 | 0.17 | - | - | - | - | 120,741 | 30.78 | 392,242 | CO |
| Connecticut | 7 | 296,614 | 53.63 | 7 | 252,040 | 45.57 | - | 3,019 | 0.55 | - | 730 | 0.13 | - | 622 | 0.11 | - | 44,574 | 8.06 | 553,031 | CT |
| Delaware | 3 | 68,860 | 65.03 | 3 | 36,643 | 34.60 | - | 329 | 0.31 | - | 59 | 0.06 | - | - | - | - | 32,217 | 30.42 | 105,891 | DE |
| Florida | 6 | 144,168 | 56.83 | 6 | 101,764 | 40.12 | - | 4,036 | 1.59 | - | 3,704 | 1.46 | - | - | - | - | 42,404 | 16.72 | 253,672 | FL |
| Georgia | 14 | 99,369 | 43.36 | - | 129,602 | 56.56 | 14 | 124 | 0.05 | - | 64 | 0.03 | - | - | - | - | -30,233 | -13.19 | 229,159 | GA |
| Idaho | 4 | 97,322 | 64.22 | 4 | 52,926 | 34.93 | - | 1,293 | 0.85 | - | - | - | - | - | - | - | 44,396 | 29.30 | 151,541 | ID |
| Illinois | 29 | 1,769,141 | 56.93 | 29 | 1,313,817 | 42.28 | - | 19,138 | 0.62 | - | 3,581 | 0.12 | - | 1,812 | 0.06 | - | 455,324 | 14.65 | 3,107,489 | IL |
| Indiana | 15 | 848,290 | 59.68 | 15 | 562,691 | 39.59 | - | 3,871 | 0.27 | - | 321 | 0.02 | - | 645 | 0.05 | - | 285,599 | 20.09 | 1,421,314 | IN |
| Iowa | 13 | 623,570 | 61.77 | 13 | 379,311 | 37.57 | - | 2,960 | 0.29 | - | 328 | 0.03 | - | 230 | 0.02 | - | 244,259 | 24.20 | 1,009,489 | IA |
| Kansas | 10 | 513,672 | 72.02 | 10 | 193,003 | 27.06 | - | 6,205 | 0.87 | - | 320 | 0.04 | - | - | - | - | 320,669 | 44.96 | 713,200 | KS |
| Kentucky | 13 | 558,064 | 59.33 | 13 | 381,070 | 40.51 | - | 837 | 0.09 | - | 293 | 0.03 | - | 340 | 0.04 | - | 176,994 | 18.82 | 940,604 | KY |
| Louisiana | 10 | 51,160 | 23.70 | - | 164,655 | 76.29 | 10 | - | - | - | - | - | - | - | - | - | -113,495 | -52.58 | 215,833 | LA |
| Maine | 6 | 179,923 | 68.63 | 6 | 81,179 | 30.96 | - | 1,068 | 0.41 | - | - | - | - | - | - | - | 98,744 | 37.66 | 262,171 | ME |
| Maryland | 8 | 301,479 | 57.06 | 8 | 223,626 | 42.33 | - | 1,701 | 0.32 | - | 636 | 0.12 | - | 906 | 0.17 | - | 77,853 | 14.74 | 528,348 | MD |
| Massachusetts | 18 | 775,566 | 49.15 | - | 792,758 | 50.24 | 18 | 6,262 | 0.40 | - | 2,461 | 0.16 | - | 772 | 0.05 | - | -17,192 | -1.09 | 1,577,823 | MA |
| Michigan | 15 | 965,396 | 70.36 | 15 | 396,762 | 28.92 | - | 3,516 | 0.26 | - | 2,881 | 0.21 | - | 799 | 0.06 | - | 568,634 | 41.44 | 1,372,082 | MI |
| Minnesota | 12 | 560,977 | 57.77 | 12 | 396,451 | 40.83 | - | 6,774 | 0.70 | - | 4,853 | 0.50 | - | 1,921 | 0.20 | - | 164,526 | 16.94 | 970,976 | MN |
| Mississippi | 10 | 27,153 | 17.90 | - | 124,539 | 82.10 | 10 | - | - | - | - | - | - | - | - | - | -97,386 | -64.20 | 151,692 | MS |
| Missouri | 18 | 834,080 | 55.58 | 18 | 662,562 | 44.15 | - | 3,739 | 0.25 | - | - | - | - | 340 | 0.02 | - | 171,518 | 11.43 | 1,500,721 | MO |
| Montana | 4 | 113,300 | 58.37 | 4 | 78,578 | 40.48 | - | 1,667 | 0.86 | - | 563 | 0.29 | - | - | - | - | 34,722 | 17.89 | 194,108 | MT |
| Nebraska | 8 | 345,745 | 63.19 | 8 | 197,959 | 36.18 | - | 3,434 | 0.63 | - | - | - | - | - | - | - | 147,786 | 27.01 | 547,144 | NE |
| Nevada | 3 | 18,327 | 56.54 | 3 | 14,090 | 43.46 | - | - | - | - | - | - | - | - | - | - | 4,237 | 13.07 | 32,417 | NV |
| New Hampshire | 4 | 115,404 | 58.65 | 4 | 80,715 | 41.02 | - | 465 | 0.24 | - | 173 | 0.09 | - | - | - | - | 34,689 | 17.63 | 196,757 | NH |
| New Jersey | 14 | 925,285 | 59.77 | 14 | 616,162 | 39.80 | - | 4,866 | 0.31 | - | 1,240 | 0.08 | - | 488 | 0.03 | - | 309,123 | 19.97 | 1,548,195 | NJ |
| New Mexico | 3 | 69,645 | 59.01 | 3 | 48,211 | 40.85 | - | - | - | - | 158 | 0.13 | - | - | - | - | 21,434 | 18.16 | 118,014 | NM |
| New York | 45 | 2,193,344 | 49.79 | 45 | 2,089,863 | 47.44 | - | 107,332 | 2.44 | - | 10,876 | 0.25 | - | 4,211 | 0.10 | - | 103,481 | 2.35 | 4,405,626 | NY |
| North Carolina | 12 | 348,923 | 54.94 | 12 | 286,227 | 45.06 | - | - | - | - | - | - | - | - | - | - | 62,696 | 9.87 | 635,150 | NC |
| North Dakota | 5 | 131,441 | 54.80 | 5 | 106,648 | 44.46 | - | 936 | 0.39 | - | 842 | 0.35 | - | - | - | - | 24,793 | 10.34 | 239,867 | ND |
| Ohio | 24 | 1,627,546 | 64.89 | 24 | 864,210 | 34.45 | - | 8,683 | 0.35 | - | 2,836 | 0.11 | - | 1,515 | 0.06 | - | 763,336 | 30.43 | 2,508,346 | OH |
| Oklahoma | 10 | 394,046 | 63.72 | 10 | 219,174 | 35.44 | - | 3,924 | 0.63 | - | - | - | - | - | - | - | 174,872 | 28.28 | 618,427 | OK |
| Oregon | 5 | 205,341 | 64.18 | 5 | 109,223 | 34.14 | - | 2,720 | 0.85 | - | 1,094 | 0.34 | - | 1,564 | 0.49 | - | 96,118 | 30.04 | 319,942 | OR |
| Pennsylvania | 38 | 2,055,382 | 65.24 | 38 | 1,067,586 | 33.89 | - | 18,647 | 0.59 | - | 4,726 | 0.15 | - | 380 | 0.01 | - | 987,796 | 31.35 | 3,150,610 | PA |
| Rhode Island | 5 | 117,522 | 49.55 | - | 118,973 | 50.16 | 5 | - | - | - | 283 | 0.12 | - | 416 | 0.18 | - | -1,451 | -0.61 | 237,194 | RI |
| South Carolina | 9 | 5,858 | 8.54 | - | 62,700 | 91.39 | 9 | 47 | 0.07 | - | - | - | - | - | - | - | -56,842 | -82.85 | 68,605 | SC |
| South Dakota | 5 | 157,603 | 60.18 | 5 | 102,660 | 39.20 | - | 443 | 0.17 | - | 232 | 0.09 | - | - | - | - | 54,943 | 20.98 | 261,865 | SD |
| Tennessee | 12 | 195,388 | 53.76 | 12 | 167,343 | 46.04 | - | 631 | 0.17 | - | 111 | 0.03 | - | - | - | - | 28,045 | 7.72 | 363,473 | TN |
| Texas | 20 | 367,036 | 51.77 | 20 | 341,032 | 48.10 | - | 722 | 0.10 | - | 209 | 0.03 | - | - | - | - | 26,004 | 3.67 | 708,999 | TX |
| Utah | 4 | 94,618 | 53.58 | 4 | 80,985 | 45.86 | - | 954 | 0.54 | - | 46 | 0.03 | - | - | - | - | 13,633 | 7.72 | 176,603 | UT |
| Vermont | 4 | 90,404 | 66.87 | 4 | 44,440 | 32.87 | - | - | - | - | - | - | - | - | - | - | 45,964 | 34.00 | 135,191 | VT |
| Virginia | 12 | 164,609 | 53.91 | 12 | 140,146 | 45.90 | - | 250 | 0.08 | - | 173 | 0.06 | - | 180 | 0.06 | - | 24,463 | 8.01 | 305,358 | VA |
| Washington | 7 | 335,844 | 67.06 | 7 | 156,772 | 31.30 | - | 2,615 | 0.52 | - | 1,541 | 0.31 | - | 4,068 | 0.81 | - | 179,072 | 35.75 | 500,840 | WA |
| West Virginia | 8 | 375,551 | 58.43 | 8 | 263,784 | 41.04 | - | 1,313 | 0.20 | - | 401 | 0.06 | - | - | - | - | 111,767 | 17.39 | 642,752 | WV |
| Wisconsin | 13 | 544,205 | 53.52 | 13 | 450,259 | 44.28 | - | 18,213 | 1.79 | - | 1,528 | 0.15 | - | 381 | 0.04 | - | 93,946 | 9.24 | 1,016,831 | WI |
| Wyoming | 3 | 52,748 | 63.68 | 3 | 29,299 | 35.37 | - | 788 | 0.95 | - | - | - | - | - | - | - | 23,449 | 28.31 | 82,835 | WY |
| TOTALS: | 531 | 21,427,123 | 58.21 | 444 | 15,015,464 | 40.80 | 87 | 267,478 | 0.73 | - | 48,551 | 0.13 | - | 21,590 | 0.06 | - | 6,411,659 | 17.42 | 36,807,012 | US |
Close states
Margin of victory less than 1% (5 electoral votes):
- Rhode Island, 0.61%
Margin of victory less than 5% (95 electoral votes):
- Massachusetts, 1.09%
- New York, 2.35%
- Alabama, 2.84%
- Texas, 3.67%
Margin of victory between 5% and 10% (60 electoral votes):
- Utah, 7.72%
- Tennessee, 7.72%
- Virginia, 8.01%
- Connecticut, 8.06%
- Wisconsin, 9.24%
- North Carolina, 9.87%
Statistics
Counties with Highest Percent of Vote (Republican)
- Jackson County, Kentucky 96.52%
- Leslie County, Kentucky 94.51%
- Alpine County, California 94.23%
- Johnson County, Tennessee 93.74%
- Sevier County, Tennessee 92.57%
Counties with Highest Percent of Vote (Democratic)
- Jackson Parish, Louisiana 100.00%
- Armstrong County, South Dakota 100.00%
- Humphreys County, Mississippi 99.90%
- Edgefield County, South Carolina 99.67%
- Bamberg County, South Carolina 99.49%
Counties with Highest Percent of Vote (Other)
- Alachua County, Florida 62.63%
- Appling County, Georgia 58.25%
- Long County, Georgia 57.32%
- Decatur County, Georgia 46.03%
- Jefferson County, Georgia 43.67%
See also
References
- ↑ "Voter Turnout in Presidential Elections". The American Presidency Project. UC Santa Barbara.
- 1 2 The Presidential Vote, 1896-1932, Edgar E. Robinson, pg. 24
- ↑ Rutland, Robert Allen (1996). The Republicans. p. 176. ISBN 978-0-8262-1090-6.
- ↑ Palmer, Niall A. (2006). The twenties in America. p. 128. ISBN 978-0-7486-2037-1.
- ↑ Walch, Timothy (1997). At the President's side. p. 36. ISBN 978-0-8262-1133-0.
- ↑ Mencken, Henry Louis; George Jean Nathan (1929). The American mercury. p. 404.
- ↑ Mieczkowski, Yanek; Mark Christopher Carnes (2001). The Routledge historical atlas of presidential elections. p. 94. ISBN 978-0-415-92133-6.
- ↑ "Hoover's Speech". Time. August 20, 1928. Retrieved May 18, 2008.
- ↑ "US President - R Convention Race - Jun 12, 1928". Our Campaigns. Retrieved 2016-08-18.
- ↑ "US Vice President - R Convention Race - Jun 15, 1928". Our Campaigns. Retrieved 2016-08-18.
- ↑ Paulson, Arthur C. (2000). Realignment and party revival. p. 52. ISBN 978-0-275-96865-6.
- ↑ Binning, William C.; Larry Eugene Esterly; Paul A. Sracic (1999). Encyclopedia of American parties, campaigns, and elections. p. 135. ISBN 978-0-313-30312-8.
- ↑ Ledbetter, Cal (August 24, 2008). "Joe T. Robinson and the 1928 presidential election". Arkansas Democrat-Gazette (Little Rock).
- ↑ Slayton, Robert A. (2001). Empire statesman. p. 304. ISBN 978-0-684-86302-3.
- ↑ Schlesinger Jr., Arthur (February 2, 1990). "O'Connor, Vaughan, Cuomo, Al Smith, J.F.K. - The New York Times". Retrieved May 19, 2009.
- ↑ Blocker, Jack S.; David M. Fahey; Ian R. Tyrrell (2003). Alcohol and temperance in modern history. ABC-CLIO. p. 51. ISBN 978-1-57607-833-4.
- ↑ O'Sullivan, John (2006). The president, the Pope, and the prime minister: three who changed the world. Regnery. p. 110. ISBN 1-59698-016-8.
- 1 2 3 Slayton, Robert A. (2001). Empire statesman: the rise and redemption of Al Smith. Simon and Schuster. pp. 309–313, 317. ISBN 0-684-86302-2.
- ↑ Douglas C. Strange, "Lutherans and Presidential Politics: The National Lutheran Editors' and Managers' Association Statement of 1928," Concordia Historical Institute Quarterly, Winter 1968, Vol. 41 Issue 4, pp 168-172
- ↑ "Great & Fake Oath". Time. 1928-09-03. Archived from the original on 2008-04-01. Retrieved 6 February 2015.
- ↑ Allan J. Lichtman, Prejudice and the Old Politics: The Presidential Election of 1928 (1979)
- ↑ Hachten, Arthur (October 20, 1928). "Hoover Spikes Dance Slander". Milwaukee Sentinel. p. 6. Retrieved March 31, 2011.
- ↑ Rice, Arnold S. (1972). The Ku Klux Klan in American Politics. Haskell House Publishers. ISBN 978-0-8383-1427-2.
- ↑ The Presidential Vote, 1896-1932 – Google Books. Stanford University Press. 1934. Retrieved August 12, 2014.
- 1 2 3 4 5 6 Robinson, Edgar Eugene (1947-01-01). The Presidential Vote 1896-1932. Stanford University Press. ISBN 9780804716963.
- ↑ The Presidential Vote, 1896-1932, Edgar E. Robinson, pg. 25
- ↑ The Presidential Vote, 1896-1932, Edgar E. Robinson, pg. 27
- 1 2 Sullivan, Robert David; ‘How the Red and Blue Map Evolved Over the Past Century’; America Magazine in The National Catholic Review; June 29, 2016
- ↑ "1928 Presidential General Election Data - National". Retrieved March 18, 2013.
Further reading
- Andersen, Kristi. The Creation of a Democratic Majority: 1928-1936. (Chicago: University of Chicago Press, 1997)
- Bornet, Vaughn Davis. "The Communist Party in the Presidential Election of 1928," Western Political Quarterly, (1958), 11#3 pp. 514–538. In JSTOR
- Bornet, Vaughn Davis. 'Labor Politics in a Democratic Republic: Moderation, Division, and Disruption in the Presidential Election of 1928 (1964)
- Coffman, Elesha. "The 'Religious Issue' in Presidential Politics." American Catholic Studies (2008) 119#4 pp 1-20
- Craig, Douglas B. After Wilson: The Struggle for Control of the Democratic Party, 1920-1934. (Chapel Hill: University of North Carolina Press, 1993)
- Doherty, Herbert J. "Florida and the Presidential Election of 1928." The Florida Historical Quarterly 26.2 (1947): 174-186.
- Goldberg, David Joseph. Discontented America: The United States in the 1920s. (Baltimore: Johns Hopkins University Press, 1999)
- Hostetler, Michael J. "Gov. Al Smith Confronts the Catholic Question: The Rhetorical Legacy of the 1928 Campaign" Communication Quarterly, Vol. 46, 1998.
- Lichtman, Allan, Prejudice and the Old Politics: The Presidential Election of 1928. Chapel Hill, NC: University of North Carolina Press, 1979.
- Moore, Edmund A. A Catholic Runs for President: The Campaign of 1928. Ronald Press, 1956.
- Rulli, Daniel F. "Campaigning in 1928: Chickens in Pots and Cars in Backyards," Teaching History: A Journal of Methods, Vol. 31, no. 1 (2006), pp. 42+
- Slayton, Robert A. Empire Statesman: The Rise and Redemption of Al Smith. New York: Free Press, 2001.
- Sweeney, James R. "Rum, Romanism, and Virginia Democrats: The Party Leaders and the Campaign of 1928." Virginia Magazine of History and Biography 90 (1982): 403–31. in JSTOR
Primary sources
- Hoover, Herbert. The Memoirs of Herbert Hoover: The Cabinet and the Presidency, 1920-1933 (1952),
- Smith, Alfred E. Campaign Addresses 1929.
External links
| Wikimedia Commons has media related to United States presidential election, 1928. |
- United States presidential election of 1928 at Encyclopædia Britannica
- 1928 popular vote by counties
- How close was the 1928 election? — Michael Sheppard, Massachusetts Institute of Technology
- Election of 1928 in Counting the Votes
| ||
| Presidency |  | |
| Other events | ||
| Life | ||
| Legacy | ||
| Books |
| |
| Elections | ||
| Family |
| |
| ||