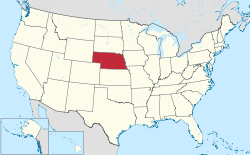
Presidential elections in Nebraska
 |
| No. of elections |
38 |
|---|
| Voted Democrat |
7 |
|---|
| Voted Republican |
31 |
|---|
| Voted other |
0 |
|---|
| Voted for winning candidate |
24 |
|---|
| Voted for losing candidate |
14 |
|---|
Following is a table of United States presidential elections in Nebraska, ordered by year. Since its admission to statehood in 1867, Nebraska has participated in every U.S. presidential election. Since 1992 Nebraska has split its electoral votes between congressional districts.[1]
Winners of the state are in bold.
| Year |
Winner (nationally) |
Votes |
Percent |
Loser (nationally) |
Votes |
Percent |
Other national
candidates[lower-alpha 1] |
Votes |
Percent |
Electoral
Votes |
Notes |
| 2016 | Donald Trump | 495,961 | 58.75 | Hillary Clinton | 284,494 | 33.70 | - | | | 5 | |
| 2012 | Barack Obama | 302,081 | 38.03 | Mitt Romney | 475,064 | 59.80 | - | | | 5 | |
| 2008 | Barack Obama | 333,319 | 41.60 | John McCain | 452,979 | 56.53 | - | | | 5 | Electoral votes split, four to McCain, one to Obama. |
| 2004 | George W. Bush | 512,814 | 65.90 | John Kerry | 254,328 | 32.68 | - | | | 5 | |
| 2000 | George W. Bush | 433,862 | 62.25 | Al Gore | 231,780 | 33.25 | - | | | 5 | |
| 1996 | Bill Clinton | 236,761 | 34.95 | Bob Dole | 363,467 | 53.65 | Ross Perot | 71,278 | 10.52 | 5 | |
| 1992 | Bill Clinton | 217,344 | 29.40 | George H. W. Bush | 344,346 | 46.58 | Ross Perot | 174,687 | 23.63 | 5 | |
| 1988 | George H. W. Bush | 398,447 | 60.15 | Michael Dukakis | 259,646 | 39.20 | - | | | 5 | |
| 1984 | Ronald Reagan | 460,054 | 70.55 | Walter Mondale | 187,866 | 28.81 | - | | | 5 | |
| 1980 | Ronald Reagan | 419,937 | 65.53 | Jimmy Carter | 166,851 | 26.04 | John B. Anderson | 44,993 | 7.02 | 5 | |
| 1976 | Jimmy Carter | 233,692 | 38.46 | Gerald Ford | 359,705 | 59.19 | - | | | 5 | |
| 1972 | Richard Nixon | 406,298 | 70.50 | George McGovern | 169,991 | 29.50 | - | | | 5 | |
| 1968 | Richard Nixon | 321,163 | 59.82 | Hubert Humphrey | 170,784 | 31.81 | George Wallace | 44,904 | 8.36 | 5 | |
| 1964 | Lyndon B. Johnson | 307,307 | 52.61 | Barry Goldwater | 276,847 | 47.39 | - | | | 5 | |
| 1960 | John F. Kennedy | 232,542 | 37.93 | Richard Nixon | 380,553 | 62.07 | - | | | 6 | |
| 1956 | Dwight D. Eisenhower | 378,108 | 65.51 | Adlai Stevenson II | 199,029 | 34.49 | T. Coleman Andrews/
Unpledged Electors[lower-alpha 2] | - | | 6 | |
| 1952 | Dwight D. Eisenhower | 421,603 | 69.15 | Adlai Stevenson II | 188,057 | 30.85 | - | | | 6 | |
| 1948 | Harry S. Truman | 224,165 | 45.85 | Thomas E. Dewey | 264,774 | 54.15 | Strom Thurmond | - | | 6 | |
| 1944 | Franklin D. Roosevelt | 233,246 | 41.42 | Thomas E. Dewey | 329,880 | 58.58 | - | | | 6 | |
| 1940 | Franklin D. Roosevelt | 263,677 | 42.81 | Wendell Willkie | 352,201 | 57.19 | - | | | 7 | |
| 1936 | Franklin D. Roosevelt | 347,445 | 57.14 | Alf Landon | 247,731 | 40.74 | - | | | 7 | |
| 1932 | Franklin D. Roosevelt | 359,082 | 62.98 | Herbert Hoover | 201,177 | 35.29 | - | | | 7 | |
| 1928 | Herbert Hoover | 345,745 | 63.19 | Al Smith | 197,959 | 36.18 | - | | | 8 | |
| 1924 | Calvin Coolidge | 218,585 | 47.09 | John W. Davis | 137,289 | 29.58 | Robert M. La Follette Sr. | 106,701 | 22.99 | 8 | |
| 1920 | Warren G. Harding | 247,498 | 64.66 | James M. Cox | 119,608 | 31.25 | - | | | 8 | |
| 1916 | Woodrow Wilson | 158,827 | 55.28 | Charles E. Hughes | 117,771 | 40.99 | - | | | 8 | |
| 1912 | Woodrow Wilson | 109,008 | 43.69 | Theodore Roosevelt | 72,681 | 29.13 | William H. Taft | 54,226 | 21.74 | 8 | |
| 1908 | William H. Taft | 126,997 | 47.60 | William Jennings Bryan | 131,099 | 49.14 | - | | | 8 | |
| 1904 | Theodore Roosevelt | 138,558 | 61.38 | Alton B. Parker | 52,921 | 23.44 | - | | | 8 | |
| 1900 | William McKinley | 121,835 | 50.46 | William Jennings Bryan | 114,013 | 47.22 | - | | | 8 | |
| 1896 | William McKinley | 103,064 | 46.18 | William Jennings Bryan | 115,007 | 51.53 | - | | | 8 | |
| 1892 | Grover Cleveland | 24,943 | 12.46 | Benjamin Harrison | 87,213 | 43.56 | James B. Weaver | 83,134 | 41.53 | 8 | |
| 1888 | Benjamin Harrison | 108,425 | 53.51 | Grover Cleveland | 80,552 | 39.75 | - | | | 5 | |
| 1884 | Grover Cleveland | 54,391 | 40.53 | James G. Blaine | 76,912 | 57.31 | - | | | 5 | |
| 1880 | James A. Garfield | 54,979 | 62.87 | Winfield S. Hancock | 28,523 | 32.62 | James B. Weaver | 3,950 | 4.52 | 3 | |
| 1876 | Rutherford B. Hayes | 31,915 | 64.7 | Samuel J. Tilden | 17,413 | 35.3 | - | | | 3 | |
| 1872 | Ulysses S. Grant | 18,329 | 70.68 | Horace Greeley | 7,603 | 29.32 | - | | | 3 | |
| 1868 | Ulysses S. Grant | 9,772 | 63.9 | Horatio Seymour | 5,519 | 36.1 | - | | | 3 | |
Notes
- ↑ For purposes of these lists, other national candidates are defined as those who won at least one electoral vote, or won at least ten percent of the vote in multiple states.
- ↑ Was allied with a slate of unpledged electors in Louisiana, Mississippi and South Carolina