United States presidential elections in Alaska
 | |
| No. of elections | 15 |
|---|---|
| Voted Democrat | 1 |
| Voted Republican | 14 |
| Voted other | 0 |
| Voted for winning candidate | 9 |
| Voted for losing candidate | 6 |
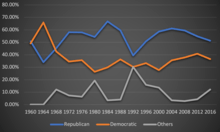
A line graph showing the presidential vote by party from 1960 to 2016 in Alaska.
Following is a table of United States presidential elections in Alaska, ordered by year. Since its admission to statehood in 1959, Alaska has participated in every U.S. presidential election.
Winners of the state are in bold.
| Year | Winner (nationally) | Votes | Percent | Loser (nationally) | Votes | Percent | Other national candidates[lower-alpha 1] |
Votes | Percent | Electoral Votes |
Notes |
|---|---|---|---|---|---|---|---|---|---|---|---|
| 2016 | Donald Trump | 163,387 | 51.28 | Hillary Clinton | 116,454 | 36.55 | - | 3 | |||
| 2012 | Barack Obama | 122,640 | 40.81 | Mitt Romney | 164,676 | 54.80 | - | 3 | |||
| 2008 | Barack Obama | 123,594 | 37.89 | John McCain | 193,841 | 59.42 | - | 3 | |||
| 2004 | George W. Bush | 190,889 | 61.07 | John Kerry | 111,025 | 35.52 | - | 3 | |||
| 2000 | George W. Bush | 167,398 | 58.62 | Al Gore | 79,004 | 27.67 | - | 3 | |||
| 1996 | Bill Clinton | 80,380 | 33.27 | Bob Dole | 122,746 | 50.80 | Ross Perot | 26,333 | 10.90 | 3 | |
| 1992 | Bill Clinton | 78,294 | 30.29 | George H. W. Bush | 102,000 | 39.46 | Ross Perot | 73,481 | 28.43 | 3 | |
| 1988 | George H. W. Bush | 119,251 | 59.59 | Michael Dukakis | 72,584 | 36.27 | - | 3 | |||
| 1984 | Ronald Reagan | 138,377 | 66.65 | Walter Mondale | 62,007 | 29.87 | - | 3 | |||
| 1980 | Ronald Reagan | 86,112 | 54.35 | Jimmy Carter | 41,842 | 26.41 | John B. Anderson | 11,155 | 7.04 | 3 | |
| 1976 | Jimmy Carter | 44,058 | 35.65 | Gerald Ford | 71,555 | 57.90 | - | 3 | |||
| 1972 | Richard Nixon | 55,349 | 58.13 | George McGovern | 32,967 | 34.62 | - | 3 | |||
| 1968 | Richard Nixon | 37,600 | 45.28 | Hubert Humphrey | 35,411 | 42.65 | George Wallace | 10,024 | 12.07 | 3 | |
| 1964 | Lyndon B. Johnson | 44,329 | 65.91 | Barry Goldwater | 22,930 | 34.09 | - | 3 | |||
| 1960 | John F. Kennedy | 29,809 | 49.06 | Richard Nixon | 30,953 | 50.94 | - | 3 |
Notes
- ↑ For purposes of these lists, other national candidates are defined as those who won at least one electoral vote, or won at least ten percent of the vote in multiple states.
This article is issued from
Wikipedia.
The text is licensed under Creative Commons - Attribution - Sharealike.
Additional terms may apply for the media files.