Tropical cyclones in 2018
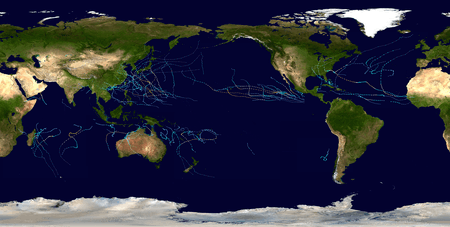

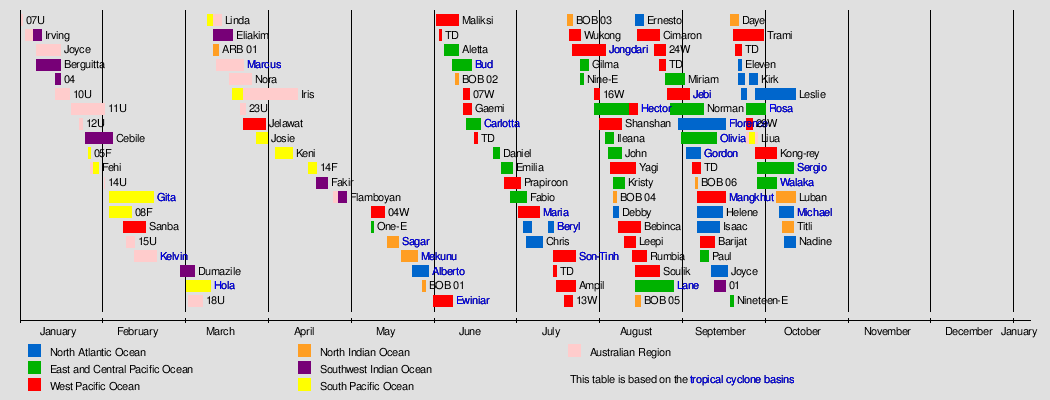
Tropical cyclones in 2018 were spread out across seven different areas called basins. Currently, 120 tropical cyclones have formed year to date. 84 tropical cyclones have been named by either a Regional Specialized Meteorological Center (RSMC) or a Tropical Cyclone Warning Center (TCWC).
Tropical cyclone activity in each basin is under the authority of a RSMC. The National Hurricane Center (NHC) is responsible for tropical cyclones in the North Atlantic and East Pacific. The Central Pacific Hurricane Center (CPHC) is responsible for tropical cyclones in the Central Pacific. Both the NHC and CPHC are subdivisions of the National Weather Service. Activity in the West Pacific is monitored by the Japan Meteorological Agency (JMA). Systems in the North Indian Ocean are monitored by the Indian Meteorological Department (IMD). The Météo-France located in Réunion (MFR) monitors tropical activity in the South-West Indian Ocean. The Australian region is monitored by five TCWCs that are under the coordination of the Australian Bureau of Meteorology (BOM). Similarly, the South Pacific is monitored by both the Fiji Meteorological Service (FMS) and the Meteorological Service of New Zealand Limited. Other, unofficial agencies that provide additional guidance in tropical cyclone monitoring include the Philippine Atmospheric, Geophysical and Astronomical Services Administration (PAGASA) and the Joint Typhoon Warning Center (JTWC).
Global atmospheric and hydrological conditions
North Atlantic Ocean
In the North Atlantic Ocean, atmospheric and hydrological conditions were generally unfavorable for tropical cyclogenesis. In the tropical Atlantic, sea surface temperatures were cooler than average, characteristic of a negative phase of the Atlantic Multidecadal Oscillation (AMO).[1] Additionally, high quantities of Saharan dust along with stronger than average upper-level wind shear over the tropical Atlantic created an unfavorable atmospheric environment. Despite the unfavorable conditions present, activity in the tropical Atlantic was plentiful, with Hurricanes Beryl,[2] Florence,[3] Helene,[4] and Isaac[5] developing in the region. On the contrary, conditions in the subtropical Atlantic were more conducive to tropical cyclone formation, with sea surface temperatures being warmer than average. 6 tropical cyclones; Beryl,[6] Chris,[7] Debby,[8] Ernesto,[9] and Joyce[10] and Leslie[11] developed or reformed in the subtropical Atlantic.
Strongest storms
The most intense worldwide of the years is Typhoon Mangkhut from Western Pacific, with 905 hPa (26.72 inHg) preliminary total.
| Cyclone | Basin | Peak classification | Peak 1-min sustained winds | Pressure |
|---|---|---|---|---|
| Hurricane Rosa | Eastern Pacific Atlantic | 230 km/h (145 mph) | 940 hPa (27.76 inHg) | |
| Hurricane Florence | North Atlantic | 220 km/h (140 mph) | 939 hPa (27.73 inHg) | |
| Hurricane Norman | Eastern Pacific | 240 km/h (150 mph) | 937 hPa (27.67 inHg) | |
| Hurricane Hector | 250 km/h (155 mph) | 936 hPa (27.64 inHg) | ||
| Cyclone Gita | South Pacific | 205 km/h (125 mph) | 927 hPa (27.37 inHg) | |
| Hurricane Lane | Eastern Pacific | 260 km/h (160 mph) | 922 hPa (27.23 inHg) | |
| Hurricane Walaka | 260 km/h (160 mph) | 920 hPa (27.17 inHg) | ||
| Hurricane Michael | North Atlantic | 250 km/h (155 mph) | 919 hPa (27.14 inHg) | |
| Typhoon Jelawat | Western Pacific | 195 km/h (125 mph) | 915 hPa (27.02 inHg) | |
| Typhoon Maria | 195 km/h (125 mph) | 915 hPa (27.02 inHg) | ||
| Typhoon Jebi | 195 km/h (125 mph) | 915 hPa (27.02 inHg) | ||
| Typhoon Trami | 195 km/h (125 mph) | 915 hPa (27.02 inHg) | ||
| Typhoon Kong-rey | 195 km/h (125 mph) | 915 hPa (27.02 inHg) | ||
| Cyclone Marcus | Australian region | 230 km/h (145 mph) | 912 hPa (26.93 inHg) | |
| Typhoon Mangkhut | Western Pacific | 205 km/h (125 mph) | 905 hPa (26.72 inHg) | |
Summary
Systems
January
The month of January had eleven systems form with two developing into strong systems. In the middle of the month, Cyclone Berguitta made landfall in Mauritius and Réunion, causing millions in damages and a fatality. The only system to cause significant damage was Tropical Cyclone Fehi which caused tens of millions in damages when it brought severe flooding to New Zealand in late January.
| Storm Name | Dates Active | Max wind km/h (mph) | Min pressure (mbar) | Areas Affected | Damage (USD) | Deaths | Refs |
|---|---|---|---|---|---|---|---|
| 07U | January 1–2 | 35 (25) | 1006 | None | None | None | |
| Irving | January 3–9 | 75 (45) | 993 | None | None | None | |
| Joyce | January 7–16 | 85 (50) | 978 | Western Australia | None | None | |
| Berguitta | January 9–20 | 165 (105) | 940 | Mauritius, Réunion | $12.1 million | 1 | |
| 04 | January 14–16 | 55 (35) | 999 | Madagascar, Mozambique | None | None | |
| 10U | January 14–19 | N/A | N/A | Christmas Island | None | None | |
| 11U | January 20–February 1 | 75 (45) | 985 | Top End, Western Australia | None | None | |
| 12U | January 23–24 | N/A | N/A | None | None | None | |
| Cebile | January 25–February 4 | 185 (115) | 944 | None | None | None | |
| 05F | January 26–27 | Unspecified | 996 | None | None | None | |
| Fehi | January 27–30 | 85 (50) | 986 | New Zealand | $50 million | None | [12] |
February
The month of February was inactive, with only six tropical cyclones forming. However, Cyclone Gita became the most intense tropical cyclone to affect Tonga since records began. Gita was also one of the worst tropical cyclones to affect the island nation, causing significant agricultural and structural damages totalling in the hundreds of millions as well as a couple fatalities. Cyclone Sanba was a system that made landfall in the Caroline Islands and the Philippines, resulting in a few million in damage and over a dozen fatalities. Cyclone Kelvin was unusual in that it maintained a healthy structure over land through a process known as the brown ocean effect, leading to tens of millions in damages.
| Storm Name | Dates Active | Max wind km/h (mph) | Min pressure (mbar) | Areas Affected | Damage (USD) | Deaths | Refs |
|---|---|---|---|---|---|---|---|
| 14U | February 1 | N/A | N/A | None | None | None | |
| Gita | February 3–19 | 205 (125) | 927 | Vanuatu, Fiji, Wallis and Futuna, Samoa, American Samoa, Niue, Tonga, New Caledonia, Queensland, New Zealand | $186.6 million | 2 | [12] |
| 08F | February 3–11 | Unspecified | 994 | Fiji | None | None | |
| Sanba (Basyang) | February 8–16 | 65 (40) | 1000 | Caroline Islands, Philippines | $3.2 million | 14 | [13] |
| 15U | February 9–12 | N/A | N/A | None | None | None | |
| Kelvin | February 12–20 | 110 (70) | 974 | Top End, Western Australia, South Australia | $25 million | None | [14][12] |
March
March was an active month with twelve systems. Early in the month, Cyclone Hola made landfall in Vanuatu causing a few fatalities and later in New Caledonia and New Zealand where it caused minor damages. At the same time, Tropical Depression 18U made landfall in Northern Territory, causing tens of millions in damage despite being a weak system. In the middle of the month, Cyclone Eliakim made landfall in Madagascar, causing close to two dozen deaths and an unknown amount of damage. Also forming in the middle of month, Cyclone Marcus was a very intense tropical cyclone that affected the Tanimbar Islands, Top End, and Kimberley, causing tens of millions in damages. Cyclone Iris was a very long lived system that formed several days later, lasting for nearly four weeks as a tropical cyclone before dissipating in mid-April. Cyclone Josie was a system that formed in late March. It affected southern Fiji, causing millions in damages and several deaths.

| Storm Name | Dates Active | Max wind km/h (mph) | Min pressure (mbar) | Areas Affected | Damage (USD) | Deaths | Refs |
|---|---|---|---|---|---|---|---|
| Dumazile | March 1–6 | 165 (105) | 945 | None | None | None | |
| Hola | March 3–11 | 165 (105) | 952 | Vanuatu, New Caledonia, New Zealand | Unknown | 3 | [15][16] |
| 18U | March 4–9 | N/A | 1001 | Northern Territory | $40 million | None | [12] |
| Eliakim | March 12–20 | 110 (70) | 980 | Madagascar | Unspecified | 20+ | [17][18] |
| Linda | March 13–16 | 75 (45) | 993 | Solomon Islands, New Caledonia, South East Queensland | None | None | |
| ARB 01 | March 13–15 | 45 (30)3 | 1006 | None | None | None | |
| Marcus | March 14–24 | 230 (145) | 912 | Tanimbar Islands, Top End, Kimberley | $75 million | None | [12] |
| Nora | March 19–27 | 155 (100) | 958 | Queensland, Papua New Guinea | None | None | |
| Iris | March 20–April 13 | 100 (65) | 987 | None | None | None | |
| 23U | March 23–25 | Unspecified | 1004 | None | None | None | |
| Jelawat (Caloy) | March 24–April 1 | 195 (120) | 915 | Caroline Islands | None | None | |
| Josie | March 29–April 2 | 75 (45) | 993 | Southern Fiji | $5 million | 6 | [12] |
April
April was an inactive month with only four systems forming globally. Tropical Cyclone Keni made landfall in Fiji, causing millions in damages. Later in the month, Tropical Cyclone Fakir made landfall in Réunion, causing millions in damages and a small number of fatalities.
| Storm Name | Dates Active | Max wind km/h (mph) | Min pressure (mbar) | Areas Affected | Damage (USD) | Deaths | Refs |
|---|---|---|---|---|---|---|---|
| Keni | April 5–11 | 140 (85) | 970 | Vanuatu, Fiji, Tonga | $5 million | None | [12] |
| 14F | April 17–20 | Unspecified | 1000 | Romuta | None | None | |
| Fakir | April 20–24 | 130 (80) | 975 | Reunion | $18 million | 2 | [19][12] |
| Flamboyan | April 26–May 1 | 110 (70) | 983 | None | None | None |
May
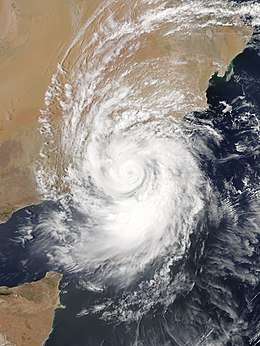
May was a relatively inactive month with only six systems forming. In the middle of the month, Cyclone Sagar affected Yemen, Somalia, Djibouti, Ethiopia, causing tens of millions in damages and several dozen deaths. Several days later, Cyclone Mekunu affected Yemen, Oman, and Saudi Arabia, causing hundreds of millions in damages and close to a few dozen deaths. At the same time, Subtropical Storm Alberto caused over a hundred million in damages and a dozen fatalities throughout the Northwest Caribbean and the Eastern United States. Late in the month, BOB 01 caused a few deaths in Myanmar.
| Storm Name | Dates Active | Max wind km/h (mph) | Min pressure (mbar) | Areas Affected | Damage (USD) | Deaths | Refs |
|---|---|---|---|---|---|---|---|
| 04W | May 10–15 | N/A | 1008 | None | None | None | |
| One-E | May 10–11 | 55 (35)4 | 1007 | None | None | None | |
| Sagar | May 16–20 | 85 (50)3 | 994 | Yemen, Somalia, Djibouti, Ethiopia | $30 million | 79 | [20][21][22] |
| Mekunu | May 21–27 | 175 (110)3 | 960 | Yemen, Oman, Saudi Arabia | $400 millon | 31 | [23][24][25] |
| Alberto | May 25–31 | 100 (65)4 | 990 | Yucatán Peninsula, Cayman Islands, Cuba, Eastern United States, Southern Canada | >$125 million | 12 | [26] |
| BOB 01 | May 29–30 | 55 (35)3 | 990 | Myanmar | None | 5 | [27] |
June
June was an active month with fourteen systems having formed. In early June, Tropical Storm Ewiniar impacted South China and Vietnam, causing hundreds of millions in damages and over a dozen deaths. At the same time, Severe Tropical Storm Maliksi killed a couple people in the Philippines despite not having made landfall. In the middle of the month, Tropical Storm Gaemi made landfall in Taiwan, causing a few fatalities. Late in the month, Prapiroon affected Japan and the Korean Peninsula, killing a few people and causing over ten million in damages.
| Storm Name | Dates Active | Max wind km/h (mph) | Min pressure (mbar) | Areas Affected | Damage (USD) | Deaths | Refs |
|---|---|---|---|---|---|---|---|
| Ewiniar | June 2–9 | 75 (45) | 998 | Vietnam, Philippines, South China, Taiwan, Ryukyu Islands | $573 million | 15 | [28][29] |
| Maliksi (Domeng) | June 3–11 | 110 (70) | 970 | Ryukyu Islands, Philippines, Honshu | Minimal | 2 | [30] |
| TD | June 4–5 | Unspecified | 1006 | None | None | None | |
| Aletta | June 6–11 | 220 (140)4 | 943 | None | None | None | |
| Bud | June 9–16 | 215 (130)4 | 948 | Western Mexico, Baja California Sur, Southwestern United States | Unknown | None | |
| BOB 02 | June 10–11 | 45 (30)3 | 989 | Myanmar | None | None | |
| 07W | June 13–15 | 65 (40) | 993 | Taiwan, Ryukyu Islands | None | None | |
| Gaemi (Ester) | June 13–16 | 85 (50) | 990 | Taiwan, Ryukyu Islands | minimal | 3 | [31] |
| Carlotta | June 14–19 | 100 (65)4 | 997 | Southwestern Mexico | Unknown | None | |
| TD | June 17–18 | Unspecified | 1000 | South China | None | None | |
| Daniel | June 24–26 | 75 (45)4 | 1003 | None | None | None | |
| Emilia | June 27–July 1 | 65 (60)4 | 997 | None | None | None | |
| Prapiroon (Florita) | June 28–July 4 | 120 (75) | 960 | Japan, Korean Peninsula | $10 million | 4 | [32][33] |
| Fabio | June 30–July 6 | 175 (110)4 | 964 | None | None | None |
July
July was an active month with fourteen systems having formed. In the middle of the month, Typhoon Maria caused a few hundred million in damages and a couple deaths in East China. Around the same time, Hurricane Chris killed a person off the coast of North Carolina. Later in the month, Tropical Storm Son-Tinh impacted the Philippines, South China, Vietnam, Laos, Thailand, and Myanmar, causing over a couple hundred million in damages and several dozen deaths.
| Storm Name | Dates Active | Max wind km/h (mph) | Min pressure (mbar) | Areas Affected | Damage (USD) | Deaths | Refs |
|---|---|---|---|---|---|---|---|
| Maria (Gardo) | July 3–11 | 195 (120) | 915 | Mariana Islands, Ryukyu Islands, Taiwan, East China | $490 million | 2 | [34][32] |
| Beryl | July 5–16 | 130 (80)4 | 994 | Leeward Islands, Hispaniola, Puerto Rico, Cuba, The Bahamas | None | None | |
| Chris | July 6–12 | 165 (105)4 | 970 | Bermuda, East Coast of the United States, Atlantic Canada, Iceland | None | 1 | [35] |
| Son-Tinh (Henry) | July 16–24 | 75 (45) | 994 | Philippines, South China, Vietnam, Laos, Thailand, Myanmar | $235 million | 68 | [32] |
| TD | July 16–17 | Unspecified | 998 | South China, Vietnam, Laos | $14.8 million | None | [36] |
| Ampil (Inday) | July 17–24 | 95 (60) | 985 | South China, Vietnam, Laos | $175 million | 1 | [37] |
| 13W (Josie) | July 20–23 | 55 (35) | 996 | Philippines, Taiwan, Ryukyu Islands, East China | $87.4 million | 16 | |
| BOB 03 | July 21–23 | 45 (30)3 | 989 | India | $350 million | 86 | [38] |
| Wukong | July 22–26 | 95 (60) | 990 | None | None | None | |
| Jongdari | July 23–August 4 | 140 (85) | 965 | Japan, East China | $100 million | None | [39][40] |
| Gilma | July 26–29 | 65 (40)4 | 1006 | None | None | None | |
| Nine-E | July 26–27 | 55 (35)4 | 1008 | None | None | None | |
| 16W | July 31–August 2 | 55 (35) | 1000 | None | None | None | |
| Hector | July 31–August 16 | 250 (155)4 | 936 | Hawaii, Johnston Atoll | Minimal | None |
August
August was an active month with twenty-one systems having formed.
| Storm Name | Dates Active | Max wind km/h (mph) | Min pressure (mbar) | Areas Affected | Damage (USD) | Deaths | Refs |
|---|---|---|---|---|---|---|---|
| Shanshan | August 2–10 | 130 (80) | 970 | Mariana Islands, Japan | None | None | |
| Ileana | August 4–7 | 100 (65)4 | 998 | Western Mexico, Baja California Sur | Unknown | 4 | [41] |
| John | August 5–10 | 165 (105)4 | 969 | Western Mexico, Baja California Sur, Southern California | None | None | |
| Yagi (Karding) | August 6–15 | 75 (45) | 990 | Philippines, Ryukyu Islands, China | $74 million | 7 | [42][43] |
| Kristy | August 7–11 | 110 (70)4 | 991 | None | None | None | |
| BOB 04 | August 7–8 | 45 (30)3 | 992 | Odisha, West Bengal | None | 1 | |
| Debby | August 8–9 | 85 (50)4 | 1000 | None | None | None | |
| Bebinca | August 9–17 | 95 (60) | 980 | South China, Laos, Vietnam, Thailand, Myanmar | $266 million | 16 | [44][45] |
| Leepi | August 11–15 | 95 (60) | 994 | Japan, South Korea | None | None | |
| Rumbia | August 14–19 | 85 (50) | 985 | Ryukyu Islands, China, Korean Peninsula, Russian Far East | $1.34 billion | 22 | [46][47] |
| Soulik | August 15–24 | 155 (100) | 950 | Caroline Islands, Mariana Islands, Northeast China, Japan, Korean Peninsula, Russian Far East, Alaska | $81 million | 1 | [48] |
| Lane | August 15–29 | 260 (160)4 | 922 | Hawaii | >$200 million | 1 | [40] |
| BOB 05 | August 15–17 | 45 (30)3 | 994 | India | None | 69 | |
| Ernesto | August 15–18 | 75 (45)4 | 999 | Ireland, United Kingdom | None | None | |
| Cimaron | August 16–24 | 155 (100) | 950 | Marshall Islands, Mariana Islands, Japan | Unknown | None | |
| 24W (Luis) | August 22–26 | 55 (35) | 994 | Taiwan, East China | $34 million | 7 | [49][40] |
| TD | August 24–26 | Unspecified | 1000 | Ryukyu Islands, East China | None | None | |
| Miriam | August 26–September 2 | 155 (100)4 | 974 | None | None | None | |
| Jebi (Maymay) | August 27–September 4 | 195 (120) | 915 | Mariana Islands, Taiwan, Japan, Russian Far East | $2.3 billion | 17 | [50][51][52][53] |
| Norman | August 28–September 9 | 240 (150)4 | 937 | None | None | None | |
| Florence | August 31–September 17 | 220 (140)4 | 939 | East Coast of the United States, West Africa, Cape Verde, Bermuda, Atlantic Canada | >$38 billion | 48 |
September

| Storm Name | Dates Active | Max wind km/h (mph) | Min pressure (mbar) | Areas Affected | Damage (USD) | Deaths | Refs |
|---|---|---|---|---|---|---|---|
| Olivia | September 1–14 | 215 (130)4 | 948 | Hawaii | Unknown | None | |
| Gordon | September 3–8 | 110 (70)4 | 997 | Lesser Antilles, Puerto Rico, Hispaniola, Cuba, The Bahamas, Gulf Coast of the United States, Arkansas, Missouri, Eastern United States | Unknown | 3 | [54][55] |
| TD | September 5–8 | 55 (35) | 1000 | Ryukyu Islands | None | None | |
| BOB 06 | September 6–7 | 55 (35)3 | 990 | Odisha, West Bengal | None | None | |
| Mangkhut (Ompong) | September 7–17 | 205 (125) | 905 | Marshall Islands, Mariana Islands, Guam, Philippines, Taiwan, Macau, Hong Kong, China | >$1.55 billion | >102 | |
| Helene | September 7–16 | 175 (110)4 | 966 | West Africa, Cape Verde | Unknown | 3 | [56] |
| Isaac | September 7–15 | 120 (75)4 | 992 | West Africa, Cape Verde | None | None | |
| Barijat (Neneng) | September 8–13 | 75 (45) | 998 | Philippines, Taiwan, South China | None | None | |
| Paul | September 8–11 | 75 (45)4 | 1002 | None | None | None | |
| Joyce | September 12–19 | 85 (50)4 | 997 | Azores | None | None | |
| 01 | September 13–17 | 55 (35) | 1004 | None | None | None | |
| Nineteen-E | September 19–20 | 55 (35)4 | 1003 | Baja California Sur, Northwestern Mexico | Minimal | None | |
| Daye | September 19–21 | 70 (45)3 | 992 | Odisha, West Bengal, Andhra Pradesh, Chhattisgarh, Madhya Pradesh, Rajasthan, Uttarakhand | $100 million | 25 | |
| Trami (Paeng) | September 20–October 1 | 195 (120) | 915 | Mariana Islands, Taiwan, Japan | Unknown | 2 | |
| TD | September 21–23 | Unspecified | 1006 | None | None | None | |
| Eleven | September 22–23 | 55 (35)4 | 1007 | None | None | None | |
| Kirk | September 22–29 | 95 (60)4 | 998 | Lesser Antilles | Unknown | None | |
| Leslie | September 23–Present | 95 (60)4 | 986 | Azores | None | None | |
| Rosa | September 25–October 2 | 230 (145)4 | 940 | Baja California Peninsula, Northwestern Mexico, Southwestern United States | Unknown | 14 | |
| 29W | September 25-27 | 55 (35) | 1008 | None | None | None | |
| Liua | September 26–29 | 70 (45) | 995 | Solomon Islands | Unknown | Unknown | |
| Kong-rey (Queenie) | September 28–October 6 | 195 (120) | 915 | Caroline Islands, Mariana Islands, Japan, Taiwan, South Korea | Unknown | 2 | |
| Sergio | September 29–Present | 220 (140)4 | 943 | None | None | None | |
| Walaka | September 29–October 6 | 260 (160)4 | 920 | Johnston Atoll, Northwestern Hawaiian Islands | Unknown | None |
October

| Storm Name | Dates Active | Max wind km/h (mph) | Min pressure (mbar) | Areas Affected | Damage (USD) | Deaths | Refs |
|---|---|---|---|---|---|---|---|
| Luban | October 6–Present | 85 (50)3 | 994 | Maldives, South India | None | None | |
| Michael | October 7–12 | 250 (155)4 | 919 | Central America, Yucatán Peninsula, Cuba, Florida Keys, Florida Panhandle | Unknown | 13 | |
| Titli | October 8–Present | 65 (40)3 | 998 | Odisha, Andhra Pradesh | None | None | |
| Nadine | October 9–13 | 100 (65)4 | 997 | None | None | None |
Global effects
Notes
1 Only systems that formed either on or after January 1, 2018 are counted in the seasonal totals.
2 Only systems that formed either before or on December 31, 2018 are counted in the seasonal totals.
3 The wind speeds for this tropical cyclone are based on the IMD Scale which uses 3-minute sustained winds.
4 The wind speeds for this tropical cyclone are based on the Saffir Simpson Scale which uses 1-minute sustained winds.
See also
References
- ↑ Brian Donegan (August 28, 2018). "The Most Active Month for Hurricanes Begins This Weekend; Is the Tropical Atlantic About to Wake Up?". Retrieved September 15, 2018.
- ↑ Berg, Robbie. Hurricane Beryl Advisory Number 5. National Hurricane Center (Report). National Oceanic and Atmospheric Administration. Retrieved 16 September 2018.
- ↑ Roberts, Dave. Tropical Storm Florence Advisory Number 20. National Hurricane Center (Report). National Oceanic and Atmospheric Administration. Retrieved 16 September 2018.
- ↑ Pasch, Richard. Hurricane Helene Advisory Number 10. National Hurricane Center (Report). National Oceanic and Atmospheric Administration. Retrieved 16 September 2018.
- ↑ Zelinsky, David. Hurricane Isaac Advisory Number 10. National Hurricane Center (Report). National Oceanic and Atmospheric Administration. Retrieved 16 September 2018.
- ↑ Beven, Jack. Subtropical Storm Beryl Special Advisory Number 16. National Hurricane Center (Report). National Oceanic and Atmospheric Administration. Retrieved 16 September 2018.
- ↑ Beven, Jack. Hurricane Chris Advisory Number 18. National Hurricane Center (Report). National Oceanic and Atmospheric Administration. Retrieved 16 September 2018.
- ↑ Stewart, Stacy. Tropical Storm Debby Advisory Number 4. National Hurricane Center (Report). National Oceanic and Atmospheric Administration. Retrieved 16 September 2018.
- ↑ Brown, Daniel. Subtropical Storm Ernesto Advisory Number 2. National Hurricane Center (Report). National Oceanic and Atmospheric Administration. Retrieved 16 September 2018.
- ↑ Zelinsky, David. Tropical Storm Joyce Advisory Number 10. National Hurricane Center (Report). National Oceanic and Atmospheric Administration. Retrieved 16 September 2018.
- ↑ https://www.nhc.noaa.gov
- 1 2 3 4 5 6 7 8 "Global Catastrophe Recap April 2018" (PDF). thoughtleadership.aonbenfield.com. Aon Benfield. Retrieved May 17, 2018.
- ↑ "SitRep No. 11 re re Preparedness Measures and Effects for Tropical Storm "BASYANG"" (PDF). February 23, 2018.
- ↑ DOLLERY, REBECCA. "Kimberley flooding leaves $16 million road repair bill after two cyclones". ABC news. Retrieved 17 March 2018.
- ↑ "Cyclone Hola Kills 1, Injures 2 In Vanuatu". Urdupoint. 9 March 2018.
- ↑ "Two More Tc Hola Deaths Confirmed". 14 March 2018.
- ↑ "Dozens Deaths Confirm Malagasy's Fear of Cyclone". Prensa Latina. 20 March 2018. Retrieved 21 March 2018.
- ↑ "Global Catastrophe Recap March 2018" (PDF). thoughtleadership.aonbenfield.com. Aon Benfield. Retrieved April 23, 2018.
- ↑ "Tropical Storm Fakir turns deadly after unleashing destructive winds, mudslides on La Reunion". AccuWeather. 26 April 2018. Retrieved 27 April 2018.
- ↑ Humanitarian Bulletin Somalia, 1 May - 3 June 2018 (PDF). United Nations Office for the Coordination of Humanitarian Affairs (Report). June 3, 2018. ReliefWeb. Retrieved June 3, 2018.
- ↑ World Vision East Africa Hunger Crisis Situation Report: Ethiopia (PDF). World Vision (Report). June 19, 2018. ReliefWeb. Retrieved July 3, 2018.
- ↑ UNICEF Djibouti Humanitarian Situation Report, June 2018. United Nations Children Fund (Report). June 30, 2018. ReliefWeb. Retrieved August 7, 2018.
- ↑ "Yemen: Cyclone Mekunu - Information bulletin No.2". ReliefWeb. International Federation of Red Cross And Red Crescent Societies. Retrieved 1 June 2018.
- ↑ Gambrell, Jon. "Cyclone death toll in Oman, Yemen rises to at least 13". WHEC News. The Associated Press. Retrieved 28 May 2018.
- ↑ "Global Catastrophe Recap June 2018" (PDF). Retrieved July 15, 2018.
- ↑ AON Benfield. "Global Catastrophe Recap June 2018" (PDF). p. 10. Retrieved July 15, 2018.
- ↑ "5 killed, 1,400 houses destroyed by cyclone in Myanmar". Xinhua.net. Retrieved 31 May 2018.
- ↑ "Global Catastrophe Recap June 2018" (PDF). Retrieved July 15, 2018.
- ↑ "台风"艾云尼"致粤赣湘闽琼14人死亡失踪". 中华人民共和国减灾部. June 11, 2018. Retrieved June 11, 2018.
- ↑ "2 dead in aftermath of Typhoon Domeng". CNN Philippines. June 11, 2018.
- ↑ "SitRep No.15 Preparedness Measures&Effects of SW Monsoon by TY Domeng & TD Ester" (PDF). NDRRMC. June 19, 2018.
- 1 2 3 "Global Catastrophe Recap July 2018" (PDF). Retrieved August 9, 2018.
- ↑ "1 dead, 1 missing as Typhoon Prapiroon approaches Korea". Koreaherald. July 2, 2018.
- ↑ "强台风"玛莉亚"造成1.3万间房屋倒损". 中华人民共和国减灾委员会. July 13, 2018.
- ↑ Kory, Melissa. "Man Drowns in Rough Surf as Tropical Storm Chris Spins Off North Carolina Coast". The Weather Channel. Retrieved 8 July 2018.
- ↑ "热带低压致广西海南云南损失1亿元". 中华人民共和国减灾部. July 27, 2018. Retrieved July 27, 2018.
- ↑ "台风"安比"致10省份近180万人受灾". 中华人民共和国减灾部. July 27, 2018. Retrieved July 27, 2018.
- ↑ "SitRep No.35 SW Monsoon enhanced by TCs HENRY, INDAY and JOSIE" (PDF). NDRRMC. August 9, 2018.
- ↑ "台风"云雀"致沪苏浙损失3亿余元". 中华人民共和国减灾部. August 6, 2018. Retrieved August 6, 2018.
- 1 2 3 "Global Catastrophe Recap August 2018" (PDF). Retrieved September 7, 2018.
- ↑ "Van 4 muertos por efectos de la tormenta "Ileana" en Guerrero". El Diaro de Coahuila (in Spanish). August 6, 2018. Retrieved August 8, 2018.
- ↑ "第14号台风"摩羯"昨天夜间减弱为热带低压" (in Chinese). China National Commission for Disaster Reduction. August 14, 2018. Archived from the original on August 14, 2018. Retrieved August 14, 2018.
- ↑ "Sitrep no.18 as of 06:00 AM, 26 August 2018" (PDF). NDRRMC. August 26, 2018.
- ↑ http://infonet.vn/nghe-an-xin-trung-uong-ho-tro-350-ti-dong-khac-phuc-thiet-hai-bao-so-4-post272385.info
- ↑ ""贝碧嘉"登陆广东省雷州市沿海". 中华人民共和国减灾部. August 16, 2018. Retrieved August 16, 2018.
- ↑ ""温比亚"造成6省份22人死亡7人失踪" (in Chinese). China National Commission for Disaster Reduction. August 20, 2018. Archived from the original on August 21, 2018. Retrieved August 21, 2018.
- ↑ Alice Yan (August 24, 2018). "Floods brought by Typhoon Rumbia devastate China's biggest supplier of vegetables". South China Morning Post. Retrieved August 25, 2018.
- ↑ "태풍 현황과 전망" (in Korean). Korea Meteorological Administration. August 23, 2018. Archived from the original on August 23, 2018. Retrieved August 23, 2018.
- ↑ "Flooding causes estimated NT$370 million in agricultural losses". Focus Taiwan. Enditem/AW. August 25, 2018. Retrieved August 26, 2018.
- ↑ "Insured Losses from Typhoon Jebi Estimated at $2.3-$4.5 Billion: AIR". Insurance Journal. September 9, 2018. Retrieved September 13, 2018.
- ↑ "Japan deals with Jebi aftermath". NHK. September 5, 2018. Retrieved September 5, 2018.
- ↑ 沈如峰 (September 5, 2018). "宜蘭海上發現浮屍 證實為神秘沙灘失蹤者" (in Chinese). Yilan County, Taiwan: Central News Agency. Archived from the original on September 5, 2018. Retrieved September 4, 2018.
- ↑ Keoni, Everington (September 4, 2018). "Rogue waves claim 6 lives over 2 days in NE Taiwan". Taiwan News. Archived from the original on September 4, 2018. Retrieved September 4, 2018.
- ↑ News, A. B. C. (5 September 2018). "Tropical Storm Gordon makes landfall in Mississippi; 1 death reported from storm". ABC News.
- ↑ "One dead as car crashes jam highways connecting Miami and Miami Beach". miamiherald. Retrieved 2018-09-05.
- ↑ Mohamed Moro Sacko (September 6, 2018). "Siguiri : Trois morts suite à des pluies duliviennnes à Doko" (in French). Guinea News. Retrieved September 8, 2018.
External links
Regional Specialized Meteorological Centers
- US National Hurricane Center – North Atlantic, Eastern Pacific
- Central Pacific Hurricane Center – Central Pacific
- Japan Meteorological Agency – NW Pacific
- India Meteorological Department – Bay of Bengal and the Arabian Sea
- Météo-France – La Reunion – South Indian Ocean from 30°E to 90°E
- Fiji Meteorological Service – South Pacific west of 160°E, north of 25° S
Tropical Cyclone Warning Centers
- Indonesian Meteorological Department – South Indian Ocean from 90°E to 125°E, north of 10°S
- Australian Bureau of Meteorology (TCWC's Perth, Darwin & Brisbane) – South Indian Ocean & South Pacific Ocean from 90°E to 160°E, south of 10°S
- Meteorological Service of New Zealand Limited – South Pacific west of 160°E, south of 25°S
![]()