2018 Pacific hurricane season
| 2018 Pacific hurricane season | |
|---|---|
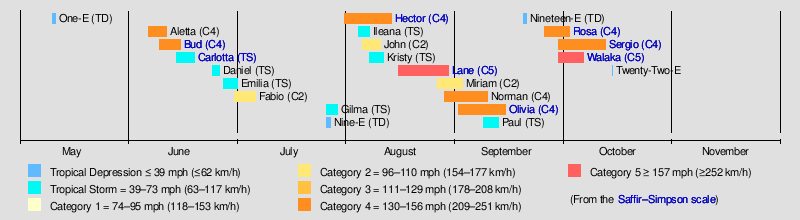
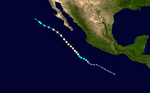
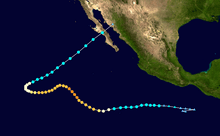
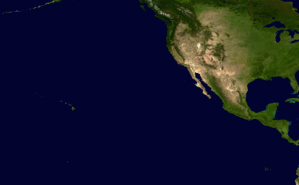 Season summary map | |
| Seasonal boundaries | |
| First system formed | May 10, 2018 |
| Last system dissipated | Season ongoing |
| Strongest storm | |
| Name | Walaka |
| • Maximum winds |
160 mph (260 km/h) (1-minute sustained) |
| • Lowest pressure | 920 mbar (hPa; 27.17 inHg) |
| Seasonal statistics | |
| Total depressions | 23,1 unofficial |
| Total storms | 19, 1 unofficial |
| Hurricanes | 12 |
| Major hurricanes (Cat. 3+) | 9 |
| Total fatalities | 26 total |
| Total damage | > $200 million (2018 USD) |
| Related articles | |
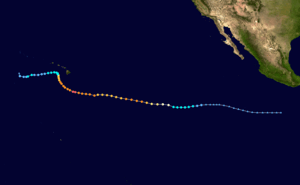
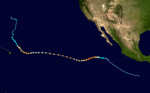
The 2018 Pacific hurricane season is the second-most active Pacific hurricane season on record in terms of accumulated cyclone energy (ACE). It is an ongoing event in the annual cycle of tropical cyclone formation. The season officially began on May 15 in the eastern Pacific, and on June 1 in the central Pacific; they will both end on November 30.[1] These dates conventionally delimit the period of each year when most tropical cyclones form in the Pacific basin, as illustrated when the first tropical depression formed on May 10. The first named storm of the season, Hurricane Aletta, formed on June 6. Hurricane Bud formed three days later and made landfall as a tropical storm in Baja California Sur. Tropical Storm Carlotta stalled offshore the Mexican coastline causing minor damage. Hurricane Hector became the first tri-basin crosser since Hurricane Genevieve 2014. In late August, Hurricane Lane became the first Category 5 Pacific hurricane since Patricia of 2015. Lane went on to drop torrential amounts of rainfall over Hawaii, becoming the state's wettest tropical cyclone on record and the second-wettest overall in the United States. Hurricane Walaka became the second Category 5 hurricane of the season on October 1, making 2018 the first season since 2002 to feature multiple Category 5 hurricanes, and the first since 1994 to feature multiple Category 5 hurricanes in the Central Pacific. On October 4, Hurricane Sergio became the eighth Category 4 hurricane of the season in the eastern Pacific region, breaking the previous record of seven, which was set in 2015.[2]
Seasonal forecasts
| Record | Named storms |
Hurricanes | Major hurricanes |
Ref | |
|---|---|---|---|---|---|
| Average (1981–2010): | 15.4 | 7.6 | 3.2 | [3] | |
| Record high activity: | 1992: 27 | 2015: 16 | 2015: 11 | [4] | |
| Record low activity: | 2010: 8 | 2010: 3 | 2003: 0 | [4] | |
| Date | Source | Named storms |
Hurricanes | Major hurricanes |
Ref |
| May 24, 2018 | NOAA | 14–20 | 7–12 | 3–7 | [5] |
| May 25, 2018 | SMN | 18 | 6 | 4 | [6] |
| Area | Named storms | Hurricanes | Major hurricanes | Ref | |
| Actual activity: | EPAC | 18 | 11 | 8 | |
| Actual activity: | CPAC | 1 | 1 | 1 | |
| Actual activity: | 19 | 12 | 9 | ||
On May 24, 2018, the National Oceanic and Atmospheric Administration released its annual forecast, predicting a 80% chance of a near- to above-average season in both the Eastern and Central Pacific basins, with a total of 14–20 named storms, 7–12 hurricanes, and 3–7 major hurricanes.[5] On May 25, the Servicio Meteorológico Nacional (SMN) issued its first forecast for the season, predicting a total of 18 named storms, 6 hurricanes, and 4 major hurricanes to develop.[6]
Seasonal summary
| Most intense Pacific hurricane seasons | ||
|---|---|---|
| Rank | Season | ACE |
| 1 | 1992 | 295 |
| 2 | 2018 | 294 |
| 3 | 2015 | 287 |
| 4 | 1990 | 245 |
| 5 | 1978 | 207 |
| 6 | 1983 | 206 |
| 7 | 1993 | 201 |
| 8 | 2014 | 199 |
| 9 | 1984 | 193 |
| 10 | 1985 | 192 |
The Accumulated Cyclone Energy index for the 2018 Pacific hurricane season, as of 21:00 UTC October 12, is 293.6825 units (177.775 units for the Eastern Pacific and 115.9075 units for the Central Pacific).[nb 1] Broadly speaking, ACE is a measure of the power of a tropical or subtropical storm multiplied by the length of time it existed. Therefore, a stronger storm with a longer duration, such as Hurricane Hector, contributes more to the seasonal total than several short-lived, weaker storms combined. This total ranks it as the second-most active season on record, with only the 1992 season having a higher ACE value.
The 2018 season began early with the formation of Tropical Depression One-E on May 10, which formed five days prior to the official start of the season. June was an extraordinarily active month throughout the basin, breaking the record for number of tropical cyclones (six), as well as tying the records for number of named storms (five) and major hurricanes (two).[7] Fabio's intensification into a tropical storm on July 1 marked the earliest date of a season's sixth named storm, beating the previous record of July 3 set in both 1984 and 1985.[8] Activity abruptly slowed thereafter, with only three tropical cyclones forming during the month of July.[9] One of these cyclones continued to intensify into Hurricane Hector in August, which became the third major hurricane of the season. In August, activity increased dramatically, with Tropical Storm Ileana and Hurricane John forming just a day apart on August 4 and August 5, respectively, followed by Tropical Storm Kristy two days later. Hurricane Lane formed in mid-August and became the first Category 5 storm of the season, and the wettest tropical cyclone on record in Hawaii since Hiki in 1950. Hurricanes Miriam and Norman soon followed, forming in late August, becoming the seventh and eighth hurricanes of the season, respectively. Norman became the fifth major hurricane of the season. Hurricane Olivia formed soon after in early September, and became the sixth major hurricane of the season.
Systems
Tropical Depression One-E
| Tropical depression (SSHWS) | |
  | |
| Duration | May 10 – May 11 |
|---|---|
| Peak intensity | 35 mph (55 km/h) (1-min) 1007 mbar (hPa) |
In early May, a westward-tracking trough or tropical wave embedded in the monsoon trough interacted with a convectively-coupled Kelvin wave. This interaction led to a large area of shower and thunderstorm activity well southwest of Mexico,[10] which the National Hurricane Center began monitoring for tropical cyclone formation on May 7.[11] The disturbance organized over the next 48 hours but lacked a well-defined center needed for classification;[12] by late on May 9, environmental conditions were becoming less favorable for development.[13] In spite of this, an increase in convection and formation of a well-defined circulation led to the designation of the season's first tropical depression at 21:00 UTC on May 10.[14] The system failed to intensify after formation and, owing to strong westerly wind shear, ultimately degenerated into a remnant low by 18:00 UTC on May 11.[15]
Hurricane Aletta
| Category 4 hurricane (SSHWS) | |
  | |
| Duration | June 6 – June 11 |
|---|---|
| Peak intensity | 140 mph (220 km/h) (1-min) 943 mbar (hPa) |
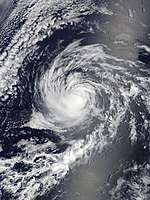
A tropical wave departed western Africa on May 22, moving inconspicuously across the Atlantic and failing to develop convection until it was south of the Gulf of Tehuantepec on June 3. Following the formation of a well-defined center, the system was upgraded to a tropical depression around 00:00 UTC on June 6. It intensified into Tropical Storm Aletta six hours later. Subtropical ridging over the United States directed the system west-northwest, while ideal environmental conditions allowed Aletta to reach hurricane strength around 18:00 UTC on June 7. A period of rapid deepening ensued shortly thereafter, with maximum winds increasing from 75 mph (120 km/h) to 140 mph (220 km/h) within an 18-hour period.[16] At peak, the hurricane was characterized by a distinct eye embedded within cloud tops colder than -70 °C (-94 °F).[17] A track into cooler waters and a more stable air mass caused Aletta to weaken as quickly as it intensified, falling from Category 4 strength to a tropical storm within 30 hours. After losing its associated deep convection, the system degenerated to a remnant low around 12:00 UTC on June 11. The low meandered for several days, before dissipating early on June 16.[16]
Hurricane Bud
| Category 4 hurricane (SSHWS) | |
  | |
| Duration | June 9 – June 15 |
|---|---|
| Peak intensity | 130 mph (215 km/h) (1-min) 948 mbar (hPa) |
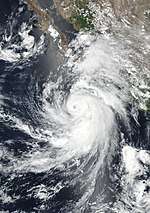
A broad area of disturbed weather formed west of Costa Rica on June 5 in association with a westward-moving tropical wave.[18] Gradual organization occurred as the wave tracked generally westward across the eastern Pacific Ocean. On June 9, the disturbance developed a well-defined surface circulation, leading to the classification of a tropical depression at 21:00 UTC.[19] Six hours later, the depression strengthened into Tropical Storm Bud.[20] A mid-level ridge to the storm's north directed it on a northwest heading for several days,[21] while favorable environmental conditions led to rapid intensification. Bud attained hurricane strength by 21:00 UTC on June 10,[22] and continued intensification up to its peak as a Category 4 hurricane with winds of 130 mph (215 km/h) around 06:00 UTC on June 12.[23] The effects of cold water upwelling prompted a rapid weakening trend shortly after peak, with Bud falling to a tropical storm by 12:00 UTC on June 13.[24] The system made landfall near Cabo San Lucas with winds of 45 mph (75 km/h), shortly after 00:00 UTC on June 15, before progressing into the Gulf of California,[25] where it ultimately degenerated to a remnant low around 21:00 UTC that day.[26]
Tropical Storm Carlotta
| Tropical storm (SSHWS) | |
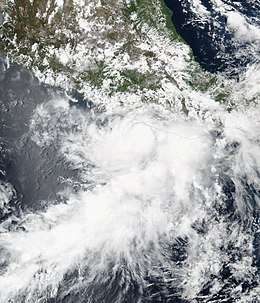  | |
| Duration | June 14 – June 19 |
|---|---|
| Peak intensity | 65 mph (100 km/h) (1-min) 997 mbar (hPa) |
A broad area of low pressure formed south of Mexico on June 12,[27] organizing into the season's fourth tropical depression by 21:00 UTC on June 14 and further into Tropical Storm Carlotta around 18:00 UTC on June 15.[28][29] Initial forecasts showed the storm only slightly intensifying before moving ashore the coastline of Mexico;[30] instead, Carlotta stalled just offshore and strengthened to attain peak winds of 65 mph (100 km/h) as it established an inner core and eye.[31] Interaction between the system's eyewall and land prompted a swift weakening trend as it paralleled the Mexican shoreline, and Carlotta fell to tropical depression intensity by 18:00 UTC on June 17, before degenerating to a remnant low around 03:00 UTC on June 19.[32][33]
Tropical Storm Daniel
| Tropical storm (SSHWS) | |
  | |
| Duration | June 24 – June 26 |
|---|---|
| Peak intensity | 45 mph (75 km/h) (1-min) 1003 mbar (hPa) |
Late on June 21, the NHC began monitoring a surface trough and its associated disorganized convection several hundred miles southwest of Baja California. Environmental conditions were expected to be marginally conducive for development as it moved north-northwestward.[34] Convection began to show signs of organization early on June 23,[35] and this process led to the formation of a tropical depression by 03:00 UTC on the next morning, as spiral bands wrapped into the storm's well-defined center.[36] At 15:00 UTC on June 24, the depression was upgraded to a tropical storm and was assigned the name Daniel.[37] At 18:00 UTC on June 24, Tropical Storm Daniel reached peak intensity with sustained winds of 45 mph.[38] At 15:00 UTC on June 25, Daniel began to weaken as it moved over seas cooler than 25 °C (77 °F).[39] The system weakened to a tropical depression at 18:00 UTC that day.[40] At 15:00 UTC on June 26, Daniel degenerated into a remnant low, as it lost all convection and was reduced to a swirl of low-level clouds.[41]
Tropical Storm Emilia
| Tropical storm (SSHWS) | |
  | |
| Duration | June 27 – July 1 |
|---|---|
| Peak intensity | 60 mph (95 km/h) (1-min) 997 mbar (hPa) |
On June 23, the NHC noted the potential for tropical cyclogenesis from a tropical wave crossing over Costa Rica. Environmental conditions were expected to be conducive for development as it moved westward.[42] The system then steadily organized over warm waters, developing into Tropical Depression Six-E at 18:00 UTC June 27, about 480 miles (770 km) southwest of Manzanillo, Mexico.[43] It gradually strengthened into Tropical Storm Emilia at 12:00 UTC on June 28.[43] At 12:00 UTC on June 29, Emilia reached its peak intensity with maximum sustained winds of 60 mph (95 km/h); however, it was then subject to strong wind shear.[43] The shear took its toll on Emilia, and by 12:00 UTC the next day, it weakened into a tropical depression.[43] Finally, at 00:00 UTC on July 2, Emilia degenerated into a remnant low, as it lost its convection and was reduced to a swirl of clouds.[43]
Hurricane Fabio
| Category 2 hurricane (SSHWS) | |
  | |
| Duration | June 30 – July 6 |
|---|---|
| Peak intensity | 110 mph (175 km/h) (1-min) 964 mbar (hPa) |
The NHC first noted the potential for tropical cyclogenesis from a tropical wave crossing over Honduras and Nicaragua at 18:00 UTC on June 24.[44] Subsequent development was expected of the system as it moved westward. It steadily organized over warm waters and transitioned into Tropical Depression Seven-E at 21:00 UTC June 30, 490 miles (790 km) southwest of Acapulco, Mexico.[45] The system gradually strengthened into Tropical Storm Fabio at 09:00 UTC on July 1.[46] With SSTs of 30 °C (86 °F) and almost no wind shear, Fabio began to intensify, quickly strengthening into a hurricane by 15:00 UTC on July 2.[47] Initially, forecasters at the NHC predicted that Fabio would intensify further and become a major hurricane, although it failed to do so and peaked with maximum sustained winds of 110 mph (175 km/h), just shy of major hurricane status.[48] Afterward, Fabio began to rapidly weaken as it moved over cooler waters. At 15:00 UTC on July 6, Fabio degenerated into a remnant low as it lost its convection while located 1,285 miles (2,065 km) off the coast of the Baja Peninsula.[49]
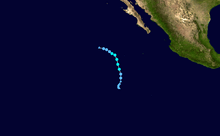
Tropical Storm Gilma
| Tropical storm (SSHWS) | |
  | |
| Duration | July 26 – July 29 |
|---|---|
| Peak intensity | 40 mph (65 km/h) (1-min) 1006 mbar (hPa) |
On July 18, the NHC forecast the development of an area of low pressure over the east Pacific Ocean within the next few days.[50] A weak area of low pressure developed several hundred miles south-southeast of the Gulf of Tehuantepec on July 22. Little development occurred over the next few days as the low moved northwestward across the Pacific Ocean. However, shower and thunderstorm activity associated with the low began to quickly organize on July 26, leading to the classification of a tropical depression at 21:00 UTC on July 26.[51] At 09:00 UTC the following day, the depression strengthened into Tropical Storm Gilma.[52] However, northwesterly wind shear soon exposed the center of circulation, causing Gilma to weaken to a tropical depression just twelve hours later.[53] At 21:00 UTC on July 29, the system degenerated into a remnant low as it had lacked organized deep convection for 12 hours.[54]
Tropical Depression Nine-E
| Tropical depression (SSHWS) | |
  | |
| Duration | July 26 – July 27 |
|---|---|
| Peak intensity | 35 mph (55 km/h) (1-min) 1007 mbar (hPa) |
The NHC began monitoring a disorganized area of low pressure in the deep tropical Pacific Ocean on July 24 for tropical cyclone development.[55] Gradual organization ensued as the low moved westward, and by July 26, it had organized sufficiently to be classified as a tropical depression.[56] The tropical depression failed to organize, however, and the center soon became difficult to locate on satellite imagery.[57] After having lasted less than a day as a tropical cyclone, the depression opened up into a trough, as it became embedded within the Intertropical Convergence Zone at 12:00 UTC on July 27.[58] Although Nine-E's remnants produced intermittent convection; high wind shear and dry air prevented it from regenerating back into a tropical cyclone, and the storm's remnants dissipated a few days later.[59]
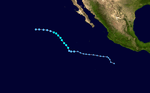
Hurricane Hector
| Category 4 hurricane (SSHWS) | |
  | |
| Duration | July 31 – August 13 (Exited basin) |
|---|---|
| Peak intensity | 155 mph (250 km/h) (1-min) 936 mbar (hPa) |
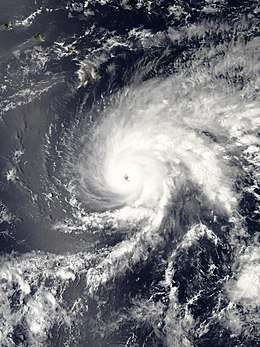
Late on July 26, the NHC noted the development of an area of low pressure that was forecast to form a couple hundred miles west-southwest of Mexico.[60] A broad area of low pressure formed several hundred miles south-southeast of Acapulco, Mexico, at 12:00 UTC on July 28.[61] The system gradually developed into a tropical depression at 21:00 UTC on July 31.[62] The depression quickly organized, developing a more defined center and spiral banding, and at 03:00 UTC on August 1, it strengthened into Tropical Storm Hector.[63] Hector further strengthened and became a hurricane at 14:00 UTC on August 2.[64] Afterward, the small hurricane rapidly strengthened, becoming a strong Category 2 hurricane just six hours later.[65] However, the eye became clouded and ill-defined shortly afterward, while the storm underwent an eyewall replacement cycle, and Hector's intensification halted momentarily, as northeasterly shear and dry air impinged on the system, weakening the system back to a Category 1 hurricane.[66] However, the hurricane quickly intensified yet again, and restrengthened back into a Category 2 hurricane, and later to a Category 3 hurricane, making it the third major hurricane of the season. A strong convective band soon wrapped into Hector's central dense overcast (CDO), strengthening it to a Category 4 major hurricane.[67] On the next morning, a shrinking CDO weakened Hector back into a Category 3 storm.[68] In the following hours, Hector underwent another eyewall replacement cycle and was set to weaken thereafter. However, after the completion of the eyewall replacement cycle, Hector rapidly intensified back to a high-end Category 4 storm on August 6. At 09:00 UTC on August 8, Hector weakened to a Category 3 hurricane. At 21:00 UTC, the CPHC reported that Hector was passing about 200 miles (320 km) south of the Big Island with winds of 115 mph. At the same time, Hector began a third eyewall replacement cycle. By 09:00 UTC on August 9, Hector completed the eyewall replacement cycle.[69]
By 15:00 UTC on the same day, Hector began to intensify once again, as it moved due west. At 21:00 UTC on August 10, Hector reached its secondary peak intensity with winds of 140 mph (220 km/h) as it began to turn west-northwest. On August 11, Hector began another weakening trend as increasing wind shear began to take a toll on the system. By this time, the hurricane set a record for the longest consecutive duration as a major hurricane in the northeastern Pacific. Late on August 11, Hector weakened below major hurricane strength due to increasing wind shear, a status it had held for nearly eight days. Hector weakened to Category 1 status on August 12. On August 13 at 15:00 UTC, Hector crossed the International Date Line as a tropical storm.[70]
Tropical Storm Ileana
| Tropical storm (SSHWS) | |
  | |
| Duration | August 4 – August 7 |
|---|---|
| Peak intensity | 65 mph (100 km/h) (1-min) 998 mbar (hPa) |
A tropical wave entered the eastern Pacific Ocean on August 3, where the NHC began to monitor the system for tropical development.[71] Although the system was initially disorganized, it rapidly organized over the next two days, and on August 4, the system developed into a tropical depression while located south of the Gulf of Tehuantepec.[72] The depression continued to organize that night through the next day, and at 21:00 UTC on August 5, the system strengthened into Tropical Storm Ileana.[73] After strengthening to peak winds of 65 mph (100 km/h), Ileana weakened as it began to feel the influence of the much larger Hurricane John, with the two systems experiencing the Fujiwhara effect. On August 7, the small circulation of Ileana dissipated, as the storm was absorbed by John.[74]
Heavy rain in Guerrero resulted in three deaths, while rip currents caused an additional fatality along the coast of Acapulco.[75]
Hurricane John
| Category 2 hurricane (SSHWS) | |
  | |
| Duration | August 5 – August 10 |
|---|---|
| Peak intensity | 105 mph (165 km/h) (1-min) 969 mbar (hPa) |
On July 29, the NHC began forecasting the development of an area of low pressure that was expected to form several hundred miles off the Mexican coast.[76] A broad area of low pressure formed several hundred miles south of the Gulf of Tehuantepec on August 2.[77] Gradual organization occurred as the low moved slowly west-northwestward, and at 21:00 UTC on August 5, the low had organized sufficiently to be classified as the season's twelfth tropical depression.[78] The depression quickly strengthened into Tropical Storm John six hours later.[79] Amid very favorable environmental conditions, John rapidly intensified, and by 21:00 UTC on August 6, John had become the fifth hurricane of the season, and soon began to interact with Tropical Storm Ileana to the east, due to the Fujiwhara effect.[80] On August 7, Hurricane John absorbed the smaller Tropical Storm Ileana, while continuing to strengthen.[74] At 15:00 UTC August 7, John reached peak intensity with winds of 105 mph (165 km/h).[81] However, John began to move over cooler waters and began to weaken. The cyclone weakened to a Category 1 hurricane by 15:00 UTC on August 8, and to tropical storm status by 09:00 UTC on August 9, until it finally degenerated into a remnant low at 15:00 UTC on August 10.[82]
Although John never made landfall, it produced high surf along the coastlines of Baja California and Southern California.[83]
Tropical Storm Kristy
| Tropical storm (SSHWS) | |
  | |
| Duration | August 7 – August 11 |
|---|---|
| Peak intensity | 70 mph (110 km/h) (1-min) 991 mbar (hPa) |
On August 2, an area of disturbed weather associated with a tropical wave formed south of Mexico[84], the NHC began monitoring the disturbance for potential tropical development. The system lingered for days without developing as it tracked generally towards the west, finally at 05:00 UTC August 7, the well-defined low was embedded within a developing area of convection, along with tight banding near the center and was classified as Tropical Depression Thirteen-E accordingly.[85] The depression developed into Tropical Storm Kristy by 09:00 UTC the same day.[86] Kristy gradually strengthened over the next few days, and at 03:00 UTC on August 10, it attained its peak intensity with maximum sustained winds of 70 mph (110 km/h), just short of hurricane status.[87] However, as Kristy moved over progressively cooler waters, it gradually weakened. By 15:00 UTC August 11, Kristy degenerated into a remnant low as cooler waters and wind shear had taken its toll on Kristy's cloud structure which consisted of a swirl of low clouds with some mid and high-level clouds.[88] Despite degenerating into a remnant low, showers and thunderstorms redeveloped in association with Post-Tropical Cyclone Kristy by 00:00 UTC August 12 and the disturbance was monitored, however cold waters prevented the system to regenerate back into a tropical cyclone.[89]
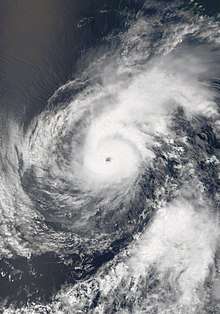
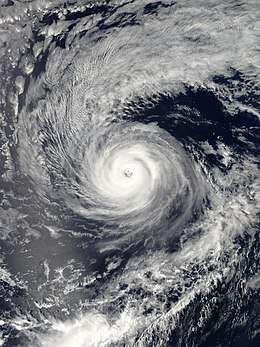
Hurricane Lane
| Category 5 hurricane (SSHWS) | |
  | |
| Duration | August 15 – August 29 |
|---|---|
| Peak intensity | 160 mph (260 km/h) (1-min) 922 mbar (hPa) |
A tropical depression formed well southwest of Baja California around 03:00 UTC on August 15, from an area of disturbed weather the NHC had been monitoring for days.[90] Steered due west amid favorable environmental conditions, the system intensified into Tropical Storm Lane by 15:00 UTC on the next day,[91] and further strengthened to a hurricane around 03:00 UTC on August 17 as an eye became apparent.[92] Following the formation of an inner core, Lane began a period of rapid intensification that brought the system to its initial peak intensity as a Category 4 hurricane early on August 18.[93] It crossed into the Central Pacific thereafter, where strong westerly wind shear caused a substantial degradation in satellite presentation.[94] Upper-level winds gradually slackened, allowing Lane to regain Category 4 intensity late on August 20.[95] Despite forecasts calling for the storm to weaken, Lane continued to strengthen. By 04:30 UTC on August 22, data from a reconnaissance aircraft measured maximum 1-minute sustained winds near 160 mph (260 km/h), and Lane was upgraded to a Category 5 hurricane as it maintained a distinct eye surrounded by deep convection.[96][97][98] However, shear increased, weakening Lane to a Category 4 as it was guided towards Hawaii by a strengthening ridge.[99] Rapid weakening ensued thereafter, weakening Lane from a Category 2 to a tropical storm in 6 hours due to 35 to 40 knots of wind shear impacting Lane's core convection.[100] Early on August 26, Lane made the turn west that it had been predicted to make as it was embedded in the trade winds.[101] At 15:00 UTC August 26, Lane weakened into a tropical depression as its low level center was nearly entirely exposed.[102] However, at 15:00 UTC on August 27, Lane re-intensified into a tropical storm as a convective bursts partially covered the low level center.[103] However, this re-intensification would be short lived, as 18 hours later, Lane weakened back into a tropical depression, as its low-level circulation center was once again exposed, due to constant wind shear.[104] Finally, at 3:00 UTC on August 29, Lane degenerated into a remnant low, as its circulation became elongated and cloud tops near the center warmed and were displaced from the center.[105]
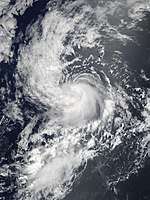
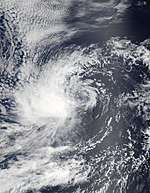
Hurricane Miriam
| Category 2 hurricane (SSHWS) | |
  | |
| Duration | August 26 – September 2 |
|---|---|
| Peak intensity | 100 mph (155 km/h) (1-min) 974 mbar (hPa) |
At 21:00 UTC on August 22, forecasters at the NHC forecasted that an area of low pressure could form several hundred miles southwest of the Baja California Sur.[106] Shortly afterward, on August 24, a trough of low pressure formed where the NHC predicted where it would be, predictions said that gradual development would be possible of the system.[107] Gradual development ensued and a tropical depression formed at 9:00 UTC on August 26.[108] At 15:00 UTC on the same day, the depression intensified into a tropical storm, where it was given the name Miriam.[109] The system gradually intensified and at 21:00 UTC on August 29, Miriam intensified into a hurricane.[110] At 0:00 UTC on August 30, Miriam entered the Central Pacific where responsibility was handed over to the CPHC. At 12:00 UTC on August 31, Miriam intensified to attain its peak intensity as a Category 2 hurricane.[111] Soon thereafter, Miriam began to be affected by wind shear, weakening into a Category 1 hurricane on August 31.[112][113] Late on September 2, Miriam degenerated into a remnant low, due to strong wind shear.
Hurricane Norman
| Category 4 hurricane (SSHWS) | |
  | |
| Duration | August 28 – September 9 |
|---|---|
| Peak intensity | 150 mph (240 km/h) (1-min) 937 mbar (hPa) |
Hurricane Norman originated from a broad area of low pressure that formed several hundred miles south-southwest of Acapulco, Mexico on August 25.[114] Traveling west-northwest,[115] the system coalesced into a tropical depression by at 15:00 UTC on August 28 while situated approximately 420 miles (675 km) south-southwest of the southern tip of Baja California.[116] A subtropical ridge steered the system west for several days.[117] Early on August 29, the depression intensified into a tropical storm and received the name Norman.[118] Favorable environmental conditions enabled quick intensification, and the system achieved hurricane strength early on August 30.[119] Rapid intensification ensued throughout the day, culminating with Norman attaining its peak intensity at 15:00 UTC, with sustained winds of 150 mph (240 km/h) and a central pressure of 937 mbar (27.67 inHg).[120][121][122] During a 24-hour period, the hurricane's winds increased by 80 mph (130 km/h), the largest such increase since Hurricane Patricia in 2015.[123]
The combination of an eyewall replacement cycle and increasing wind shear induced weakening beginning on August 31. At 03:00 UTC on August 31, Norman turned to the west-southwest due to a deep-layer ridge to the north.[124] [125][126] Norman fell to Category 2 status for a period,[127] before unexpectedly rapidly intensifying back to a Category 4 hurricane on September 2. The storm attained a secondary peak with winds of 130 mph (215 km/h) and a pressure of 948 mbar (28.00 inHg).[128] Initially proving resilient to adverse conditions, Norman succumbed to increasing wind shear and lower sea surface temperatures on September 3. Its central dense overcast warmed and its eye filled.[129] At the same time, Norman took a turn to a more westerly direction.[130] On September 4, the hurricane crossed west of 140°W, and warning responsibility shifted to the Central Pacific Hurricane Center (CPHC).[131] On the next day, another bout of unexpected intensification ensued and Norman regained major hurricane status.[132] However, wind shear increased once again thereafter, and Norman weakened into a Category 1 hurricane on September 6. On September 7, Norman weakened further to a tropical storm as it began to lose its tropical characteristics. The CPHC issued its final advisory on Norman at 21:00 UTC on September 8, as it was rapidly becoming extratropical; Norman subsequently completed its extratropical transition on the next day.[133]
Hurricane Olivia
| Category 4 hurricane (SSHWS) | |
  | |
| Duration | September 1 – September 14 |
|---|---|
| Peak intensity | 130 mph (215 km/h) (1-min) 948 mbar (hPa) |
Hurricane Olivia originated from a broad area of low pressure that formed several hundred miles southwest of Mexico on August 30.[134] The National Hurricane Center (NHC) continued to monitor the disturbance as it moved west-northwest for the next couple of days.[135] At 03:00 UTC on September 1, the NHC declared that a tropical depression had formed about 400 miles (645 km) southwest of Mexico.[136] Due to unfavorable conditions, the depression slowly became more organized over the next day and half before strengthening into Tropical Storm Olivia at 09:00 UTC on September 2.[137] At that time, wind shear from the north-northeast was continuing to prevent significant development of the system.[138] Over the next day and a half, Olivia changed little in strength before beginning a period of rapid intensification on September 3.[139][140] At 03:00 UTC on September 4, Olivia became a Category 1 hurricane.[141] Olivia continued to rapidly intensify, becoming a Category 2 hurricane twelve hours later.[142] At 21:00 UTC on September 4, Olivia became the sixth major hurricane of the season.[143] Six hours later, Olivia reached its initial peak intensity, with maximum sustained winds of 125 mph (205 km/h) and a minimum central pressure of 955 mbar (28.20 inHg).[144] Olivia then started weakening due to increasing wind shear and lower sea surface temperatures at 09:00 UTC on September 5. Olivia then weakened more and fell below major hurricane strength at 15:00 UTC on the same day.[145] Unexpectedly, Olivia intensified into a Category 4 hurricane with a new peak intensity of 130 mph (215 km/h) and a minimum central pressure of 948 mbar (28.00 inHg).[146] Olivia then headed into the Central Pacific Basin with maximum sustained winds of 85 mph (140 km/h).[147] As Olivia got closer to the Hawaiian Islands, tropical storm watches were issued for Oahu, Maui, Molokai, Lanai, Kahoolawe, and The Big Island.[148] At 21:00 UTC on September 12, Olivia made landfall in Northwest Maui and Lanai as a tropical storm.[149] Olivia weakened into a tropical depression as wind shear affected the storm on September 13.[150] Olivia then degenerated into a remnant low on September 14 and dissipated on September 19, after crossing the International Date Line.
Tropical Storm Paul
| Tropical storm (SSHWS) | |
  | |
| Duration | September 8 – September 12 |
|---|---|
| Peak intensity | 45 mph (75 km/h) (1-min) 1002 mbar (hPa) |
A large area of disorganized thunderstorms and cloudiness formed several hundred miles off the southwest coast of Mexico on September 4.[151] The disturbance gradually organized as it moved slowly west-northwestward, and by 15:00 UTC on September 8, it had acquired sufficient organized convection to be classified as a tropical depression.[152] Although initial forecasts called for the depression to eventually strengthen into a hurricane, it remained a sheared tropical cyclone with its center of circulation exposed on the eastern side. At 09:00 UTC on September 9, the depression strengthened into Tropical Storm Paul.[153] Despite a moderately favorable environment, Paul failed to strengthen significantly and remained a poorly organized system, eventually weakening to a tropical depression early on September 11.[154] After lacking deep convection for over 12 hours, Paul degenerated into a remnant low on September 12, marking the first time since August 14 that no tropical cyclones were active in the northeastern Pacific.[155]
Tropical Depression Nineteen-E
| Tropical depression (SSHWS) | |
  | |
| Duration | September 19 – September 20 |
|---|---|
| Peak intensity | 35 mph (55 km/h) (1-min) 1002 mbar (hPa) |
At 0:00 UTC on September 11, forecasters at the NHC predicted that an area of low pressure would develop within a few days.[156] At 12:00 UTC on September 14, a broad area of disturbed weather had developed, as expected.[157] Some development followed, but the system began to approach the Baja California Peninsula, which was initially expected to cause the system to fail to develop due to land interaction.[158] Despite land interaction, the system continued to organize, and at 15:00 UTC on September 19, Tropical Depression Nineteen-E formed within an inverted trough in the Gulf of California, with the NHC initiating advisories on the system.[159] The storm dumped large amounts of rain on Baja California Sur and northwestern Mexico while it was still offshore.[160] However, the depression was short-lived, as the storm dissipated after making landfall in northwestern Mexico, early on September 20.[161]
Hurricane Rosa
| Category 4 hurricane (SSHWS) | |
  | |
| Duration | September 25 – October 2 |
|---|---|
| Peak intensity | 145 mph (230 km/h) (1-min) 940 mbar (hPa) |
At 18:00 UTC on September 19, the NHC forecasted an area of low pressure that would develop in a few days.[162] At 00:00 UTC on September 23, a broad area of disturbed weather formed where the NHC predicted.[163] Gradual development occurred and the system organized into a tropical depression at 09:00 UTC on September 25.[164] The depression then developed into a tropical storm and was given the name, Rosa, at 15:00 UTC on the same day.[165] Rosa gradually strengthened and at 03:00 UTC on September 26, Rosa intensified into a hurricane.[166] At 21:00 UTC on September 27, Rosa then rapidly intensified and became the seventh Category 4 hurricane of the season.[167] Late on September 28, Rosa started weakening due to an eyewall replacement cycle and rapidly lost structure, falling to Category 3 status.[168] Early on September 29, Rosa weakened below major hurricane status.[169] By the afternoon, Rosa started re-intensifying, with the eyewall replacement having been completed.[170] Late on September 29, Rosa started to weaken yet again, as it was impacted by high amounts of wind shear and low sea surface temperatures.[171] By September 30, Rosa had weakened to a tropical storm while approaching Baja California.[172] The storm quickly weakened into a remnant low on October 2, as it passed over the peninsula, before dissipating on the next day.[173]
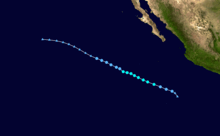
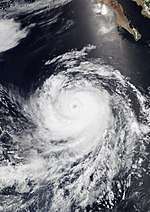
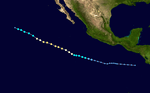
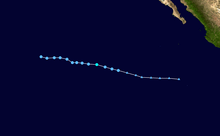
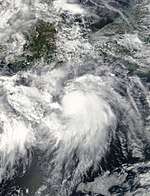
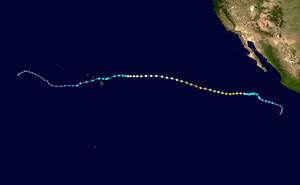
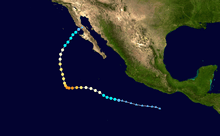
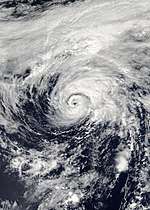
Hurricane Sergio
| Category 4 hurricane (SSHWS) | |
  | |
| Duration | September 29 – October 12 |
|---|---|
| Peak intensity | 140 mph (220 km/h) (1-min) 943 mbar (hPa) |
Late on September 25, the NHC forecasted an area of low pressure to develop within the Gulf of Tehuantepec, south of Mexico within a couple of days.[174] Early on September 26, an area of low pressure developed as expected, with the NHC initially giving the system a low chance of tropical development.[175] Over the next few days, the disturbance gradually organized while slowly moving westward, and on September 29, the disturbance organized into Tropical Storm Sergio, while situated south-southwest of Acapulco, Mexico.[176] As the system moved roughly to the west, Sergio quickly intensified, reaching Category 1 hurricane status early on October 1.[177] On October 2, Sergio intensified to a Category 2 hurricane,[178] before strengthening into a Category 3 major hurricane later that day.[179] Late on October 3, Sergio intensified into a Category 4 hurricane, becoming the record-breaking eighth hurricane in the East Pacific basin of Category 4 or 5 intensity.[180] Early on October 4, Sergio reached its peak intensity, with maximum sustained winds of 140 miles per hour (230 km/h) and a minimum central pressure of 943 millibars (27.8 inHg).[181] Afterward, Sergio began to weaken, dropping to Category 3 intensity by 03:00 UTC on the next day.[182] Early on October 6, Sergio had restrengthened into a strong Category 3 hurricane, while continuing westward,[183] and the storm held that intensity for another day before a weakening trend resumed, weakening Sergio into a Category 2 hurricane early on October 7.[184] Sergio continued to weaken over cooler waters, and dropped to tropical storm strength late on October 9.[185] before making landfall on Baja California early on October 12. Later on the same day, Sergio weakened into a tropical depression, after making a second landfall on the Mexican mainland. Soon afterward, Sergio degenerated into a remnant low.
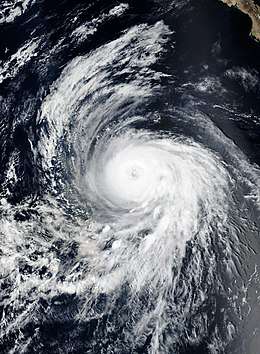
Hurricane Walaka
| Category 5 hurricane (SSHWS) | |
  | |
| Duration | September 29 – October 6 |
|---|---|
| Peak intensity | 160 mph (260 km/h) (1-min) 920 mbar (hPa) |
On September 29, a tropical disturbance to the southwest of Hawaii organized into Tropical Storm Walaka, becoming the first named storm in the Central Pacific basin since Hurricane Ulika in 2016.[186] Walaka organized into a hurricane on September 30 and began rapidly intensifying.[187] Within 24 hours, Walaka had intensified into a major hurricane.[188] Walaka continued to intensify, reaching Category 4 status at 8:00 HST (18:00 UTC) on October 1. Early on the next day, at 00:00 UTC, Walaka became the second Category 5 hurricane of the year east of the International Date Line.[189] Later on October 2, however, the hurricane underwent an eyewall replacement cycle that caused it to weaken while passing close to Johnston Atoll.[190] At 12:00 UTC on October 3, Walaka started to reintensify while moving away from Johnston Atoll and toward Papahānaumokuākea Marine National Monument. However, northwesterly wind shear began to adversely affect Walaka, causing it to weaken before crossing the archipelago.[191] Walaka continued to weaken over cooler waters further north.[192] At 15:00 UTC on October 6, Walaka transitioned into an extratropical cyclone 1,085 miles (1,740 km) north-northwest of Honolulu, Hawaii.[193] Unrelated to Walaka, Typhoon Kong-Rey developed and intensified into a Category 5-equivalent super typhoon around the same time Walaka reached its peak intensity, marking the first time since 2005 where two tropical cyclones of Category 5 strength spanned the North Pacific Ocean.
Tropical Depression Twenty-Two-E
| |||
|---|---|---|---|
| |||
| As of: | 10:00 a.m. CDT (15:00 UTC) October 14 | ||
| Location: |
17°00′N 102°48′W / 17.0°N 102.8°W ± 20 nm About 170 mi (275 km) SE of Manzanillo, Mexico | ||
| Sustained winds: |
30 knots (35 mph; 55 km/h) (1-min mean) gusting to 40 knots (45 mph; 70 km/h) | ||
| Pressure: | 1006 mbar (hPa; 29.71 inHg) | ||
| Movement: | WNW at 5 knots (6 mph; 9 km/h) | ||
| |||


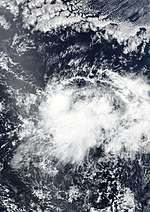
On October 14, a low-pressure system was found and the National Hurricane Center labelled it as Tropical Depression Twenty-Two E. As it formed near the coast of Mexico, Twenty-Two E sparked rain and wind warnings for Mexico.
Current storm information
As of 10:00AM CDT (15:00 UTC) October 14, Tropical Depression Twenty-Two E is located at 17°00′N 102°48′E / 17.0°N 102.8°E, about 170 km (110 mi) southeast of Manzanillo, Mexico.1 minute sustained winds are at 30 knots (35 mph; 55 km/h); gusts are reaching 40kt (45 mph;70 km/h). Minimum central pressure is estimated at 1,006 hPa (29.71 inHg). The system is currently moving west-northwestward at 5 knots (6 mph; 9 km/h).
Other systems
On August 29, an upper-level low absorbed the remnants of Hurricane Lane to the west-northwest of Hawaii.[194] The storm was assigned the designation 96C by the United States Naval Research Laboratory (NRL).[195] Traversing an area with sea surface temperatures 2 °C (3.6 °F) above-normal,[196] the system coalesced into a subtropical storm by August 31.[194] On September 2, the system reached its peak intensity and began to display an eye.[195] Afterward, the system gradually began to weaken, while accelerating northward into colder waters. On September 3, the system weakened below tropical depression intensity, back into an extratropical low. On September 4, the system was absorbed by a larger extratropical storm in the Bering Sea.[195]
Storm names
The following list of names is being used for named storms that form in the northeastern Pacific Ocean during 2018. Retired names, if any, will be announced by the World Meteorological Organization in the spring of 2019. The names not retired from this list will be used again in the 2024 season.[197] This is the same list used in the 2012 season.
For storms that form in the Central Pacific Hurricane Center's area of responsibility, encompassing the area between 140 degrees west and the International Date Line, all names are used in a series of four rotating lists.[198] The next four names that are slated for use in 2018 are shown below.
|
|
|
Season effects
This is a table of all the storms that have formed in the 2018 Pacific hurricane season. It includes their duration, names, landfall(s), denoted in parentheses, damages, and death totals. Deaths in parentheses are additional and indirect (an example of an indirect death would be a traffic accident), but were still related to that storm. Damage and deaths include totals while the storm was extratropical, a tropical wave, or a low, and all the damage figures are in 2018 USD.
| Saffir–Simpson scale | ||||||
| TD | TS | C1 | C2 | C3 | C4 | C5 |
| Storm name |
Dates active | Storm category
at peak intensity |
Max 1-min wind mph (km/h) |
Min. press. (mbar) |
Areas affected | Damage (USD) |
Deaths | Refs | ||
|---|---|---|---|---|---|---|---|---|---|---|
| One-E | May 10 – 11 | Tropical depression | 35 (55) | 1007 | None | None | None | |||
| Aletta | June 6 – 11 | Category 4 hurricane | 140 (220) | 943 | None | None | None | |||
| Bud | June 9 – 16 | Category 4 hurricane | 130 (215) | 948 | Western Mexico, Baja California Sur, Southwestern United States | Unknown | None | |||
| Carlotta | June 14 – 19 | Tropical storm | 65 (100) | 997 | Southwestern Mexico | Unknown | None | |||
| Daniel | June 24 – 26 | Tropical storm | 45 (75) | 1003 | None | None | None | |||
| Emilia | June 27 – July 1 | Tropical storm | 60 (95) | 997 | None | None | None | |||
| Fabio | June 30 – July 6 | Category 2 hurricane | 110 (175) | 964 | None | None | None | |||
| Gilma | July 26 – 29 | Tropical storm | 40 (65) | 1006 | None | None | None | |||
| Nine-E | July 26 – 27 | Tropical depression | 35 (55) | 1007 | None | None | None | |||
| Hector | July 31 – August 13[nb 2] | Category 4 hurricane | 155 (250) | 936 | Hawaii, Johnston Atoll | Minimal | None | |||
| Ileana | August 4 – 7 | Tropical storm | 65 (100) | 998 | Western Mexico, Baja California Sur | Unknown | 4 | |||
| John | August 5 – 10 | Category 2 hurricane | 105 (165) | 969 | Western Mexico, Baja California Sur, Southern California | Minimal | 3 | |||
| Kristy | August 7 – 11 | Tropical storm | 70 (110) | 991 | None | None | None | |||
| Lane | August 15 – 29 | Category 5 hurricane | 160 (260) | 922 | Hawaii | > $200 million | 1 | |||
| Miriam | August 26 – September 2 | Category 2 hurricane | 100 (155) | 974 | None | None | None | |||
| Norman | August 28 – September 9 | Category 4 hurricane | 150 (240) | 937 | Hawaii | Minimal | None | |||
| Olivia | September 1 – 14 | Category 4 hurricane | 130 (215) | 948 | Hawaii | Unknown | None | |||
| Paul | September 8 – 12 | Tropical storm | 45 (75) | 1002 | None | None | None | |||
| Nineteen-E | September 19 – 20 | Tropical depression | 35 (55) | 1002 | Baja California Sur, Northwestern Mexico | Minimal | 3 | |||
| Rosa | September 25 – October 2 | Category 4 hurricane | 145 (230) | 940 | Baja California Peninsula, Northwestern Mexico, Southwestern United States | Unknown | 15 | |||
| Sergio | September 29 – October 12 | Category 4 hurricane | 140 (220) | 943 | Baja California Peninsula, Northwestern Mexico, Southwestern United States, Texas | Unknown | None | |||
| Walaka | September 29 – October 6 | Category 5 hurricane | 160 (260) | 920 | Johnston Atoll, Northwestern Hawaiian Islands, Alaska, British Columbia | Unknown | None | |||
| Twenty-Two-E | October 14 – Present | Tropical depression | 35 (55) | 1006 | Southwestern Mexico | None | None | |||
| Season Aggregates | ||||||||||
| 23 systems | May 10 – Season ongoing | 160 (260) | 920 | > $200 million | 26 | |||||
See also
- Tropical cyclones in 2018
- List of Pacific hurricanes
- List of Pacific hurricane seasons
- 2018 Atlantic hurricane season
- 2018 Pacific typhoon season
- 2018 North Indian Ocean cyclone season
- South-West Indian Ocean cyclone seasons: 2017–18, 2018–19
- Australian region cyclone seasons: 2017–18, 2018–19
- South Pacific cyclone seasons: 2017–18, 2018–19
Notes
- ↑ The totals represent the sum of the squares for every (sub)tropical storm's intensity of over 33 knots (38 mph, 61 km/h), divided by 10,000. Calculations are provided at Talk:2018 Pacific hurricane season/ACE calcs.
- ↑ Hector did not dissipate on August 13. It crossed the International Date Line, beyond which point it was then referred to as Tropical Storm Hector. It dissipated on August 16.
References
- ↑ Dorst Neal. When is hurricane season? (Report). Atlantic Oceanographic and Meteorological Laboratory. Archived from the original on 6 December 2010. Retrieved November 25, 2010.
- ↑ Blake, Eric. Hurricane Sergio Discussion Number 19. National Hurricane Center (Report). National Oceanic and Atmospheric Administration. Retrieved 4 October 2018.
- ↑ "Background Information: East Pacific Hurricane Season". Climate Prediction Center. College Park, Maryland: National Oceanic and Atmospheric Administration. May 22, 2014. Retrieved May 29, 2014.
- 1 2 National Hurricane Center; Hurricane Research Division; Central Pacific Hurricane Center. "The Northeast and North Central Pacific hurricane database 1949–2017". United States National Oceanic and Atmospheric Administration's National Weather Service. A guide on how to read the database is available here.
- 1 2 "Forecasters predict a near- or above-normal 2018 hurricane season". National Oceanic and Atmospheric Administration. May 24, 2018.
- 1 2 Barrios, Verónica Millán. "Temporada de Ciclones 2018". smn.cna.gob.mx.
- ↑ Hurricane Specialist Unit (July 1, 2018). Monthly Tropical Weather Summary: June (Report). Miami, Florida: National Hurricane Center. Retrieved August 1, 2018.
- ↑ "Philip Klotzbach on Twitter". Twitter. Retrieved 2018-07-01.
- ↑ Hurricane Specialist Unit (August 1, 2018). Monthly Tropical Weather Summary: July (Report). Miami, Florida: National Hurricane Center. Retrieved August 1, 2018.
- ↑ Andrew Latto (May 6, 2018). Tropical Weather Discussion (Report). Miami, Florida: National Hurricane Center. Retrieved May 10, 2018.
- ↑ Lixion A. Avila (May 7, 2018). Special Graphical Tropical Weather Outlook (Report). Miami, Florida: National Hurricane Center. Retrieved May 10, 2018.
- ↑ Stacy R. Stewart (May 9, 2018). Special Graphical Tropical Weather Outlook (Report). Miami, Florida: National Hurricane Center. Retrieved May 10, 2018.
- ↑ John L. Beven II (May 9, 2018). Special Graphical Tropical Weather Outlook (Report). Miami, Florida: National Hurricane Center. Retrieved May 10, 2018.
- ↑ Lixion A. Avila (May 10, 2018). Tropical Depression One-E Discussion Number 1 (Report). Miami, Florida: National Hurricane Center. Retrieved May 10, 2018.
- ↑ Robbie Berg (July 12, 2018). Tropical Cyclone Report: Tropical Depression One-E (PDF) (Report). Miami, Florida: National Hurricane Center. Retrieved July 17, 2018.
- 1 2 Lixion A. Avila (July 31, 2018). Tropical Cyclone Report: Hurricane Aletta (PDF) (Report). Miami, Florida: National Hurricane Center. Retrieved July 31, 2018.
- ↑ David P. Zelinsky (June 8, 2018). Hurricane Aletta Discussion Number 12 (Report). Miami, Florida: National Hurricane Center. Retrieved June 8, 2018.
- ↑ Robbie Berg (June 5, 2018). "Graphical Tropical Weather Outlook". National Hurricane Center. Retrieved June 9, 2018.
- ↑ David Zelinsky (June 9, 2018). "Tropical Depression Three-E Advisory Number 1". National Hurricane Center. Retrieved June 9, 2018.
- ↑ Lixion Avila (June 10, 2018). "Tropical Storm Bud Advisory Number 2". National Hurricane Center. Retrieved June 10, 2018.
- ↑ Richard J. Pasch (June 10, 2018). Tropical Storm Bud Discussion Number 3 (Report). Miami, Florida: National Hurricane Center. Retrieved June 13, 2018.
- ↑ Lixion A. Avila (June 10, 2018). Hurricane Bud Discussion Number 5 (Report). Miami, Florida: National Hurricane Center. Retrieved June 13, 2018.
- ↑ Richard J. Pasch (June 12, 2018). Hurricane Bud Discussion Number 11 (Report). Miami, Florida: National Hurricane Center. Retrieved June 13, 2018.
- ↑ Stacy R. Stewart (June 13, 2018). Tropical Storm Bud Intermediate Advisory Number 15A (Report). Miami, Florida: National Hurricane Center. Retrieved June 18, 2018.
- ↑ John P. Cangialosi (June 14, 2018). Tropical Storm Bud Intermediate Advisory Number 21A (Report). Miami, Florida: National Hurricane Center. Retrieved June 13, 2018.
- ↑ Michael J. Brennan (June 13, 2018). Post-Tropical Cyclone Bud Discussion Number 25 (Report). Miami, Florida: National Hurricane Center. Retrieved June 15, 2018.
- ↑ Eric S. Blake (June 12, 2018). "Graphical Tropical Weather Outlook". Miami, Florida: National Hurricane Center. Retrieved June 17, 2018.
- ↑ Eric S. Blake (June 14, 2018). Tropical Depression Four-E Discussion Number 1 (Report). Miami, Florida: National Hurricane Center. Retrieved June 17, 2018.
- ↑ Eric S. Blake (June 15, 2018). Tropical Storm Carlotta Intermediate Advisory Number 4A (Report). Miami, Florida: National Hurricane Center. Retrieved June 17, 2018.
- ↑ Eric S. Blake (June 15, 2018). Tropical Storm Carlotta Discussion Number 5 (Report). Miami, Florida: National Hurricane Center. Retrieved June 17, 2018.
- ↑ John P. Cangialosi (June 16, 2018). Tropical Storm Carlotta Discussion Number 10 (Report). Miami, Florida: National Hurricane Center. Retrieved June 18, 2018.
- ↑ Richard J. Pasch (June 17, 2018). Tropical Depression Carlotta Intermediate Advisory Number 12A (Report). Miami, Florida: National Hurricane Center. Retrieved June 18, 2018.
- ↑ Stacy R. Stewart (June 18, 2018). Post-Tropical Cyclone Carlotta Discussion Number 18 (Report). Miami, Florida: National Hurricane Center. Retrieved June 18, 2018.
- ↑ David A. Zelinsky (June 21, 2018). "Graphical Tropical Weather Outlook". Miami, Florida: National Hurricane Center. Retrieved June 23, 2018.
- ↑ Robbie J. Berg (June 21, 2018). "Graphical Tropical Weather Outlook". Miami, Florida: National Hurricane Center. Retrieved June 23, 2018.
- ↑ David A. Zelinsky (June 23, 2018). Tropical Depression Five-E Discussion Number 1 (Report). Miami, Florida: National Hurricane Center. Retrieved June 23, 2018.
- ↑ John L. Beven (June 24, 2018). "Tropical Storm Daniel Discussion Number 3". Miami, Florida: National Hurricane Center. Retrieved June 24, 2018.
- ↑ John L. Beven (June 24, 2018). "Tropical Storm Daniel Discussion Number 4". Miami, Florida: National Hurricane Center. Retrieved June 25, 2018.
- ↑ John L. Beven (June 25, 2018). Tropical Storm Daniel Discussion Number 7 (Report). Miami, Florida: National Hurricane Center. Retrieved June 26, 2018.
- ↑ John L. Beven (June 25, 2018). "Tropical Depression Daniel Discussion Number 8". Miami, Florida: National Hurricane Center. Retrieved June 25, 2018.
- ↑ John L. Beven (June 26, 2018). Tropical Storm Daniel Discussion Number 11 (Report). Miami, Florida: National Hurricane Center. Retrieved June 26, 2018.
- ↑ Robbie J. Berg (June 27, 2018). "NHC Graphical Tropical Outlook". Miami, Florida: National Hurricane Center. Retrieved June 27, 2018.
- 1 2 3 4 5 Stacy R. Stewart (August 21, 2018). Tropical Cyclone Report: Tropical Storm Emilia (PDF) (Report). Miami, Florida: National Hurricane Center. Retrieved August 27, 2018.
- ↑ John L. Beven (June 24, 2018). "NHC Graphical Outlook Archive". Miami, Florida: National Hurricane Center. Retrieved June 29, 2018.
- ↑ David P. Zelinsky (June 24, 2018). "Tropical Depression Seven-E Discussion Number 1". Miami, Florida: National Hurricane Center. Retrieved June 24, 2018.
- ↑ John L. Beven (July 1, 2018). "Tropical Storm Fabio Discussion Number 3". Miami, Florida: National Hurricane Center. Retrieved July 2, 2018.
- ↑ Daniel Brown (July 2, 2018). "Hurricane Fabio Discussion Number 8". Miami, Florida: National Hurricane Center. Retrieved July 2, 2018.
- ↑ John P. Cangialosi (July 4, 2018). "Hurricane Fabio Discussion Number 14". Miami, Florida: National Hurricane Center. Retrieved July 4, 2018.
- ↑ Lixion Avila (July 6, 2018). "Post-Tropical Cyclone Fabio Discussion Number 24". Miami, Florida: National Hurricane Center. Retrieved July 6, 2018.
- ↑ Eric Blake (July 18, 2018). "NHC Graphical Outlook Archive". Miami, Florida: National Hurricane Center. Retrieved July 27, 2018.
- ↑ Lixion Avila (July 26, 2018). "Tropical Depression Eight-E Advisory Number 1". Miami, Florida: National Hurricane Center. Retrieved July 27, 2018.
- ↑ Jack Beven (July 27, 2018). "Tropical Storm Gilma Advisory Number 3". Miami, Florida: National Hurricane Center. Retrieved July 27, 2018.
- ↑ John P. Cangialosi; Lixion Avila (July 27, 2018). "Tropical Depression Gilma Advisory Number 5". Miami, Florida: National Hurricane Center. Retrieved July 27, 2018.
- ↑ John P. Cangialosi (July 29, 2018). "Post-Tropical Cyclone Gilma Discussion Number 13". Miami, Florida: National Hurricane Center. Retrieved July 31, 2018.
- ↑ David P. Zelinsky (July 24, 2018). "NHC Graphical Outlook Archive". Miami, Florida: National Hurricane Center. Retrieved July 27, 2018.
- ↑ John P. Cangialosi (July 26, 2018). "Tropical Depression Nine-E Advisory Number 1". Miami, Florida: National Hurricane Center. Retrieved July 27, 2018.
- ↑ David P. Zelinsky (July 27, 2018). "Tropical Depression Nine-E Discussion Number 2". Miami, Florida: National Hurricane Center. Retrieved July 27, 2018.
- ↑ John P. Cangialosi (July 27, 2018). "Remnants Of Nine-E Discussion Number 4". Miami, Florida: National Hurricane Center. Retrieved July 27, 2018.
- ↑ Zelinsky, David (August 24, 2018). "Tropical Depression Nine-E" (PDF). nhc.noaa.gov. Archived from the original (PDF) on August 24, 2018. Retrieved October 6, 2018.
- ↑ Lixion A. Avila (July 26, 2018). "NHC Graphical Outlook Archive". Miami, Florida: National Hurricane Center. Retrieved July 31, 2018.
- ↑ John P. Cangialosi (July 26, 2018). "NHC Graphical Outlook Archive". Miami, Florida: National Hurricane Center. Retrieved July 31, 2018.
- ↑ Stacy R. Stewart (July 31, 2018). "Tropical Depression Ten-E Advisory Number 1". Miami, Florida: National Hurricane Center. Retrieved July 31, 2018.
- ↑ Daniel P. Brown (July 31, 2018). "Tropical Storm Hector Advisory Number 2". Miami, Florida: National Hurricane Center. Retrieved July 31, 2018.
- ↑ Robbie Berg; Michael J. Brennan (August 2, 2018). "Hurricane Hector Tropical Cyclone Update". Miami, Florida: National Hurricane Center. Retrieved August 2, 2018.
- ↑ Eric S. Blake (August 3, 2018). "Hurricane Hector Advisory Number 9". Miami, Florida: National Hurricane Center. Retrieved August 3, 2018.
- ↑ Jack Beven (August 3, 2018). "Hurricane Hector Discussion Number 10". Miami, Florida: National Hurricane Center. Retrieved August 3, 2018.
- ↑ John L. Beven (August 4, 2018). Hurricane Hector Discussion Number 18 (Report). Miami, Florida: National Hurricane Center. Retrieved August 5, 2018.
- ↑ Stacy R. Stewart (August 5, 2018). Hurricane Hector Discussion Number 19 (Report). Miami, Florida: National Hurricane Center. Retrieved August 5, 2018.
- ↑ Houston, Sam (August 9, 2018). Hurricane Hector Discussion Number 36. Central Pacific Hurricane Center (Report). National Oceanic and Atmospheric Administration. Retrieved August 9, 2018.
- ↑ Houston, Sam (August 13, 2018). Tropical Storm Hector Advisory Number 53. Central Pacific Hurricane Center (Report). National Oceanic and Atmospheric Administration. Retrieved August 17, 2018.
- ↑ Daniel P. Brown (July 18, 2018). "NHC Graphical Outlook Archive". Miami, Florida: National Hurricane Center. Retrieved July 27, 2018.
- ↑ Robbie Berg (August 4, 2018). "Tropical Depression Eleven-E Advisory Number 1". Miami, Florida: National Hurricane Center. Retrieved August 4, 2018.
- ↑ Richard Pasch (August 5, 2018). "Tropical Storm Ileana Advisory Number 1". Miami, Florida: National Hurricane Center. Retrieved August 5, 2018.
- 1 2 Daniel P. Brown (August 7, 2018). "Remnants of Ileana Discussion Number 12". Miami, Florida: National Hurricane Center. Retrieved August 7, 2018.
- ↑ "Van 4 muertos por efectos de la tormenta "Ileana" en Guerrero". El Diaro de Coahuila (in Spanish). August 6, 2018. Retrieved August 8, 2018.
- ↑ John P. Cangialosi (July 29, 2018). "NHC Graphical Outlook Archive". Miami, Florida: National Hurricane Center. Retrieved August 6, 2018.
- ↑ Eric S. Blake (August 2, 2018). "NHC Graphical Outlook Archive". Miami, Florida: National Hurricane Center. Retrieved August 6, 2018.
- ↑ Daniel P. Brown (August 5, 2018). "Tropical Depression Twelve-E Advisory Number 1". Miami, Florida: National Hurricane Center. Retrieved August 6, 2018.
- ↑ Jack Beven (August 6, 2018). "Tropical Storm John Advisory Number 2". Miami, Florida: National Hurricane Center. Retrieved August 6, 2018.
- ↑ Daniel P. Brown (August 6, 2018). "Hurricane John Advisory Number 5". Miami, Florida: National Hurricane Center. Retrieved August 6, 2018.
- ↑ Daniel Brown (August 7, 2018). "Hurricane John Discussion Number 9". Miami, Florida: National Hurricane Center. Retrieved August 14, 2018.
- ↑ Lixion Avila (August 10, 2018). "Post-Tropical Cyclone John Discussion Number 20". Miami, Florida: National Hurricane Center. Retrieved August 14, 2018.
- ↑ Alex Sosnowski (August 10, 2018). "Dangerous surf from John to affect Southern California beaches into this weekend". State College, Pennsylvania: AccuWeather. Retrieved August 14, 2018.
- ↑ "NHC Graphical Outlook Archive". www.nhc.noaa.gov. Retrieved 2018-10-06.
- ↑ "Tropical Depression THIRTEEN-E". www.nhc.noaa.gov. Retrieved 2018-10-06.
- ↑ Eric Blake (August 7, 2018). "Tropical Storm Kristy Forecast/Advisory Number 2". Miami, Florida: National Hurricane Center. Retrieved August 14, 2018.
- ↑ Robbie J. Berg (August 10, 2018). "Tropical Storm Kristy Forecast/Advisory Number 13". Miami, Florida: National Hurricane Center. Retrieved August 14, 2018.
- ↑ "Post-Tropical Cyclone KRISTY". www.nhc.noaa.gov. Retrieved 2018-10-06.
- ↑ "NHC Graphical Outlook Archive". www.nhc.noaa.gov. Retrieved 2018-10-07.
- ↑ Stacy R. Stewart (August 14, 2018). Tropical Depression Fourteen-E Discussion Number 1 (Report). Miami, Florida: National Hurricane Center. Retrieved August 22, 2018.
- ↑ Eric S. Blake (August 15, 2018). Tropical Storm Lane Discussion Number 3 (Report). Miami, Florida: National Hurricane Center. Retrieved August 22, 2018.
- ↑ Stacy R. Stewart (August 16, 2018). Hurricane Lane Discussion Number 9 (Report). Miami, Florida: National Hurricane Center. Retrieved August 22, 2018.
- ↑ Stacy R. Stewart (August 18, 2018). Hurricane Lane Discussion Number 15 (Report). Miami, Florida: National Hurricane Center. Retrieved August 22, 2018.
- ↑ Sam Houston (August 19, 2018). Hurricane Lane Discussion Number 19 (Report). Honolulu, Hawaii: Central Pacific Hurricane Center. Retrieved August 22, 2018.
- ↑ Richard Ballard (August 20, 2018). Hurricane Lane Discussion Number 24 (Report). Honolulu, Hawaii: Central Pacific Hurricane Center. Retrieved August 22, 2018.
- ↑ Richard Ballard (August 22, 2018). Hurricane Lane Special Advisory Number 30 (Report). Honolulu, Hawaii: Central Pacific Hurricane Center. Retrieved August 22, 2018.
- ↑ Wendy Osher (22 August 2018). "Lane Intensifies to Dangerous Category 5 Hurricane, 160 mph Winds". Maui Now. Retrieved 22 August 2018.
- ↑ "Lane strengthens to Category 5 hurricane, Big Island under hurricane warning". Hawaii News Now. 22 August 2018. Retrieved 22 August 2018.
- ↑ Powell (August 22, 2018). "Hurricane Lane Discussion 32". prh.noaa.gov. Archived from the original on September 1, 2018.
- ↑ Ballard (August 24, 2018). "Tropical Storm Discussion Number 43". prh.noaa.gov. Archived from the original on August 24, 2018. Retrieved September 1, 2018.
- ↑ Burke (August 26, 2018). "Tropical Storm Lane Discussion Number 47". prh.noaa.gov. Archived from the original on August 26, 2018. Retrieved September 1, 2018.
- ↑ Birchard (August 26, 2018). "Tropical Depression Lane Discussion Number 49". prh.noaa.gov. Archived from the original on August 26, 2018. Retrieved September 1, 2018.
- ↑ Birchard (August 27, 2018). "Tropical Storm Lane Discussion Number 53". prh.noaa.gov. Archived from the original on August 27, 2018. Retrieved September 1, 2018.
- ↑ Donaldson (August 28, 2018). "Tropical Depression Lane Discussion Number 55". prh.noaa.gov. Archived from the original on August 28, 2018. Retrieved September 1, 2018.
- ↑ Donaldson (August 29, 2018). "Post-Tropical Cyclone Lane Discussion Number 59". prh.noaa.gov. Archived from the original on August 29, 2018. Retrieved September 1, 2018.
- ↑ "NHC Graphical Outlook Archive". www.nhc.noaa.gov. Retrieved 2018-09-01.
- ↑ "NHC Graphical Outlook Archive". www.nhc.noaa.gov. Retrieved 2018-09-01.
- ↑ "NHC Graphical Outlook Archive". www.nhc.noaa.gov. Retrieved 2018-09-01.
- ↑ "NHC Graphical Outlook Archive". www.nhc.noaa.gov. Retrieved 2018-09-01.
- ↑ "NHC Graphical Outlook Archive". www.nhc.noaa.gov. Retrieved 2018-09-01.
- ↑ Service, US Department of Commerce, NOAA, National Weather. "Central Pacific Hurricane Center - Honolulu, Hawai`i". www.prh.noaa.gov. Retrieved 2018-09-01.
- ↑ Wroe (August 31, 2018). "Hurricane Miriam Discussion Number 24". prh.noaa.gov. Archived from the original on August 31, 2018. Retrieved September 1, 2018.
- ↑ Service, US Department of Commerce, NOAA, National Weather. "Central Pacific Hurricane Center - Honolulu, Hawai`i". www.prh.noaa.gov. Retrieved 2018-09-01.
- ↑ Stewart, Stacy. NHC Graphical Outlook Archive. National Hurricane Center (Report). National Oceanic and Atmospheric Administration. Retrieved 3 September 2018.
- ↑ Stewart, Stacy. NHC Graphical Outlook Archive. National Hurricane Center (Report). National Oceanic and Atmospheric Administration. Retrieved 3 September 2018.
- ↑ Avila, Lixion. Tropical Depression Sixteen-E Advisory Number 1. National Hurricane Center (Report). National Oceanic and Atmospheric Administration. Retrieved 3 September 2018.
- ↑ Berg, Robbie. Hurricane Norman Discussion Number 8. National Hurricane Center (Report). National Oceanic and Atmospheric Administration. Retrieved 3 September 2018.
- ↑ Pasch, Richard. Tropical Storm Norman Advisory Number 3. National Hurricane Center (Report). National Oceanic and Atmospheric Administration. Retrieved 3 September 2018.
- ↑ Avila, Lixion. Hurricane Norman Advisory Number 6. National Hurricane Center (Report). National Oceanic and Atmospheric Administration. Retrieved 3 September 2018.
- ↑ Berg, Robbie. Hurricane Norman Advisory Number 8. National Hurricane Center (Report). National Oceanic and Atmospheric Administration. Retrieved 3 September 2018.
- ↑ Brown, Daniel. Hurricane Norman Special Advisory Number 9. National Hurricane Center (Report). National Oceanic and Atmospheric Administration. Retrieved 3 September 2018.
- ↑ Brown, Daniel. Hurricane Norman Advisory Number 10. National Hurricane Center (Report). National Oceanic and Atmospheric Administration. Retrieved 4 September 2018.
- ↑ Brown, Daniel. Hurricane Norman Discussion Number 10. National Hurricane Center (Report). National Oceanic and Atmospheric Administration. Retrieved 4 September 2018.
- ↑ Cangialosi, John. Hurricane Norman Discussion Number 12. National Hurricane Center (Report). National Oceanic and Atmospheric Administration. Retrieved 4 September 2018.
- ↑ Roberts, Dave. Hurricane Norman Discussion Number 14. National Hurricane Center (Report). National Oceanic and Atmospheric Administration. Retrieved 4 September 2018.
- ↑ Roberts, Dave. Hurricane Norman Discussion Number 15. National Hurricane Center (Report). National Oceanic and Atmospheric Administration. Retrieved 4 September 2018.
- ↑ Stewart, Stacy. Hurricane Norman Advisory Number 18. National Hurricane Center (Report). National Oceanic and Atmospheric Administration. Retrieved 4 September 2018.
- ↑ Avila, Lixion. Hurricane Norman Advisory Number 22. National Hurricane Center (Report). National Oceanic and Atmospheric Administration. Retrieved 4 September 2018.
- ↑ Blake, Eric. Hurricane Norman Discussion Number 26. National Hurricane Center (Report). National Oceanic and Atmospheric Administration. Retrieved 4 September 2018.
- ↑ Blake, Eric. Hurricane Norman Advisory Number 26. National Hurricane Center (Report). National Oceanic and Atmospheric Administration. Retrieved 4 September 2018.
- ↑ Cangialosi, John. Hurricane Norman Advisory Number 28. National Hurricane Center (Report). National Oceanic and Atmospheric Administration. Retrieved 4 September 2018.
- ↑ Houston, Sam. Hurricane Norman Advisory Number 34. Central Pacific Hurricane Center (Report). National Oceanic and Atmospheric Administration. Retrieved 5 September 2018.
- ↑ Birchard, Tom. Tropical Storm Norman Advisory Number 47. National Hurricane Center (Report). National Oceanic and Atmospheric Administration. Retrieved 8 September 2018.
- ↑ Brown, Daniel. NHC Graphical Outlook Archive. National Hurricane Center (Report). National Oceanic and Atmospheric Administration. Retrieved 7 September 2018.
- ↑ Roberts, Dave. NHC Graphical Outlook Archive. National Hurricane Center (Report). National Oceanic and Atmospheric Administration. Retrieved 7 September 2018.
- ↑ Cangialosi, John. Tropical Depression Seventeen-E Advisory Number 1. National Hurricane Center (Report). National Oceanic and Atmospheric Administration. Retrieved 7 September 2018.
- ↑ Pasch, Richard. Tropical Storm Olivia Advisory Number 6. National Hurricane Center (Report). National Oceanic and Atmospheric Administration. Retrieved 7 September 2018.
- ↑ Pasch, Richard. Tropical Storm Olivia Discussion Number 6. National Hurricane Center (Report). National Oceanic and Atmospheric Administration. Retrieved 7 September 2018.
- ↑ Roberts, Dave. Tropical Storm Olivia Advisory Number 10. National Hurricane Center (Report). National Oceanic and Atmospheric Administration. Retrieved 7 September 2018.
- ↑ Blake, Eric. Tropical Storm Olivia Advisory Number 11. National Hurricane Center (Report). National Oceanic and Atmospheric Administration. Retrieved 7 September 2018.
- ↑ Blake, Eric. Hurricane Olivia Advisory Number 13. National Hurricane Center (Report). National Oceanic and Atmospheric Administration. Retrieved 7 September 2018.
- ↑ Beven, Jack. Hurricane Olivia Advisory Number 15. National Hurricane Center (Report). National Oceanic and Atmospheric Administration. Retrieved 7 September 2018.
- ↑ Beven, Jack. Hurricane Olivia Advisory Number 16. National Hurricane Center (Report). National Oceanic and Atmospheric Administration. Retrieved 7 September 2018.
- ↑ Blake, Eric. Hurricane Olivia Advisory Number 17. National Hurricane Center (Report). National Oceanic and Atmospheric Administration. Retrieved 7 September 2018.
- ↑ Jack Beven (September 5, 2018). "Hurricane Olivia Advisory Number 19". Miami, Florida: National Hurricane Center. Retrieved September 5, 2018.
- ↑ Lixion A. Avila (September 6, 2018). "Hurricane Olivia Advisory Number 26". Miami, Florida: National Hurricane Center. Retrieved September 6, 2018.
- ↑ Eric S. Blake (September 8, 2018). "Hurricane Olivia Advisory Number 33". Miami, Florida: National Hurricane Center. Retrieved September 8, 2018.
- ↑ Ballard R. (September 9, 2018). Hurricane Olivia Advisory Number 38 (Report). Honolulu, Hawaii: Central Pacific Hurricane Center. Retrieved September 9, 2018.
- ↑ Forecaster Wroe (September 12, 2018). Hurricane Olivia Advisory Number 49 (Report). Honolulu, Hawaii: Central Pacific Hurricane Center. Retrieved September 12, 2018.
- ↑ Sam Houston (September 12, 2018). Hurricane Olivia Advisory Number 51 (Report). Honolulu, Hawaii: Central Pacific Hurricane Center. Retrieved September 13, 2018.
- ↑ Eric S. Blake (September 4, 2018). "NHC Graphical Tropical Weather Outlook Archive". Miami, Florida: National Hurricane Center. Retrieved September 12, 2018.
- ↑ Eric S. Blake (September 8, 2018). "Tropical Depression Eighteen-E Discussion Number 1". Miami, Florida: National Hurricane Center. Retrieved September 12, 2018.
- ↑ John P. Cangialosi (September 9, 2018). "Tropical Storm Paul Advisory Number 4". Miami, Florida: National Hurricane Center. Retrieved September 12, 2018.
- ↑ John P. Cangialosi (September 11, 2018). "Tropical Storm Paul Advisory Number 11". Miami, Florida: National Hurricane Center. Retrieved September 12, 2018.
- ↑ David Zelinsky (September 12, 2018). "Post-Tropical Cyclone Paul Advisory Number 16". Miami, Florida: National Hurricane Center.
- ↑ "NHC Graphical Outlook Archive". www.nhc.noaa.gov. Retrieved 2018-09-19.
- ↑ "NHC Graphical Outlook Archive". www.nhc.noaa.gov. Retrieved 2018-09-19.
- ↑ "NHC Graphical Outlook Archive". www.nhc.noaa.gov. Retrieved 2018-09-19.
- ↑ "Tropical Depression NINETEEN-E". www.nhc.noaa.gov. Retrieved 2018-09-19.
- ↑ "earth :: a global map of wind, weather, and ocean conditions". earth.nullschool.net. Retrieved 2018-09-20.
- ↑ "Remnants of NINETEEN-E". www.nhc.noaa.gov. Retrieved 2018-09-20.
- ↑ "NHC Graphical Outlook Archive". www.nhc.noaa.gov. Retrieved 2018-09-19.
- ↑ "NHC Graphical Outlook Archive". www.nhc.noaa.gov. Retrieved 2018-09-22.
- ↑ "NHC Graphical Outlook Archive". www.nhc.noaa.gov. Retrieved 2018-09-24.
- ↑ "NHC Graphical Outlook Archive". www.nhc.noaa.gov. Retrieved 2018-09-25.
- ↑ Dave Roberts (September 26, 2018). "Hurricane Rosa Advisory Number 6". Miami, Florida: National Hurricane Center. Retrieved September 26, 2018.
- ↑ Eric Blake (September 27, 2018). "Hurricane Rosa Advisory Number 12". Miami, Florida: National Hurricane Center. Retrieved September 27, 2018.
- ↑ "Hurricane ROSA". www.nhc.noaa.gov. Retrieved 2018-10-01.
- ↑ "Hurricane ROSA". www.nhc.noaa.gov. Retrieved 2018-10-01.
- ↑ "Hurricane ROSA". www.nhc.noaa.gov. Retrieved 2018-10-01.
- ↑ "Hurricane ROSA". www.nhc.noaa.gov. Retrieved 2018-10-01.
- ↑ "Tropical Storm ROSA". www.nhc.noaa.gov. Retrieved 2018-10-01.
- ↑ "Remnants of ROSA". www.nhc.noaa.gov. Retrieved 2018-10-02.
- ↑ David Zelinsky (September 25, 2018). Miami, Florida: National Hurricane Center Graphical Tropical Weather Outlook - 5:00 PM PDT, Tue Sept 25 2018 https://www.nhc.noaa.gov/archive/xgtwo/gtwo_archive.php?current_issuance=201809260240&basin=epac&fdays=Five-Day Graphical Tropical Weather Outlook - 5:00 PM PDT, Tue Sept 25 2018 Check
|url=value (help). Retrieved October 7, 2018. Missing or empty|title=(help) - ↑ Dave Roberts (September 26, 2018). "Two-Day Graphical Tropical Weather Outlook - 5:00 AM PDT, Wed Sept 26 2018". Miami, Florida: National Hurricane Center. Retrieved October 7, 2018.
- ↑ "Tropical Storm SERGIO". www.nhc.noaa.gov. Retrieved 2018-10-01.
- ↑ "Tropical Storm SERGIO". www.nhc.noaa.gov. Retrieved 2018-10-01.
- ↑ "Hurricane SERGIO". www.nhc.noaa.gov. Retrieved 2018-10-02.
- ↑ "Hurricane SERGIO". www.nhc.noaa.gov. 2018-10-02. Retrieved 2018-10-02.
- ↑ "Hurricane SERGIO". www.nhc.noaa.gov. Retrieved 2018-10-04.
- ↑ Robbie Berg (October 4, 2018). "Hurricane Sergio Public Advisory Number 20". Miami, Florida: National Hurricane Center. Retrieved October 7, 2018.
- ↑ Michael Brennan (October 5, 2018). "Hurricane Sergio Public Advisory Number 23". National Hurricane Center. Retrieved October 7, 2018.
- ↑ Stacy R. Stewart (October 6, 2018). "Hurricane Sergio Discussion Number 27". Miami, Florida: National Hurricane Center. Retrieved October 7, 2018.
- ↑ David Zelinsky (October 7, 2018). "Hurricane Sergio Discussion Number 33". Miami, Florida: National Hurricane Center. Retrieved October 7, 2018.
- ↑ "Tropical Storm Sergio Forecast Discussion". www.nhc.noaa.gov. Retrieved 2018-10-09.
- ↑ "Tropical Storm Walaka Advisory #1". NHC. 2018-09-29. Retrieved 2018-09-30.
- ↑ "Hurricane Walaka Advisory #6". NHC. 2018-09-30. Retrieved 2018-09-30.
- ↑ "Hurricane Walaka Advisory #7". NHC. 2018-10-01. Retrieved 2018-10-01.
- ↑ Kevin Kodama (October 1, 2018). "Hurricane Walaka Intermediate Advisory 9A". Honolulu, Hawaii: Central Pacific Hurricane Center. Retrieved October 1, 2018.
- ↑ "Hurricane Walaka Advisory #12". CPHC. 2018-10-02. Retrieved 2018-10-02.
- ↑ "Hurricane Walaka Advisory #18". CPHC. 2018-10-03. Retrieved 2018-10-03.
- ↑ "Hurricane Walaka Advisory #19". CPHC. 2018-10-04. Retrieved 2018-10-04.
- ↑ Sam Houston (October 6, 2018). "Post-Tropical Cyclone Walaka Discussion Number 28". Honolulu, Hawaii: Central Pacific Hurricane Center. Retrieved October 7, 2018.
- 1 2 National Weather Service Office in Honolulu, Hawaii [@NWSHonolulu] (August 31, 2018). "Thanks for pointing this out. The circulation that was associated with Lane dissipated several days ago and was absorbed by the same upper level low responsible for this feature. This feature is now a sub-tropical gale low, but we will continue to keep an eye on it!" (Tweet). Retrieved September 2, 2018 – via Twitter.
- 1 2 3 "2018 Tropical Bulletin Archive". NOAA. Retrieved 3 September 2018.
- ↑ Bob Henson [@bhensonweather] (September 2, 2018). ""Son of Lane" (if you will) is sitting over a distinct SST anomaly of around 2°C" (Tweet). Retrieved September 2, 2018 – via Twitter.
- ↑ "Tropical Cyclone Names". National Hurricane Center. National Oceanic and Atmospheric Administration. 2013-04-11. Archived from the original on 2013-05-08. Retrieved May 8, 2013.
- ↑ "Pacific Tropical Cyclone Names 2016-2021". Central Pacific Hurricane Center. National Oceanic and Atmospheric Administration. May 12, 2016. Archived from the original (PHP) on December 30, 2016.
External links
| Wikimedia Commons has media related to 2018 Pacific hurricane season. |
- National Hurricane Center
- National Hurricane Center's Eastern Pacific Tropical Weather Outlook
- Servicio Meteorológico Nacional Website (in Spanish)
- Joint Typhoon Warning Center
- Tropical Storm Risk (TSR)'s website
Tropical cyclones of the 2018 Pacific hurricane season | ||
|---|---|---|
| ||
| ||