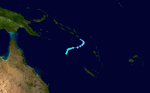
2017–18 Australian region cyclone season
| 2017–18 Australian region cyclone season | |
|---|---|
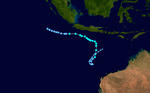
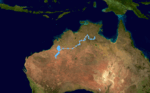
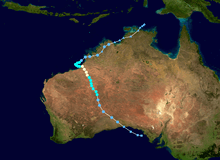
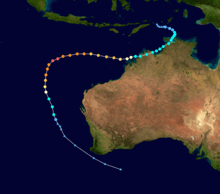
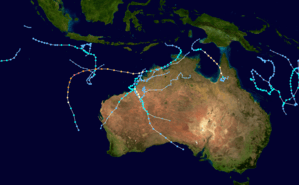 Season summary map | |
| Seasonal boundaries | |
| First system formed | 8 August 2017 |
| Last system dissipated | 28 April 2018 |
| Strongest storm | |
| Name | Marcus |
| • Maximum winds |
230 km/h (145 mph) (10-minute sustained) |
| • Lowest pressure | 912 hPa (mbar) |
| Seasonal statistics | |
| Tropical lows | 23 |
| Tropical cyclones | 11 |
| Severe tropical cyclones | 2 |
| Total fatalities | 41 total |
| Total damage | $165 million (2017 USD) |
| Related articles | |
The 2017–18 Australian region cyclone season was just below average period of tropical cyclone formation in the Southern Indian Ocean and Pacific Oceans, between 90°E and 160°E, with 9 named storms, which 2 intensified into severe tropical cyclones. Another two tropical cyclones, Cempaka (Indonesian region north of 10°S) and Flamboyan (Indonesian and La Reunion's area of responsibility) occurred outside the Australian region but are included in the descriptions below. The season officially began 1 November 2017 and ended on 30 April 2018; however, tropical cyclones can form at any time of the year, as demonstrated by the first tropical low of the season in early August. Any tropical system that forms between 1 July 2017 and 30 June 2018 will count towards the season total. During the season, tropical cyclones will be officially monitored by one of the five tropical cyclone warning centres (TCWCs) that operate in this region. Three of the five centres are operated by the Australian Bureau of Meteorology (BOM) in Perth, Darwin and Brisbane, while the other two are operated by the National Weather Service of Papua New Guinea in Port Moresby and the Indonesian Agency for Meteorology, Climatology and Geophysics in Jakarta. The Joint Typhoon Warning Center (JTWC) of the United States and other national meteorological services, including Météo-France at Réunion, also monitored the basin during the season.
Seasonal summary
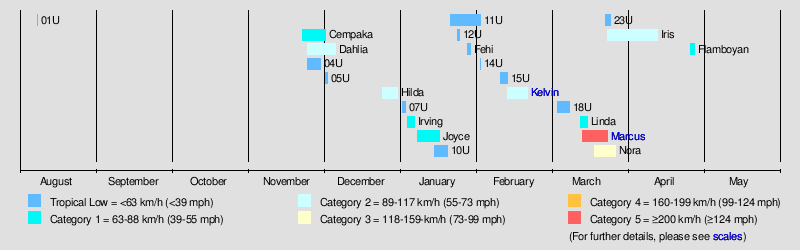
Systems
Tropical Cyclone Cempaka
  | |
| Duration | 22 November – 1 December |
|---|---|
| Peak intensity | 95 km/h (60 mph) (10-min) 990 hPa (mbar) |
Cempaka occurred outside the Australian region, being located north of 10S in Indonesia's area of responsibility. On 22 November, TCWC Perth and TCWC Jakarta started to monitor a weak tropical low that had developed about 332 km (206 mi) south of the city of Surabaya.[1] By 06:00 UTC of 26 November, TCWC Jakarta began issuing advisories and was classified as a tropical depression.[2] The JTWC, however, issued a Tropical Cyclone Formation Alert early on 27 November, stating that satellite imagery depicted flaring convection near its center.[3] Several hours later, TCWC Jakarta upgraded the system to a tropical cyclone, giving the name Cempaka.[4] Winds from the cyclone also blew ash from nearby Mount Agung on Bali westwards to its popular beaches and far eastern Java.[5] On 30 November, Cempaka rapidly weakened into a tropical low, while turning to the southwest.[6] TCWC Perth last mentioned Cempaka on 1 December. Cempaka was described as a category 1 cyclone during operations but was upgraded to category 2 upon reanalysis, based upon microwave signature and doppler radar observations.[7]
Although Cempaka never made landfall, the rainfall from the storm caused severe flooding and landslides across the southern half of Java and Bali, killing at least 41 people and destroying many homes and businesses.[8]
Tropical Cyclone Dahlia
| Category 2 tropical cyclone (Australian scale) | |
| Tropical storm (SSHWS) | |
  | |
| Duration | 24 November – 5 December |
|---|---|
| Peak intensity | 95 km/h (60 mph) (10-min) 985 hPa (mbar) |
Tropical Low 03U was first noted as a tropical depression by TCWC Jakarta on 24 November, while it was located about 1,500 km (930 mi) to the west of Jakarta, Indonesia.[9] By 29 November, TCWC Jakarta upgraded the system to a tropical cyclone, receiving the name Dahlia, making it the first time where at least two cyclones were formed and named by TCWC Jakarta in a single season.[10] The JTWC followed suit the next day, designating the system as 01S.[11] By 1 December, Dahlia intensified into a Category 2 tropical cyclone,[12] and reached its peak intensity six hours later with a minimum barometric pressure of 985 hPa.[13] Dahlia maintained its intensity for several hours until the storm moved southeastwards and began to weaken.[14] The BoM later issued its final bulletin on Dahlia early on 4 December.[15] TCWC Perth last monitored on Dahlia on 5 December.[16]
Tropical Cyclone Hilda
| Category 2 tropical cyclone (Australian scale) | |
| Tropical storm (SSHWS) | |
  | |
| Duration | 26 December – 30 December |
|---|---|
| Peak intensity | 95 km/h (60 mph) (10-min) 980 hPa (mbar) |
During 26 December, the BoM reported that a tropical low had developed just off the Kimberley coast, about 330 km (205 mi) to the north of Derby.[17] The system subsequently moved south-southwest parallel to the coast, as it developed further before it moved overland to the southwest of Cape Leveque.[17] The system was subsequently classified as a Category 1 tropical cyclone and named Hilda by the BoM, while it was located inland near Broome based on reports of persistent gale-force winds from Broome Airport.[17] After moving back over water, the system was classified as a Category 2 tropical cyclone with 10-minute peak windspeeds of 95 km/h (60 mph).[17] Hilda made landfall close to Anna Plains on 28 December, as a Category 2 tropical cyclone. Wind and flooding damage was reported along the coast in Broome.
Tropical Cyclone Irving
| Category 1 tropical cyclone (Australian scale) | |
| Tropical storm (SSHWS) | |
  | |
| Duration | 3 January – 6 January (Exited basin) |
|---|---|
| Peak intensity | 75 km/h (45 mph) (10-min) 993 hPa (mbar) |
On 3 January, a tropical low had developed to the southwest of Sumatra.[18] On 06:00 UTC of 5 January, TCWC Perth began issuing advisories on the system, using the identifier 08U.[19] TCWC Perth had recorded winds of 75 km/h (45 mph), despite the fact that the system did not have the structure of a tropical cyclone.[19] By the next day, 08U then strengthened into a Category 1 tropical cyclone, with the storm receiving the name Irving, the fourth named storm of the season.[20] Three hours later, the JTWC followed suit and gave the system the designation 04S.[21] TCWC Perth, however, discontinued advisories after Irving exited the basin on 12:00 UTC the same day.[22]
Tropical Cyclone Joyce
| Category 1 tropical cyclone (Australian scale) | |
| Tropical storm (SSHWS) | |
  | |
| Duration | 7 January – 16 January |
|---|---|
| Peak intensity | 85 km/h (50 mph) (10-min) 978 hPa (mbar) |
Joyce made landfall in the Pilbara Coast on 12 January. The remnants of Cyclone Joyce bought heavy rain to the Perth Metro Area on January 15; a total of 96 mm (3.77 in) of rain in 24 hours fell in Perth, while Rottnest Island recorded the highest amount of rain in the metro, which was a total of 142mm (5.59 in).[23]
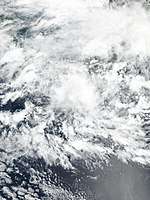
Tropical Low 11U
| Tropical low (Australian scale) | |
  | |
| Duration | 20 January – 1 February |
|---|---|
| Peak intensity | 75 km/h (45 mph) (10-min) 985 hPa (mbar) |
The slow-moving system brought copious rains to a broad swath of coastal Australia. In Kimberley, Western Australia, near-record rainfall accumulations of 639 mm (25.2 in) in four days caused extensive flooding. In a 24-hour span, 439 mm (17.3 in) of rain fell across Broome, Western Australia, with flood waters in some areas reaching depths of 1.2 to 1.5 m (4 to 5 ft). Portions of the Great Northern Highway and Cape Leveque road were closed. Coastal areas experienced powerful winds reaching 100 km/h (65 mph) with gusts to 125 km/h (78 mph); these winds downed many trees and power lines. The effects of the low were considered substantially worse than Hilda and Joyce, tropical cyclones that affected the same region earlier in the season.[24]
Tropical Cyclone Kelvin
| Category 2 tropical cyclone (Australian scale) | |
| Category 1 tropical cyclone (SSHWS) | |
  | |
| Duration | 12 February – 20 February |
|---|---|
| Peak intensity | 110 km/h (70 mph) (10-min) 974 hPa (mbar) |
A tropical low formed off the NT's Top End coast on 12 February and tracked to the southwest eventually moving off the West Kimberley coast 16 February and being named Kelvin the following day. It abrubtly made a turn to the southeast and crossed the coast south of Broome where it caused localised damage at Nita Downs and Anna Plains stations Felling trees, stripping branches of leaves and damaging buildings. During operations it was categorised as a Category 2 tropical cyclone (Australian Scale), but was upgraded to category 3 intensity during the reanalysis process. Kelvin was unusual in that the satellite appearance improved in the hours following landfall, forming an eye, and hence the weakening only commenced 12 hours after being over land. Kelvin was downgraded below cyclone intensity on 19 February and dissipated the following day. Tropical Cyclone Kelvin brought widespread heavy rainfall to the Kimberley region which had already been saturated by other tropical cyclone systems. As a result, significant flooding occurred in parts of the Kimberley, including in the towns of Broome and Bidyadanga. Property damage was sustained at Broome and Anna Plains Station, where the cyclone made landfall, as well as infrastructural damage to the Great Northern Highway as a result of the heavy rainfall and flooding.
Tropical Cyclone Linda
| Category 1 tropical cyclone (Australian scale) | |
| Tropical storm (SSHWS) | |
  | |
| Duration | 11 March – 16 March |
|---|---|
| Peak intensity | 75 km/h (45 mph) (10-min) 993 hPa (mbar) |
On 11 March, the Fiji Meteorological Service reported that Tropical Disturbance 10F had developed about 85 km (55 mi) to the southwest of Rennell and Bellona Province of the Solomon Islands.[25] The system was poorly organised, with atmospheric convection displaced to the east of the low-level circulation centre. On the morning of 12 March, following some mild strengthening, the JTWC upgraded the disturbance to a tropical depression,[26] and the Bureau of Meteorology assigned the system the tropical low designation 21U.[27] Late the same day, the JTWC assessed the system to be producing gale-force winds, and upgraded it to tropical storm status on the Saffir-Simpson scale.[26] The storm moved generally southwards and entered the Australian region at 10:00 AEST on 13 March.[28] Despite being exposed to generally unfavourable atmospheric conditions for tropical cyclone development, the tropical low strengthened into a category 1 tropical cyclone on the Australian scale six hours later.[28] The storm was named 'Linda', and was the first tropical cyclone in the Eastern Region for the 2017-18 season.[28] Tropical Cyclone Linda attained its peak intensity at 22:00 AEST 13 March, with 75 km/h (45 mph) ten-minute sustained winds, 95 km/h (60 mph) one-minute sustained winds, and a minimum atmospheric pressure of 993 hPa (29.32 inHg).[26][28]
A few hours later, the storm assumed a more southwesterly course towards the southern Queensland coast.[28] As a result of the further deteriorating atmospheric conditions and cooling sea surface temperatures due to movement away from warm equatorial waters, Linda weakened to a subtropical low during mid-morning on 14 March, having spent fewer than 24 hours as a cyclone.[28] The JTWC proceeded to downgrade the system below tropical storm intensity at 04:00 AEST on 25 March.[26] The remnant low transitioned to a south-southeasterly track and continued to decay while travelling roughly parallel to the coastline, finally dissipating on 16 March.[28]
Ex-Tropical Cyclone Linda passed within about 300 km (185 mi) of Fraser Island at its closest approach to Australia, and produced large waves and swell which were experienced on exposed southern Queensland beaches.[28] Due to the dangerous surf conditions, many beaches south of Fraser Island were closed on 14 and 15 March for the safety of the public.[28] Areas off parts of the Sunshine Coast experienced waves of up to 8 metres (26 feet), and 1 metre (3 feet) of beach erosion occurred at the Gold Coast.[29] Sustained gale-force winds were recorded on the Australian mainland at Double Island Point on 14 March, with gusts up to 85 km/h (55 mph).[30]
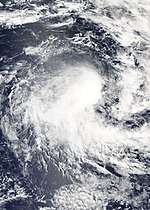
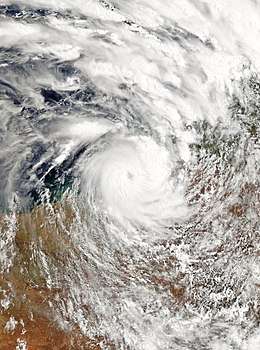
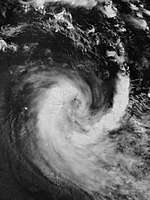
Severe Tropical Cyclone Marcus
| Category 5 severe tropical cyclone (Australian scale) | |
| Category 5 tropical cyclone (SSHWS) | |
  | |
| Duration | 14 March – 24 March |
|---|---|
| Peak intensity | 230 km/h (145 mph) (10-min) 912 hPa (mbar) |
On 14 March, the Australian Bureau of Meteorology issued cyclone warnings for Darwin, the Tiwi Islands and parts of the northwest Top End.
Marcus formed north of the Tiwi Islands as a Category 1 tropical cyclone on the Australian scale, and was upgraded to Category 2 in the hours before it hit the Northern Territory coastline on 17 March. Major events and flights in and out of Darwin were cancelled. Upon moving away from the coast, Marcus intensified markedly, and on 21 March, Cyclone Marcus reached Category 5 status on both cyclone scales. From then on, Marcus began a weakening phase, brushing by Western Australia and becoming a remnant low on 24 March.
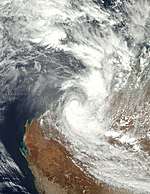
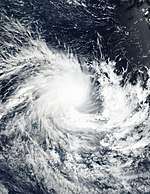
Severe Tropical Cyclone Nora
| Category 3 severe tropical cyclone (Australian scale) | |
| Category 2 tropical cyclone (SSHWS) | |
  | |
| Duration | 19 March – 27 March |
|---|---|
| Peak intensity | 155 km/h (100 mph) (10-min) 958 hPa (mbar) |
On the afternoon of 19 March, the Bureau of Meteorology reported on the development of a weak tropical low in the Torres Strait, north of Thursday Island.[31][32] Two days later, on the afternoon of 21 March, tropical cyclone advice bulletins were initiated as the tropical low began to develop, and a cyclone watch was issued for the far northeastern coastal region of the Top End.[33] At this stage, the system was forecast to coalesce into a tropical cyclone by 4:00 a.m. on 23 March (ACST), and then reach severe tropical cyclone strength by 4:00 p.m. the next day.[34] On the afternoon of 22 March, the Joint Typhoon Warning Center upgraded the strengthening system to a tropical storm.[35] Later on the same day, the Bureau of Meteorology identified that sustained gale-force winds had developed on the northern semicircle of the system;[36] however, the system was still classified as a tropical low as these winds did not extend more than halfway around the circulation centre. On 23 March, the system organized sufficiently into a tropical cyclone, and was named Nora by the BoM. Within the next couple of days, Nora intensified into a Category 3 Severe Tropical Cyclone, before making landfall on the Top End at that intensity. Afterward, Nora gradually began to weaken, degenerating into a tropical low soon afterward. On 26 March, Nora's remnant low stalled, and began to slowly meander counterclockwise over the Top End. On March 27, Nora's remnant moved westward across the Gulf of Carpentaria. On the next day, Nora's remnant made landfall on the Australian coast once again and dissipated.
Tropical Cyclone Iris
| Category 2 tropical cyclone (Australian scale) | |
| Tropical storm (SSHWS) | |
  | |
| Duration | 24 March (Entered basin) – 13 April |
|---|---|
| Peak intensity | 100 km/h (65 mph) (10-min) 987 hPa (mbar) |
Iris entered the responsible area of TCWC Brisbane as a minimal category 1 tropical cyclone shortly before 16:00 AEST (06:00 UTC) on 24 March,[37] and it was quickly downgraded to a tropical low at 21:00 AEST (11:00 UTC).[38] Conversely, the JTWC reported that Iris had developed into a tropical cyclone at around 04:00 AEST on 25 March (18:00 UTC on 24 March), when there were good divergence aloft and a formative poleward outflow channel, although high vertical wind shear kept impacting the system.[39] Tracking generally southwards along the western periphery of a near-equatoral ridge,[40] Iris remained weak with an exposed low-level circulation centre, which resulted in the final warning from the JTWC being issued at 09:00 UTC on 27 March, as colder sea surface temperatures further eroded the fully sheared system.[41] On 28 March, Iris slowed down and started to exhibit subtropical characteristics,[42] although it never reached the Tropic of Capricorn throughout its lifetime. The subtropical low began to drift northwestwards parallel to the coast of Queensland on 29 March.[43] The JTWC issued a Tropical Cyclone Formation Alert for Iris again on 1 April, due to the increasing amounts of persistent convection and improving low-level banding. These factors indicated that Iris had transitioned back to a tropical low on the same day, as it turned towards the south-southeast.[44][45]
Both of BOM and the JTWC reported that Iris had redeveloped into a tropical cyclone at around 10:00 AEST (00:00 UTC) on 2 April, supported by the Dvorak technique estimates as well as sustained gales recorded by the automatic weather station at Flinders Reef.[46][47] A half of day later, the station further recorded maximum sustained winds at 58 knots (107 km/h; 67 mph). Thanks to weak vertical wind shear, warm SSTs at 28 °C, and excellent poleward outflow, BOM indicated that Iris had further intensified into a category 2 tropical cyclone at around 04:00 AEST on 3 April (18:00 UTC on 2 April), with estimated 10-minute maximum sustained winds at 100 km/h (65 mph).[48][49] Iris became almost stationary on the same day, due to the competing steering influences from a near-equatorial ridge located to the northeast and a subtropical ridge anchored over Australia.[50] Early on 3 April, Iris resumed its south-southeastward track and turned eastward;[51] at the same time, the low-level circulation centre became partially exposed, with deep convection only persisting over the southern periphery of the storm, showing that the intensification had stopped.[52]
At 04:07 AEST on 4 April (18:07 UTC on 3 April), microwave imagery revealed that Iris briefly had formed a shallow eyewall,[53][54] prompting the JTWC to indicate that Iris reached the peak intensity at 10:00 AEST (00:00 UTC), with the same estimate to BOM's 30 hours earlier.[55] However, BOM downgraded Iris to a category 1 tropical cyclone at 16:00 AEST (06:00 UTC), as the unfavourable environment with moderate northwesterly wind shear, weak upper-level outflow, penetrating dry air, and marginal supportive SSTs at about 26 °C, had begun to impact the sheared system.[56]
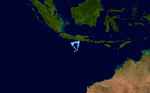
Tropical Cyclone Flamboyan
| Category 1 tropical cyclone (Australian scale) | |
| Tropical storm (SSHWS) | |
  | |
| Duration | 26 April – 28 April (Exited basin) |
|---|---|
| Peak intensity | 65 km/h (40 mph) (10-min) 996 hPa (mbar) |
Flamboyan formed on April 26, before moving into the South-West Indian Ocean basin on April 28. Afterward, the system began intensifying. Flamboyan occurred outside the Australian region, having developed north of 10S in Indonesia's area of responsibility before moving southwest into La Reunion's area of responsibility.
Other systems
On 8 August, TCWC Perth started to monitor a tropical low located approximately 850 km (530 mi) to the west-northwest of the Cocos Islands, on the 90th meridian east—the western edge of the BOM's area of responsibility.[57][58] The tropical low moved in a west-southwesterly direction[57] and attained 35 km/h (25 mph) sustained winds south of the circulation center,[59] and a minimum barometric pressure of 1005 hPa (29.68 inHg).[60] The storm moved out of the Australian region on the same day.[60] On 24 November, TCWC Darwin started to monitor a weak tropical low that had developed in the Banda Sea.[61] The system moved in a slow direction, and attained a minimum pressure of 1005 hPa, until it was last mentioned on 29 November.[62] On 1 December, a tropical low formed to the south of Java.[63] The tropical low rapidly moved southwestward, before dissipating the next day.[64] On 1 January, TCWC Perth began to track a small, weak tropical low to the south of Bali.[65] The system was last mentioned the next day.[66]
On 14 January, a weak tropical low had developed about 750 km (466 mi) to the northwest of Exmouth.[67] The tropical low moved in a general westward direction for several days until it was last monitored by TCWC Perth on 19 January.[68] On 27 January, TCWC Brisbane began monitoring on a tropical low pressure system that was located to the south of the Solomon Islands.[69] The system had a moderate chance of becoming a tropical cyclone although the system had already crossed basins into the South Pacific and became Tropical Depression 06F very early on the next day.[69] The system subsequently became Tropical Cyclone Fehi by 29 January. On 1 February, a weak tropical low had briefly developed in the Coral Sea.[70] On 9 February, a slow-moving tropical low had developed located about 450 km (280 mi) to the northwest of Cooktown, Queensland.[71] The system moved westward and was last noticed three days later.[72] On 4 March, a tropical low persisted to the west of Queensland.[73] In the course of two days, the tropical low emerged towards the waters of the Gulf of Carpentaria. The tropical low rapidly dissipated, however, on 9 March.
A weak tropical low near the Solomon Islands was first identified by the Bureau of Meteorology on 17 March. Over the next couple of days, the tropical low meandered over the Solomon Sea.[74] The system was last noted by the Bureau of Meteorology on the afternoon of 19 March.[31]
Storm names
Bureau of Meteorology
Since the start of the 2008–09 season, there has only been one list from which the Bureau of Meteorology has assigned tropical cyclone names despite the fact that three different warning centres are operated (in Perth, Darwin and Brisbane).[75] These warning centres monitor all tropical cyclones that form within the Australian region, as well as any in the areas of responsibility of either TCWC Jakarta or TCWC Port Moresby. The next 12 names on the naming list are shown below.
| Hilda | Irving | Joyce | Kelvin | Linda | Marcus |
| Nora | Owen (unused) | Penny (unused) | Riley (unused) | Savannah (unused) | Trevor (unused) |
TCWC Jakarta
TCWC Jakarta monitors tropical cyclones from the equator to 11°S and from 90°E to 145°E. Should a tropical depression reach tropical cyclone strength within TCWC Jakarta's area of responsibility then it will be assigned the next name from the following list.[75]
| Cempaka | Dahlia | Flamboyan | Kenanga (unused) | Lili (unused) |
| Mangga (unused) | Seroja (unused) | Teratai (unused) | Anggrek (unused) | Bakung (unused) |
TCWC Port Moresby
Tropical cyclones that develop north of 11°S between 151°E and 160°E are assigned names by the TCWC Port Moresby. Tropical cyclone formation in this area is rare, with no cyclones being named in it since 2007.[76] As names are assigned in a random order, the whole list is shown below.
| Alu (unused) | Buri (unused) | Dodo (unused) | Emau (unused) | Fere (unused) |
| Hibu (unused) | Ila (unused) | Kama (unused) | Lobu (unused) | Maila (unused) |
Season effects
| Name | Dates active | Peak classification |
Sustained wind speeds |
Pressure | Areas affected | Damages (AUD) |
Damages (USD) |
Deaths | Refs |
|---|---|---|---|---|---|---|---|---|---|
| 01U | 8 August | Tropical low | 35 km/h (25 mph) | 1005 hPa (29.68 inHg) | None | None | None | None | |
| Cempaka | 22 November – 1 December | Category 1 tropical cyclone | 65 km/h (40 mph) | 998 hPa (29.47 inHg) | Java | Unknown | Unknown | 41 | [8] |
| Dahlia | 24 November – 5 December | Category 2 tropical cyclone | 95 km/h (60 mph) | 985 hPa (29.09 inHg) | Sumatra, Java | None | None | None | |
| 04U | 24 – 29 November | Tropical low | Not specified | 1005 hPa (29.68 inHg) | Indonesia | None | None | None | |
| 05U | 1 – 2 December | Tropical low | Not specified | Not specified | None | None | None | None | |
| Hilda | 26 – 30 December | Category 2 tropical cyclone | 95 km/h (60 mph) | 980 hPa (28.94 inHg) | Western Australia | Minor | Minor | None | |
| 07U | 1 – 2 January | Tropical low | Not specified | 1006 hPa (29.71 inHg) | None | None | None | None | |
| Irving | 3 – 6 January | Category 1 tropical cyclone | 75 km/h (45 mph) | 993 hPa (29.32 inHg) | None | None | None | None | |
| Joyce | 7 – 16 January | Category 1 tropical cyclone | 85 km/h (50 mph) | 978 hPa (28.88 inHg) | Western Australia | None | None | None | |
| 10U | 14 – 19 January | Tropical low | Not specified | Not specified | Christmas Island | None | None | None | |
| 11U | 20 January – 1 February | Tropical low | 75 km/h (45 mph) | 985 hPa (29.09 inHg) | Top End, Western Australia | None | None | None | |
| 12U | 23 – 24 January | Tropical low | Not specified | Not specified | None | None | None | None | |
| Fehi | 27 – 28 January | Tropical low | Not specified | 990 hPa (29.23 inHg) | Solomon Islands | None | None | None | |
| 14U | 1 February | Tropical low | Not specified | Not specified | None | None | None | None | |
| 15U | 9 – 12 February | Tropical low | Not specified | Not specified | None | None | None | None | |
| Kelvin | 12 – 20 February | Category 2 tropical cyclone | 110 km/h (70 mph) | 974 hPa (28.76 inHg) | Top End, Western Australia, South Australia | $33 million | $25 million | None | [77][78] |
| 18U | 4 – 9 March | Tropical low | Not specified | 1001 hPa (29.56 inHg) | Northern Territory | $53 million | $40 million | None | [78] |
| Linda | 13 – 16 March | Category 1 tropical cyclone | 75 km/h (45 mph) | 993 hPa (29.32 inHg) | Solomon Islands, New Caledonia, South East Queensland | None | None | None | |
| Marcus | 14 – 24 March | Category 5 severe tropical cyclone | 230 km/h (145 mph) | 912 hPa (26.93 inHg) | Tanimbar Islands, Top End, Kimberley | $100 million | $75 million | None | [78] |
| Nora | 19 – 27 March | Category 3 severe tropical cyclone | 155 km/h (100 mph) | 958 hPa (28.29 inHg) | Cape York Peninsula, New Guinea, Top End | $33 million | $25 million | None | [78] |
| 23U | 23 – 25 March | Tropical low | Not specified | 1004 hPa (29.65 inHg) | None | None | None | None | |
| Iris | 24 March – 13 April | Category 2 tropical cyclone | 100 km/h (65 mph) | 987 hPa (29.15 inHg) | Solomon Islands, Queensland, Papua New Guinea | None | None | None | |
| Flamboyan | 26 – 28 April | Category 1 tropical cyclone | 65 km/h (40 mph) | 996 hPa (29.41 inHg) | None | None | None | None | |
| Season Aggregates | |||||||||
| 23 systems | 8 August – 28 April | 230 km/h (145 mph) | 912 hPa (26.93 inHg) | $220 million | $165 million | 41 | |||
See also
- Tropical cyclones in 2018
- List of Southern Hemisphere cyclone seasons
- Atlantic hurricane seasons: 2017, 2018
- Pacific hurricane seasons: 2017, 2018
- Pacific typhoon seasons: 2017, 2018
- North Indian Ocean cyclone seasons: 2017, 2018
- 2017–18 South-West Indian Ocean cyclone season
- 2017–18 South Pacific cyclone season
References
- ↑ "Tropical Cyclone Outlook for the Western Region for the period until midnight WST Saturday 25 November 2017". Australian Bureau of Meteorology. 22 November 2017.
- ↑ "BULETIN INFORMASI SIKLON TROPIS Depresi Tropis 95S". Badan Meteorologi Klimatologi Dan Geofisika. 26 November 2017.
- ↑ "{title}". Archived from the original on 27 November 2017. Retrieved 27 November 2017.
- ↑ "BULETIN INFORMASI SIKLON TROPIS Siklon Tropis CEMPAKA". Badan Meteorologi Klimatologi Dan Geofisika. 27 November 2017.
- ↑ "Bali volcano WARNING: Cyclone blowing HAZARDOUS ash across Indonesia". 29 November 2017.
- ↑ "Tropical Cyclone Outlook for the Western Region for the period until midnight WST Sunday 3 December 2017". Australian Bureau of Meteorology. 30 November 2017.
- ↑ "Tropical Cyclone Outlook for the Western Region for the period until midnight WST Monday 4 December 2017". 1 December 2017.
- 1 2 "Indonesia cyclone death toll reaches 41". The Borneo Post/AFP. 7 December 2017. Retrieved 7 December 2017.
- ↑ "{title}". Archived from the original on 29 November 2017. Retrieved 29 November 2017.
- ↑ "Siklon Tropis DAHLIA". Badan Meteorologi Klimatologi Dan Geofisika. 29 November 2017.
- ↑ "Tropical Cyclone 01S (Dahlia) Warning Nr 001". Joint Typhoon Warning Center. 30 November 2017.
- ↑ "Trpical Cyclone Dahlia". Australian Bureau of Meteorology. 1 December 2017.
- ↑ "Tropical Cyclone Dahlia". Australian Bureau of Meteorology. 1 December 2017.
- ↑ "Tropical Cyclone Dahlia". Australian Bureau of Meteorology. 2 December 2017.
- ↑ "Ex-Tropical Cyclone Dahlia". Australian Bureau of Meteorology. 4 December 2017.
- ↑ "Tropical Cyclone Outlook for the Western Region for the period until midnight WST Friday 8 December 2017". Australian Bureau of Meteorology. 5 December 2017.
- 1 2 3 4 Tropical Cyclone Hilda (Report). Australian Bureau of Meteorology. January 2018. Archived from the original on 17 January 2018. Retrieved 17 January 2018.
- ↑ "Tropical Cyclone Outlook for the Western Region for the period until midnight WST Saturday 6 January 2018". Australian Bureau of Meteorology. 3 January 2018.
- 1 2 "Tropical Low 08U". Australian Bureau of Meteorology. 5 January 2018.
- ↑ "Tropical Cyclone Irving". Australian Bureau of Meteorology. 6 January 2018.
- ↑ "Tropical Cyclone 04S (Irving) Warning Nr 001". Joint Typhoon Warning Center. 6 January 2018.
- ↑ "Tropical Cyclone Irving". Australian Bureau of Meteorology. 6 January 2018.
- ↑ http://www.abc.net.au/news/2018-01-16/perth-saturated-as-ex-cyclone-joyce-brings-four-months-of-rain/9332556
- ↑ Emily Jane Smith, Vanessa Mills, Cecile O'Connor, and Oliver Gordon (30 January 2018). "'Worse than a cyclone': Tropical low devastates WA's north". ABC News. Retrieved 1 February 2018.
- ↑ "{title}". Archived from the original on 18 March 2018. Retrieved 18 March 2018.
- 1 2 3 4 "Tropical Cyclone Linda Track File". National Oceanic and Atmospheric Administration.
- ↑ "{title}". Archived from the original on 12 March 2018. Retrieved 12 March 2018.
- 1 2 3 4 5 6 7 8 9 "Tropical Cyclone Linda". Bureau of Meteorology. Retrieved 24 March 2018.
- ↑ Crockford, Toby (2018-03-15). "Ex-tropical cyclone Linda to move away from coast after eight-metre waves erode beaches". Brisbane Times. Retrieved 2018-03-24.
- ↑ "Double Island Point Weather Observations". Bureau of Meteorology. 14 March 2018. Archived from the original on 24 March 2018. Retrieved 24 March 2018.
- 1 2 "Coral Sea Tropical Cyclone Outlook". Bureau of Meteorology. 19 March 2018. Archived from the original on 19 March 2018.
- ↑ "Northern Territory Tropical Cyclone Outlook". Bureau of Meteorology. 19 March 2018. Archived from the original on 19 March 2018.
- ↑ "Tropical Cyclone Advice Number 2 (Nora)". Bureau of Meteorology. 21 March 2018. Archived from the original on 21 March 2018.
- ↑ "Tropical Cyclone Forecast Track Map #2 (Nora)". Bureau of Meteorology. 21 March 2018. Archived from the original on 21 March 2018.
- ↑ "Track File (Nora)". National Oceanic and Atmospheric Administration.
- ↑ "Tropical Cyclone Forecast Track Map #8 (Nora)". Bureau of Meteorology. 22 March 2018. Archived from the original on 23 March 2018.
- ↑ "High Seas Weather Warning for Metarea 10 at 0758 UTC 24 March 2018". Australian Bureau of Meteorology, Tropical Cyclone Warning Centre Brisbane. 24 March 2018. Archived from the original on 25 March 2018. Retrieved 15 April 2018.
- ↑ "High Seas Weather Warning for Metarea 10 at 1303 UTC 24 March 2018". Australian Bureau of Meteorology, Tropical Cyclone Warning Centre Brisbane. 24 March 2018. Archived from the original on 25 March 2018. Retrieved 15 April 2018.
- ↑ "Tropical Cyclone 17P (Seventeen) Warning Nr 001". Joint Typhoon Warning Center. 24 March 2018. Archived from the original on 25 March 2018. Retrieved 15 April 2018.
- ↑ "Tropical Cyclone 17P (Iris) Warning Nr 008". Joint Typhoon Warning Center. 26 March 2018. Archived from the original on 27 March 2018. Retrieved 15 April 2018.
- ↑ "Tropical Cyclone 17P (Iris) Warning Nr 011". Joint Typhoon Warning Center. 27 March 2018. Archived from the original on 27 March 2018. Retrieved 15 April 2018.
- ↑ "Tropical Cyclone Outlook for Coral Sea Issued at 2:30 pm EST on Wednesday 28 March 2018". Australian Bureau of Meteorology. 28 March 2018. Archived from the original on 28 March 2018. Retrieved 15 April 2018.
- ↑ "Tropical Cyclone Outlook for Coral Sea Issued at 2:30 pm EST on Thursday 29 March 2018". Australian Bureau of Meteorology. 29 March 2018. Archived from the original on 29 March 2018. Retrieved 15 April 2018.
- ↑ "Tropical Cyclone Formation Alert". Joint Typhoon Warning Center. 1 April 2018. Archived from the original on 1 April 2018. Retrieved 15 April 2018.
- ↑ "Tropical Cyclone Outlook for Coral Sea Issued at 6:10 am EST on Monday 2 April 2018". Australian Bureau of Meteorology. 1 April 2018. Archived from the original on 2 April 2018. Retrieved 15 April 2018.
- ↑ "Tropical Cyclone Technical Bulletin at: 0232 UTC 02/04/2018". TCWC Brisbane. 2 April 2018. Archived from the original on 2 April 2018. Retrieved 16 April 2018.
- ↑ "Tropical Cyclone 17P (Iris) Warning Nr 012". Joint Typhoon Warning Center. 2 April 2018. Archived from the original on 1 April 2018. Retrieved 16 April 2018.
- ↑ "Tropical Cyclone Technical Bulletin at: 1956 UTC 02/04/2018". TCWC Brisbane. 2 April 2018. Archived from the original on 3 April 2018. Retrieved 16 April 2018.
- ↑ "Tropical Cyclone 17P (Iris) Warning Nr 015". Joint Typhoon Warning Center. 2 April 2018. Archived from the original on 3 April 2018. Retrieved 16 April 2018.
- ↑ "Tropical Cyclone 17P (Iris) Warning Nr 016". Joint Typhoon Warning Center. 3 April 2018. Archived from the original on 3 April 2018. Retrieved 16 April 2018.
- ↑ "Tropical Cyclone Technical Bulletin at: 0136 UTC 03/04/2018". TCWC Brisbane. 3 April 2018. Archived from the original on 3 April 2018. Retrieved 16 April 2018.
- ↑ "Tropical Cyclone Technical Bulletin at: 0718 UTC 03/04/2018". TCWC Brisbane. 3 April 2018. Archived from the original on 3 April 2018. Retrieved 16 April 2018.
- ↑ "Tropical Cyclone 17P (Iris) Warning Nr 019". Joint Typhoon Warning Center. 3 April 2018. Archived from the original on 4 April 2018. Retrieved 16 April 2018.
- ↑ "20180403.1807.f16.x.colorpct_91h_91v.17PIRIS.50kts-985mb-190S-1502E.057pc.jpg" (JPEG). United States Naval Research Laboratory. 3 April 2018. Retrieved 16 April 2018.
- ↑ "Tropical Cyclone 17P (Iris) Warning Nr 020". Joint Typhoon Warning Center. 4 April 2018. Archived from the original on 4 April 2018. Retrieved 16 April 2018.
- ↑ "Tropical Cyclone Technical Bulletin at: 0706 UTC 04/04/2018". TCWC Brisbane. 4 April 2018. Archived from the original on 4 April 2018. Retrieved 16 April 2018.
- 1 2 "WebCite query result". www.webcitation.org. Archived from the original on 2017-08-08. Retrieved 2017-08-08.
- ↑ Meteorology, corporateName=Bureau of. "Tropical Cyclones". www.bom.gov.au. Retrieved 2017-08-08.
- ↑ "Meteo-France Tropical Bulletin (8 August 2017)" (PDF).
- 1 2 "WebCite query result". www.webcitation.org. Archived from the original on 2017-08-08. Retrieved 2017-08-08.
- ↑ "Updated Tropical Cyclone Outlook for the Northern Region, including the Gulf of Carpentaria for the period until midnight CST Monday 27 November 2017". Australian Bureau of Meteorology. 24 November 2017.
- ↑ "Updated Tropical Cyclone Outlook for the Northern Region, including the Gulf of Carpentaria for the period until midnight CST Saturday 2 December 2017". Australian Bureau of Meteorology. 29 November 2017.
- ↑ "Tropical Cyclone Outlook for the Western Region for the period until midnight WST Monday 4 December 2017". Australian Bureau of Meteorology. 1 December 2017.
- ↑ "Tropical Cyclone Outlook for the Western Region for the period until midnight WST Tuesday 5 December 2017". Australian Bureau of Meteorology. 2 December 2017.
- ↑ "Tropical Cyclone Outlook for the Western Region for the period until midnight WST Thursday 4 January 2018". Australian Bureau of Meteorology. 1 January 2018.
- ↑ "Tropical Cyclone Outlook for the Western Region for the period until midnight WST Friday 5 January 2018". Australian Bureau of Meteorology. 2 January 2018.
- ↑ "Tropical Cyclone Outlook for the Western Region for the period until midnight WST Wednesday 17 January 2018". Australian Bureau of Meteorology. 14 January 2018.
- ↑ "Tropical Cyclone Outlook for the Western Region for the period until midnight WST Monday 22 January 2018". Australian Bureau of Meteorology. 19 January 2018.
- 1 2 "Tropical Cyclone Outlook for Coral Sea for the period until midnight EST Tuesday 30 January 2018". Australian Bureau of Meteorology. 27 January 2018.
- ↑ "Tropical Cyclone Outlook for Coral Sea for the period until midnight EST Sunday 4 February 2018". Australian Bureau of Meteorology. 1 February 2018.
- ↑ "Tropical Cyclone Outlook for Coral Sea for the period until midnight EST Monday 12 February 2018". Australian Bureau of Meteorology. 12 February 2018.
- ↑ "Tropical Cyclone Outlook for Coral Sea for the period until midnight EST Thursday 15 February 2018". Australian Bureau of Meteorology. 12 February 2018.
- ↑ "Tropical Cyclone Outlook for the Northern Region, including the Gulf of Carpentaria for the period until midnight CST Wednesday 7 March". Australian Bureau of Meteorology. 4 March 2018.
- ↑ "Analysis Chart Archive". Bureau of Meteorology.
- 1 2 "Tropical Cyclone Operational plan for the South Pacific & Southeast Indian Ocean, 2014 Edition" (PDF). WMO. Retrieved 2016-06-12.
- ↑ Gary Padgett (2008). "Monthly Global Tropical Cyclone Summary October". Australian Severe Weather. Archived from the original on 2013-07-04. Retrieved 2013-07-01.
- ↑ DOLLERY, REBECCA. "Kimberley flooding leaves $16 million road repair bill after two cyclones". ABC news. Retrieved 17 March 2018.
- 1 2 3 4 "Global Catastrophe Recap April 2018" (PDF). thoughtleadership.aonbenfield.com. Aon Benfield. Retrieved 17 May 2018.
External links
| Wikimedia Commons has media related to 2017-18 Australian region cyclone season. |