Castle, Swansea
Castle
| |
|---|---|
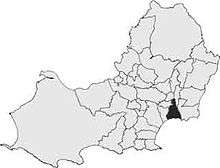
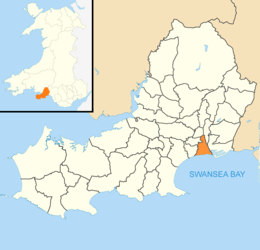 Location of the Castle community within Swansea | |
| Population | 15,883 (2011) |
| OS grid reference | SS6593 |
| Community |
|
| Principal area | |
| Ceremonial county | |
| Country | Wales |
| Sovereign state | United Kingdom |
| Post town | SWANSEA |
| Postcode district | SA1 |
| Dialling code | 01792 |
| Police | South Wales |
| Fire | Mid and West Wales |
| Ambulance | Welsh |
| EU Parliament | Wales |
| UK Parliament | |
| Welsh Assembly | |
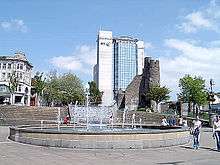
Castle (Welsh: Castell) is an electoral ward and community in the City and County of Swansea, Wales, UK. Castle covers most of the heart of the City of Swansea, with Swansea Castle at its centre.
Description
The electoral ward matches the community boundaries and consists of some or all of the following areas: Swansea city centre, Brynmelin, Dyfatty, Greenhill, Maritime Quarter, parts of Mount Pleasant, Sandfields and Waun Wen in the parliamentary constituency of Swansea West. The ward borders the wards of St. Thomas to the east; Landore and Cwmbwrla to the north; Townhill and Uplands; and Swansea Bay to the south.
For electoral purposes, Castle is divided into a number of polling districts: City Centre, Sandfields, George Street, Mount Pleasant, XE1 High Street, XE2 High Street, North Hill, Baptist Well, XH1 Brynmelin and XH2 Brynmelin. Castle returns 4 councillors to the local council.
The Castle ward is a Communities First area.
The community does not have its own community council.
Demographics
The overall population in the Castle ward and community according to the 2011 UK Census was 15,883. [1]
They had an ethnic breakdown of: [1]
Ethnic breakdown:
| Ethnic group | Count | % |
|---|---|---|
| White British | 11,742 | 73.9 |
| White Irish | 105 | 0.7 |
| White Other | 834 | 5.3 |
| Black/African/Caribbean | 400 | 2.5 |
| Asian | 1,862 | 11.7 |
| Mixed ethnicity | 213 | 1.3 |
| Other (e.g. Arab) | 727 | 4.6 |
The number of people identifying themselves as Welsh was 7,321 (46.1%).
Ward representation
The Castle Ward is a four-member ward for the purposes of City and County of Swansea Council elections. The ward is a major Labour Party stronghold. Following the May 2012 election the ward was represented by four Labour Party councillors:
| Party | Candidate | Votes | % | ± | |
|---|---|---|---|---|---|
| Labour | Erika Theresa Kirchner* | 1,629 | |||
| Labour | Sybil Crouch | 1,623 | |||
| Labour | David Phillips* | 1,610 | |||
| Labour | Fiona Margaret Gordon | 1,582 | |||
| Liberal Democrat | Gareth Peter Jones | 533 | |||
| Liberal Democrat | Alan Jeffery | 531 | |||
| Liberal Democrat | Tanya Auxiliadora May | 511 | |||
| Liberal Democrat | Vicky Lewis | 440 | |||
| Plaid Cymru | Patrick John Powell | 274 | |||
| Plaid Cymru | Gez Couch | 261 | |||
| Plaid Cymru | Harri Llwyd Roberts | 254 | |||
| Green | Steve Clegg | 248 | |||
| Plaid Cymru | Damian Paul Martin | 248 | |||
| Conservative | Paul Raymond Morris | 241 | |||
| Conservative | Stephen Joseph Gallagher | 230 | |||
| Conservative | Sonya Winifred Rachel Morris | 228 | |||
| Conservative | Natasha Rhian Tomaszewski | 207 | |||
| Independent | Phil Crayford | 207 | |||
| Green | Ross Walters | 193 | |||
| TUSC | Martin John White | 148 | |||
| Turnout | 29.0 | +0.7 | |||
| Labour hold | Swing | ||||
| Labour hold | Swing | ||||
| Labour hold | Swing | ||||
| Labour hold | Swing | ||||
Prior to the 2012 election the City and County of Swansea councillors for Castle Ward were:
Councillor Barbara Hynes, who had represented Castle for 21 years, died in September 2011[2] resulting in a byelection.
In the 2008 local elections, there were 21 candidates, each hoping to secure one of four seats. All four sitting Labour councillors were looking to retain their seats. However, the Conservatives, Plaid Cymru and the Liberal Democrats were all fielding four candidates each. The other candidate who was hoping to take a seat represented the Socialist Party.
Ward history
The first election to the new unitary City and County of Swansea Council took place in 1995. All three seats were won by Labour.
| Party | Candidate | Votes | % | ± | |
|---|---|---|---|---|---|
| Labour | Alan Lloyd | 1,756 | |||
| Labour | Barbara Joyce Hynes | 1,723 | |||
| Labour | Dereck John Roberts | 1,623 | |||
| Liberal Democrat | Robert Speht | 592 | |||
| Green | Benjamin David Grigg | 515 | |||
| Liberal Democrat | Cynthia Wharrad | 463 | |||
| Wales Militant Labour | Mark Evans | 378 | |||
| Labour win (new seat) | |||||
| Labour win (new seat) | |||||
| Labour win (new seat) | |||||
In 1999, the number of seats increased from three to four. David Phillips had previously represented the Uplands ward.
| Party | Candidate | Votes | % | ± | |
|---|---|---|---|---|---|
| Labour | Alan Lloyd* | 1,622 | |||
| Labour | Barbara Joyce Hynes* | 1,579 | |||
| Labour | David Phillips | 1,477 | |||
| Labour | Dereck John Roberts* | 1,440 | |||
| Plaid Cymru | Yvonne Marie Davies | 1,111 | |||
| Liberal Democrat | Yvonne Marjorie Holley | 937 | |||
| Green | Benjamin David Grigg | 632 | |||
| Conservative | Paul Raymond Morris | 503 | |||
| Conservative | Sonya Winifred R. Morris | 477 | |||
| United Socialists | David Richard Warren | 273 | |||
| Labour hold | Swing | ||||
| Labour hold | Swing | ||||
| Labour hold | Swing | ||||
| Labour win (new seat) | |||||
* = sitting councillor prior to the election
References
- 1 2 UK Census (2011). "Local Area Report – Castle Parish (1170221819)". Nomis. Office for National Statistics. Retrieved 2018-02-18.
- ↑ "Archived copy". Archived from the original on 2011-10-17. Retrieved 2011-10-25.
