Epsom (UK Parliament constituency)
| Epsom | |
|---|---|
|
Former Borough constituency for the House of Commons | |
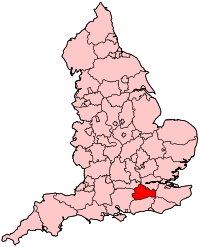 Location of Surrey within England. | |
| County | Surrey |
| Major settlements | Epsom, Ewell and Ashtead |
| 1885–1974 | |
| Number of members | One |
| Replaced by | Epsom and Ewell |
| Created from | East Surrey |
Epsom was a borough constituency represented in the House of Commons of the Parliament of the United Kingdom. It elected one Member of Parliament (MP) by the first past the post system of election. From its creation in 1885 until its abolition in 1974, it was always held by the Conservative Party.
History
The constituency was established for the 1885 general election from part of the East Surrey constituency. It was abolished for the February 1974 general election and largely replaced by the new Epsom and Ewell constituency.
Boundaries
1885–1918: The Sessional Divisions of Epsom and Kingston (comprising most of Elmbridge) as excluding "the part of the civil parish of Kingston [and] the Municipal Borough of Kingston-on-Thames", and the (mainly rural) civil parishes of Effingham and Mickleham to the south-west and south respectively.
1918–1945: The Urban Districts of Epsom, Leatherhead, and Sutton, and the Rural District of Epsom.
1945–1974: The Municipal Borough of Epsom and Ewell, and the Urban District of Leatherhead.
Members of Parliament
| Election | Member[1] | Party | |
|---|---|---|---|
| 1885 | Constituency created. | ||
| 1885 | George Cubitt | Conservative | |
| 1892 | Thomas Bucknill | Conservative | |
| 1899 by-election | William Keswick | Conservative | |
| 1912 by-election | Henry Keswick | Conservative | |
| 1918 | George Blades | Conservative | |
| 1928 by-election | Sir Archibald Southby | Conservative | |
| 1947 by-election | Malcolm McCorquodale | Conservative | |
| 1955 | Peter Rawlinson | Conservative | |
| Feb 1974 | Constituency abolished. See Epsom and Ewell. | ||
Elections
Elections in the 1880s
| Party | Candidate | Votes | % | ± | |
|---|---|---|---|---|---|
| Conservative | George Cubitt | 4,621 | 66.1 | N/A | |
| Liberal | Richard Harris[4] | 2,368 | 33.9 | N/A | |
| Majority | 2,253 | 32.2 | N/A | ||
| Turnout | 6,989 | 77.6 | N/A | ||
| Registered electors | 9,009 | ||||
| Conservative win (new seat) | |||||
| Party | Candidate | Votes | % | ± | |
|---|---|---|---|---|---|
| Conservative | George Cubitt | Unopposed | |||
| Conservative hold | |||||
Elections in the 1890s
| Party | Candidate | Votes | % | ± | |
|---|---|---|---|---|---|
| Conservative | Thomas Bucknill | 5,123 | 65.3 | N/A | |
| Liberal | Thomas Brassey | 2,720 | 34.7 | N/A | |
| Majority | 2,403 | 30.6 | N/A | ||
| Turnout | 7,843 | 75.7 | N/A | ||
| Registered electors | 10,354 | ||||
| Conservative hold | Swing | N/A | |||
| Party | Candidate | Votes | % | ± | |
|---|---|---|---|---|---|
| Conservative | Thomas Bucknill | Unopposed | |||
| Conservative hold | |||||
| Party | Candidate | Votes | % | ± | |
|---|---|---|---|---|---|
| Conservative | William Keswick | Unopposed | |||
| Conservative hold | |||||
Elections in the 1900s
| Party | Candidate | Votes | % | ± | |
|---|---|---|---|---|---|
| Conservative | William Keswick | Unopposed | |||
| Conservative hold | |||||
| Party | Candidate | Votes | % | ± | |
|---|---|---|---|---|---|
| Conservative | William Keswick | 7,313 | 54.0 | N/A | |
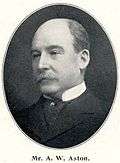
| Liberal | Alfred Withall Aston | 6,221 | 46.0 | N/A | |
| Majority | 1,092 | 8.0 | N/A | ||
| Turnout | 13,534 | 84.9 | N/A | ||
| Registered electors | 15,933 | ||||
| Conservative hold | Swing | N/A | |||
Elections in the 1910s
| Party | Candidate | Votes | % | ± | |
|---|---|---|---|---|---|
| Conservative | William Keswick | 10,919 | 67.6 | +13.6 | |
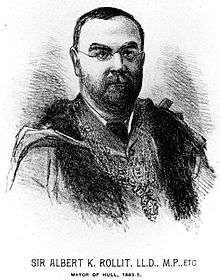
| Liberal | Albert Rollit | 5,232 | 32.4 | −13.6 | |
| Majority | 5,687 | 35.2 | +27.2 | ||
| Turnout | 16,151 | 85.8 | +0.9 | ||
| Registered electors | 18,821 | ||||
| Conservative hold | Swing | +13.6 | |||
| Party | Candidate | Votes | % | ± | |
|---|---|---|---|---|---|
| Conservative | William Keswick | Unopposed | |||
| Conservative hold | |||||
| Party | Candidate | Votes | % | ± | |
|---|---|---|---|---|---|
| Unionist | Henry Keswick | Unopposed | |||
| Unionist hold | |||||
General election 1914/15:
Another general election was required to take place before the end of 1915. The political parties had been making preparations for an election to take place and by the July 1914, the following candidates had been selected;
- Unionist: Henry Keswick
| Party | Candidate | Votes | % | ± | |
|---|---|---|---|---|---|
| C | Unionist | Rowland Blades | 13,556 | 73.9 | N/A |
| Labour | James Chuter Ede | 4,796 | 26.1 | N/A | |
| Majority | 8,760 | 47.8 | N/A | ||
| Turnout | 18,352 | 56.3 | N/A | ||
| Registered electors | 32,590 | ||||
| Unionist hold | Swing | N/A | |||
| C indicates candidate endorsed by the coalition government. | |||||
Elections in the 1920s
| Party | Candidate | Votes | % | ± | |
|---|---|---|---|---|---|
| Unionist | Rowland Blades | 16,249 | 71.2 | −2.7 | |
| Labour | Somerville Hastings | 6,571 | 28.8 | +2.7 | |
| Majority | 9,678 | 42.4 | −5.4 | ||
| Turnout | 22,820 | 65.3 | +9.0 | ||
| Registered electors | 34,945 | ||||
| Unionist hold | Swing | −2.7 | |||
| Party | Candidate | Votes | % | ± | |
|---|---|---|---|---|---|
| Unionist | Rowland Blades | 14,230 | 71.0 | −0.2 | |
| Labour | John Langdon-Davies | 5,807 | 29.0 | +0.2 | |
| Majority | 8,423 | 42.0 | −0.4 | ||
| Turnout | 20,037 | 55.6 | −9.7 | ||
| Registered electors | 36,055 | ||||
| Unionist hold | Swing | −0.2 | |||
| Party | Candidate | Votes | % | ± | |
|---|---|---|---|---|---|
| Unionist | Rowland Blades | 20,017 | 79.5 | +8.5 | |
| Labour | Philip Butler | 5,149 | 20.5 | −8.5 | |
| Majority | 14,868 | 59.0 | +17.0 | ||
| Turnout | 25,166 | 67.1 | +11.5 | ||
| Registered electors | 37,515 | ||||
| Unionist hold | Swing | +8.5 | |||
| Party | Candidate | Votes | % | ± | |
|---|---|---|---|---|---|
| Unionist | Archibald Southby | 13,364 | 60.2 | −19.3 | |
| Liberal | Samuel Parnell Kerr | 5,095 | 23.0 | N/A | |
| Labour | Helen Mary Keynes | 3,719 | 16.8 | −3.7 | |
| Majority | 8,269 | 37.2 | −21.8 | ||
| Turnout | 22,178 | 51.2 | −15.9 | ||
| Registered electors | 43,292 | ||||
| Unionist hold | Swing | −7.8 | |||
| Party | Candidate | Votes | % | ± | |
|---|---|---|---|---|---|
| Unionist | Archibald Southby | 24,720 | 57.8 | −21.7 | |
| Liberal | Samuel Parnell Kerr | 10,422 | 24.3 | N/A | |
| Labour | Stanley Morgan | 7,662 | 17.9 | −2.6 | |
| Majority | 14,298 | 33.5 | −25.5 | ||
| Turnout | 42,804 | 67.7 | +0.6 | ||
| Registered electors | 63,268 | ||||
| Unionist hold | Swing | −9.6 | |||
Elections in the 1930s
| Party | Candidate | Votes | % | ± | |
|---|---|---|---|---|---|
| Conservative | Archibald Southby | 44,076 | 85.34 | ||
| Labour | Stanley Morgan | 7,571 | 14.66 | ||
| Majority | 36,505 | 70.68 | |||
| Turnout | |||||
| Conservative hold | Swing | ||||
| Party | Candidate | Votes | % | ± | |
|---|---|---|---|---|---|
| Conservative | Archibald Southby | 49,948 | 72.14 | ||
| Labour | Stanley Morgan | 19,286 | 27.86 | ||
| Majority | 30,662 | 44.29 | |||
| Turnout | |||||
| Conservative hold | Swing | ||||
General election 1939/40:
Another general election was required to take place before the end of 1940. The political parties had been making preparations for an election to take place and by the Autumn of 1939, the following candidates had been selected;
- Conservative: Archibald Southby
- Labour: C Hackforth-Jones[8]
Elections in the 1940s
| Party | Candidate | Votes | % | ± | |
|---|---|---|---|---|---|
| Conservative | Archibald Southby | 27,081 | 49.91 | ||
| Labour | Edward Shackleton | 20,533 | 37.84 | ||
| Liberal | James Morgan Fowler | 6,643 | 12.24 | ||
| Majority | 6,548 | ||||
| Turnout | 74.87 | ||||
| Conservative hold | Swing | ||||
| Party | Candidate | Votes | % | ± | |
|---|---|---|---|---|---|
| Conservative | Malcolm McCorquodale | 33,633 | 61.0 | +11.1 | |
| Labour | R. Bishop | 17,339 | 31.5 | −6.3 | |
| Liberal | David Cairns | 4,121 | 7.5 | −4.7 | |
| Majority | 16,447 | 33.0 | |||
| Turnout | 16,294 | ||||
| Conservative hold | Swing | ||||
Elections in the 1950s
| Party | Candidate | Votes | % | ± | |
|---|---|---|---|---|---|
| Conservative | Malcolm McCorquodale | 33,103 | 60.73 | ||
| Labour | Frank Martin Hardie | 15,256 | 27.99 | ||
| Liberal | N. Geoffrey Hudson | 6,153 | 11.29 | ||
| Majority | 17,847 | 32.74 | |||
| Turnout | |||||
| Conservative hold | Swing | ||||
| Party | Candidate | Votes | % | ± | |
|---|---|---|---|---|---|
| Conservative | Malcolm McCorquodale | 36,333 | 68.66 | ||
| Labour | Frank Martin Hardie | 16,584 | 31.34 | ||
| Majority | 19,749 | 37.32 | |||
| Turnout | |||||
| Conservative hold | Swing | ||||
| Party | Candidate | Votes | % | ± | |
|---|---|---|---|---|---|
| Conservative | Peter Rawlinson | 36,779 | 71.44 | ||
| Labour | Arthur Bertram Spencer Soper | 14,706 | 28.56 | ||
| Majority | 22,073 | 42.87 | |||
| Turnout | 77.56 | ||||
| Conservative hold | Swing | ||||
| Party | Candidate | Votes | % | ± | |
|---|---|---|---|---|---|
| Conservative | Peter Rawlinson | 35,484 | 62.88 | ||
| Labour | D. Eric Heather | 11,039 | 19.56 | ||
| Liberal | Robert William M. Walsh | 9,910 | 17.56 | ||
| Majority | 24,445 | 43.32 | |||
| Turnout | |||||
| Conservative hold | Swing | ||||
Elections in the 1960s
| Party | Candidate | Votes | % | ± | |
|---|---|---|---|---|---|
| Conservative | Peter Rawlinson | 31,959 | 55.05 | ||
| Liberal | Robert William M. Walsh | 13,968 | 24.06 | ||
| Labour | Alan Lee Williams | 12,131 | 20.89 | ||
| Majority | 17,991 | 30.99 | |||
| Turnout | |||||
| Conservative hold | Swing | ||||
| Party | Candidate | Votes | % | ± | |
|---|---|---|---|---|---|
| Conservative | Peter Rawlinson | 31,434 | 54.59 | ||
| Labour | Cyril Carter | 13,841 | 24.04 | ||
| Liberal | Robert William M. Walsh | 12,305 | 21.37 | ||
| Majority | 17,593 | 30.55 | |||
| Turnout | |||||
| Conservative hold | Swing | ||||
Elections in the 1970s
| Party | Candidate | Votes | % | ± | |
|---|---|---|---|---|---|
| Conservative | Peter Rawlinson | 35,541 | 61.41 | ||
| Labour | E. Guy Wilson | 12,767 | 22.06 | ||
| Liberal | Peter Hasler Billenness | 9,563 | 16.52 | ||
| Majority | 22,774 | 39.35 | |||
| Turnout | |||||
| Conservative hold | Swing | ||||
See also
References
- ↑ Leigh Rayment's Historical List of MPs – Constituencies beginning with "E" (part 2)
- 1 2 3 4 Liberal Yearbook 1907.
- 1 2 3 4 5 6 7 Craig, FWS, ed. (1974). British Parliamentary Election Results: 1885-1918. London: Macmillan Press. ISBN 9781349022984.
- ↑ "Election Intelligence". London Evening Standard. 28 Sep 1885. p. 3. Retrieved 26 November 2017 – via British Newspaper Archive. (Subscription required (help)).
- 1 2 3 Debrett's House of Commons, 1901.
- 1 2 3 Debrett's House of Commons, 1916
- 1 2 3 4 5 6 7 8 9 10 British Parliamentary Election Results 1918-1949, F. W. S. Craig, Political Reference Publications, Glasgow, 1949.
- ↑ Report of the Annual Conference of the Labour Party, 1939.
- 1 2 3 4 5 6 7 British parliamentary election results, 1950-1973, by F. W. S. Craig, Political Reference Publications, Glasgow, 1973.