Hang Seng Index
| Hang Seng Index | |||||||||||||||||||||
| Traditional Chinese | 恒生指數 | ||||||||||||||||||||
|---|---|---|---|---|---|---|---|---|---|---|---|---|---|---|---|---|---|---|---|---|---|
| Simplified Chinese | 恒生指数 | ||||||||||||||||||||
| |||||||||||||||||||||
The Hang Seng Index (abbreviated: HSI, Chinese: 恒生指數) is a freefloat-adjusted market-capitalization-weighted stock-market index in Hong Kong. It is used to record and monitor daily changes of the largest companies of the Hong Kong stock market and is the main indicator of the overall market performance in Hong Kong. These 50 constituent companies represent about 58% of the capitalisation of the Hong Kong Stock Exchange.[1]
HSI was started on November 24, 1969, and is currently compiled and maintained by Hang Seng Indexes Company Limited, which is a wholly owned subsidiary of Hang Seng Bank, one of the largest banks registered and listed in Hong Kong in terms of market capitalisation. It is responsible for compiling, publishing and managing the Hang Seng Index and a range of other stock indexes, such as Hang Seng China Enterprises Index, Hang Seng China AH Index Series, Hang Seng China H-Financials Index, Hang Seng Composite Index Series, Hang Seng China A Industry Top Index, Hang Seng Corporate Sustainability Index Series and Hang Seng Total Return Index Series. Hang Seng in turn, despite being a public company, is held in majority by another listed international financial institution HSBC.
History
Ho Sin Hang, chairman of the Hang Seng Bank, conceived the idea of creating the Hang Seng Index as a "Dow Jones Index for Hong Kong".[2][3] Along with Hang Seng Director Lee Quo-wei, he commissioned Hang Seng's head of Research Stanley Kwan to create the index,[2] which debuted on November 24, 1969.[3]
Statistics
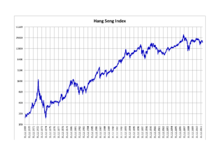
When the Hang Seng Index was first published, its base of 100 points was set equivalent to the stocks' total value as of the market close on July 31, 1964. Its all-time low is 58.61 points, reached retroactively on August 31, 1967, after the base value was established but before the publication of the index. The Hang Seng passed the 10,000 point milestone for the first time in its history on December 10, 1993 and, 13 years later, passed the 20,000 point milestone on December 28, 2006. In less than 10 months, it passed the 30,000 point milestone on October 18, 2007. Its all-time high, set on January 26, 2018, was 33,223.58 points[4] at closing. From October 30, 2007 through March 9, 2008, the index lost 9,426 points or approximately 30%. On September 5, it fell past the 20,000 mark the first time in almost a year to a low of 19,708.39, later closing at 19,933.28. On October 8, 2008, the index closed at 15,431.73, over 50% less than the all-time high and the lowest closing value in over two years. On October 27, 2008, the index further fell to 10,676.29 points, having fallen nearly two-thirds from its all-time peak, but passed the 20,000 point milestone again to 20,063.93 on 24 July 2009. The index reached 25,000.00 on August 19, 2014, reaching as high as 25,201.21 that day, later closing at 24,909.26 points. It continued rising to hit 26,000 on April 8, 2015 with a close of 26,236.86 The following day, it rose to as much as 27,922.67 before closing at 26,944.39. Yet again, another milestone was reached on April 13, 2015 rising to over 28,000 points, or closing to 28,016.34, the highest since December 2007. On July 8, 2015, the index fell as much as 2139 points. On 21 August the index entered a bear market. The index at that point hovered around 18000-19000 points[5], until it ended in February 2016. In 24 June 2016, the market fell 1,000 points in response to UK EU referendum results that "Leave" won the vote against "Remain". Then, the markets continuously fell on 27 and 28 June 2016 before recovered slightly on 29 June 2016.
Components
On January 2, 1985, four sub-indices were established in order to make the index clearer and to classify constituent stocks into four distinct sectors. There are 50 HSI constituent stocks in total. As of September 23, 2018 they are: [6]
Hang Seng Finance Sub-index
- 0005 HSBC Holdings plc
- 0011 Hang Seng Bank Ltd
- 0388 HKEx Limited
- 0939 China Construction Bank
- 1299 AIA Group Limited
- 1398 Industrial and Commercial Bank of China
- 2318 Ping An Insurance
- 2388 BOC Hong Kong (Holdings) Ltd
- 2628 China Life
- 3328 Bank of Communications Ltd
- 3988 Bank of China Ltd
Hang Seng Utilities Sub-index
- 0002 CLP Holdings Limited
- 0003 Hong Kong and China Gas Company Limited
- 0006 Power Assets Holdings Limited
- 0836 China Resources Power
- 1038 Cheung Kong Infrastructure Holdings Limited
Hang Seng Properties Sub-index
- 0012 Henderson Land Development Company Limited
- 0016 Sun Hung Kai Properties Limited
- 0017 New World Development Company Limited
- 0083 Sino Land Company Limited
- 0101 Hang Lung Properties Limited
- 0688 China Overseas Land & Investment Limited
- 0823 The Link REIT
- 1109 China Resources Land Limited
- 1113 CK Property Holdings Limited
- 1997 Wharf Real Estate Investment Company Limited
- 2003 Country Garden
Hang Seng Commerce & Industry Sub-index
- 0001 CK Hutchison Holdings Limited
- 0019 Swire Group
- 0027 Galaxy Entertainment Group Ltd.
- 0066 MTR Corporation Ltd
- 0151 Want Want China Holdings Ltd
- 0175 Geely Auto
- 0267 CITIC Pacific Ltd
- 0288 WH Group
- 0386 Sinopec Corp
- 0700 Tencent Holdings Limited
- 0762 China Unicom (Hong Kong) Limited
- 0857 PetroChina Company Limited
- 0883 CNOOC Ltd
- 0941 China Mobile Ltd
- 1044 Hengan International Group Co. Ltd
- 1088 China Shenhua Energy
- 1093 CSPC Pharmaceutical Group Ltd
- 1177 Sino Biopharm
- 1928 Sands China
- 2018 AAC Tech
- 2313 Shenzhou International
- 2319 Mengniu Dairy
- 2382 Sunny Optical
The Hang Seng Composite Index Series (恒生綜合指數) was launched on October 3, 2001, targeting on providing a broad standard of the performance of the Hong Kong stock market. It was last revamped on March 8, 2010, and comprises 307 constituents (will become 306 from August 9, 2010). The market capitalisation of these companies accounts for about 95% of the total capitalisation of the stocks in Hong Kong.
To ensure the impartiality of its operation, Hang Seng Indexes Company Limited established an Independent Advisory Committee to give advice on issues pertaining to the indexes, including constituent changes and the development of new indexes.
Hang Seng Industry Classification System
Hang Seng Industry Classification System (formerly called Hang Seng Stock Classification System) is a comprehensive system designed for the Hong Kong stock market by Hang Seng Indexes Company Limited. It reflects the stock performance in different sectors. It caters for the unique characteristics of the Hong Kong stock market and maintains the international compatibility with a mapping to international industry classification
General classification guidelines:
i) The sales revenue arising from each business area of a company is the primary parameter of stock classification. Profit or assets will also be taken into consideration where these better reflects the company's business.
ii) A company will be classified into different sectors according to its majority source of sales revenue(or profit or assets if relevant).
iii) Re-classification of a stock's Industry Sector will occur once the company's business has undergone a major change, such as, substantial merger or acquisition.
Industry sectors:
- Energy (能源業)
- Material (源材料業)
- Industrial Goods (工業製品業)
- Consumer Goods (消費品製造業)
- Services (服務業)
- Telecommunications (電訊業)
- Utilities (公共事業)
- Financials (金融業)
- Properties & Construction (地產建築業)
- Information Technology (資訊科技業)
- Conglomerates (綜合企業)
Source of information
The classification of each stock is based on the information available to the public, for example the annual reports and company announcements.
Selection criteria for the HSI constituent stocks
HSI constituent stocks are selected with the use of extensive analysis, together with external consultation. To be qualified for selection, a company:
- must be among those that comprise top 90% of the total market value of all ordinary shares;
- must be among those that comprise top 90% of the total turnover on the Stock Exchange of Hong Kong Limited "SEHK" (香港交易所);
- should have a listing history of 24 months or meet the requirements of the following Guidelines:
Guidelines for Handling Large-cap Stocks Listed for Less than 24 Months
For a newly listed large-cap stock, the minimum listing time required for inclusion in the stock universe for the HSI review is as follows:
| Average MV Rank at Time of Review | Minimum Listing History |
|---|---|
| Top 5 | 3 Months |
| 6–15 | 6 Months |
| 16–20 | 12 Months |
| 21–25 | 18 Months |
| Below 25 | 24 Months |
Among the eligible candidates, final selections are based on their:
- market capitalisation and turnover rankings;
- representation of the respective sub-sectors within HSI; and
- financial performance.
Calculation formula for HSI
The current Hang Seng Index is calculated from this formula:
![{\textrm {Current~Index}}={\frac {\sum {\textrm {[}}{\textrm {P(t)}}\times {\textrm {IS}}\times {\textrm {FAF}}\times {\textrm {CF}}{\textrm {]}}}{\sum {\textrm {[}}{\textrm {P(t-1)}}\times {\textrm {IS}}\times {\textrm {FAF}}\times {\textrm {CF}}{\textrm {]}}}}\times {\textrm {Yesterday's~Closing~Index}}.](../I/m/1ff318e0832a22434e2a950ae3561dae8b3ac2c4.svg)
Descriptions on parameters:
- P(t):Current Price at Day t
- P(t-1):Closing Price at Day (t-1)
- IS:Issued Shares (Only H-share portion is taken into calculation in case of H-share constituents.)
- FAF:Freefloat-adjusted Factor, which is between 0 and 1, adjusted quarterly
- CF:Cap Factor, which is between 0 and 1, adjusted quarterly
Daily reports for HSI
Investors in Asian markets monitor the following reports for investment activities:
- Hang Seng Indexes Daily Bulletin
- Hang Seng Index (HSI) Constituent Stocks Performance
- Index Performance Summary
- Total Return Index Series Daily Bulletin
Representativeness of the HSI
The representativeness of the HSI can be studied by the turnover of the whole stock market and by how much its market capitalisation covers. The aggregate market value of the HSI constituent stocks is maintained at approximately 60% of the total market value. This coverage ratio compares favorably with major overseas stock indices.
Other related Hang Seng stock indexes
- Hang Seng China Enterprises Index (恒生中國企業指數)
- Hang Seng China-Affiliated Corporations Index (恒生香港中資企業指數)
- Hang Seng Freefloat Index Series
- Hang Seng China H-Financials Index (恒生中國H股金融行業指數)
- Hang Seng Mainland 100 (恒生中國內地100)
- Hang Seng Mainland 25 (恒生中國內地25)
- Hang Seng HK 35 (恒生香港35)
- Hang Seng REIT Index (恒生房地產基金指數)
- Hang Seng Corporate Sustainability Index Series (恒生可持續發展企業指數系列)
- Hang Seng Composite Index (恒生綜合指數系列)
- Hang Seng Composite Industry Indexes (恒生綜合行業指數)
- Hang Seng Composite Size Indexes (恒生綜合市值指數)
- Hang Seng Short & Leveraged Index Series (恒生短倉及槓桿指數系列)
- Hang Seng China A Industry Top Index (恒生A股行業龍頭指數)
- Hang Seng China 50 Index (恒生神州50指數)
- Hang Seng China AH Premium Index(恒生AH股溢價指數)
- Hang Seng China AH Index Series (恒生AH指數系列)
- Hang Seng Total Return Index Series (恒生股息累計指數系列)
- Hang Seng Dividend Point Index Series (股息點指數系列)
- Hang Seng Global Composite Index
See also
References
- ↑ http://www.hsi.com.hk/HSI-Net/static/revamp/contents/en/dl_centre/factsheets/FS_HSIe.pdf
- 1 2 Kwan, Stanley S. K. (2009). The Dragon and the Crown. Hong Kong University Press. pp. 101–131. ISBN 9789622099555.
- 1 2 "Stanley Kwan, Hang Seng Index Creator, Dies at 86". New York Times. 2012-01-10.
- ↑ "HKEX". www.hkex.com.hk.
- ↑ Nishizawa, Kana; Haigh, Adam (August 21, 2015). "Hong Kong Stocks Enter Bear Market After Falling From April Peak". Bloomberg L.P. Retrieved August 23, 2015.
- ↑ Hang Seng Index 2018-09-23
External links
- Bloomberg page for HSI:IND
- Official website (in English) (in Chinese)
- Reuters page for .HSI
| History | |
|---|---|
| Currency | |
| Industry and Business | |
| Government agencies | |
| Employment and Tax | |
| Infrastructure and Transport | |
| Rankings | |
| Finance and Banking |
|
| Agreements | |
| Energy | |
| Other |
|
| |