Demographics of Cameroon
The demographic profile of Cameroon is complex for a country of its population. Cameroon comprises an estimated 250 distinct ethnic groups, which may be formed into five large regional-cultural divisions:
- western highlanders (Semi-Bantu or grassfielders), including the Bamileke, Bamum (or Bamoun), and many smaller Tikar groups in the Northwest (est. 38% of total population);
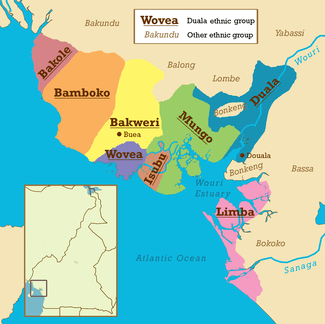
- coastal tropical forest peoples, including the Bassa, Duala (or Douala), and many smaller groups in the Southwest (12%);
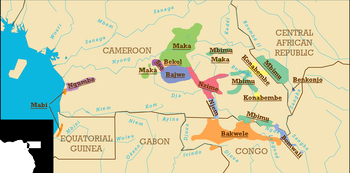
- southern tropical forest peoples, including the Beti-Pahuin, Bulu (a subgroup of Beti-Pahuin), Fang (subgroup of Beti-Pahuin), Maka, Njem, and Baka pygmies (18%);
- predominantly Islamic peoples of the northern semi-arid regions (the Sahel) and central highlands, including the Fulani (French: Peul or Peuhl; Fula: Fulɓe) (14%); and
- the "Kirdi", non-Islamic or recently Islamic peoples of the northern desert and central highlands (18%).
The Cameroon government held two national censuses during the country's first 44 years as an independent country, in 1976 and again in 1987. Results from the second head count were never published. A third census, expected to take years to produce results, began on November 11, 2005, with a three-week interviewing phase. It is one of a series of projects and reforms required by the International Monetary Fund as prerequisites for foreign debt relief. The first results were published in 2010.[1]
Population
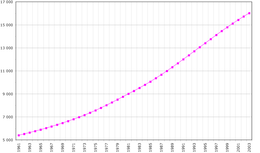
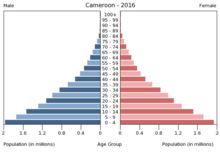
According to the 2017 revision of the World Population Prospects[2] the total population was 23,439,189 in 2016, compared to only 4 466 000 in 1950. The proportion of children below the age of 15 in 2010 was 40.6%, 55.9% was between 15 and 65 years of age, while 3.5% was 65 years or older.[3]
| Total population | Population aged 0–14 (%) | Population aged 15–64 (%) | Population aged 65+ (%) | |
|---|---|---|---|---|
| 1950 | 4 466 000 | 39.6 | 56.9 | 3.5 |
| 1955 | 4 901 000 | 40.1 | 56.4 | 3.5 |
| 1960 | 5 409 000 | 40.6 | 55.9 | 3.6 |
| 1965 | 6 049 000 | 41.5 | 54.9 | 3.6 |
| 1970 | 6 842 000 | 42.4 | 54.0 | 3.6 |
| 1975 | 7 838 000 | 43.6 | 52.7 | 3.7 |
| 1980 | 9 110 000 | 44.6 | 51.8 | 3.6 |
| 1985 | 10 519 000 | 45.2 | 51.2 | 3.6 |
| 1990 | 12 181 000 | 45.2 | 51.3 | 3.6 |
| 1995 | 13 940 000 | 44.4 | 52.1 | 3.5 |
| 2000 | 15 678 000 | 42.8 | 53.7 | 3.5 |
| 2005 | 17 554 000 | 41.6 | 54.9 | 3.5 |
| 2010 | 19 599 000 | 40.6 | 55.9 | 3.5 |
Fertility and births
Total Fertility Rate (TFR) (Wanted Fertility Rate) and Crude Birth Rate (CBR):[4]
| Year | CBR (Total) | TFR (Total) | CBR (Urban) | TFR (Urban) | CBR (Rural) | TFR (Rural) |
|---|---|---|---|---|---|---|
| 1991 | 39 | 5.82 (5.17) | 5.17 (4.52) | 6.29 (5.66) | ||
| 1998 | 37.4 | 5.2 (4.6) | 31.5 | 3.9 (3.4) | 40.1 | 5.8 (5.3) |
| 2004 | 37.8 | 5.0 (4.5) | 34.9 | 4.0 (3.7) | 40.5 | 6.1 (5.6) |
| 2011 | 38.1 | 5.1 (4.1) | 34.6 | 4.0 (3.2) | 41.3 | 6.4 (5.1) |
Fertility data as of 2011 (DHS Program):[5]
| Region | Total fertility rate | Percentage of women age 15–49 currently pregnant | Mean number of children ever born to women age 40–49 |
|---|---|---|---|
| Adamaoua | 5.2 | 8.6 | 6.5 |
| Centre (except Yaoundé) | 5.6 | 8.8 | 5.5 |
| Douala | 3.2 | 8.1 | 4.5 |
| Est | 5.4 | 12.0 | 5.6 |
| Extrême-Nord | 6.8 | 14.8 | 7.3 |
| Littoral (except Douala) | 4.6 | 8.4 | 5.1 |
| Nord | 6.5 | 12.4 | 7.1 |
| Nord-Ouest | 4.4 | 6.9 | 5.4 |
| Ouest | 6.0 | 10.1 | 5.8 |
| Sud | 4.6 | 9.6 | 5.2 |
| Sud-Ouest | 4.0 | 7.6 | 5.5 |
| Yaoundé | 3.5 | 6.5 | 4.4 |
Vital statistics
Registration of vital events is in Cameroon not complete. The Population Departement of the United Nations prepared the following estimates.[3]
| Period | Live births per year | Deaths per year | Natural change per year | CBR* | CDR* | NC* | TFR* | IMR* |
|---|---|---|---|---|---|---|---|---|
| 1950–1955 | 203,000 | 117,000 | 86,000 | 43.4 | 24.9 | 18.5 | 5.68 | 169 |
| 1955–1960 | 222,000 | 120,000 | 102,000 | 43.0 | 23.3 | 19.7 | 5.68 | 158 |
| 1960–1965 | 252,000 | 124,000 | 128,000 | 44.0 | 21.6 | 22.3 | 5.90 | 145 |
| 1965–1970 | 287,000 | 130,000 | 157,000 | 44.6 | 20.1 | 24.5 | 6.10 | 133 |
| 1970–1975 | 332,000 | 136,000 | 196,000 | 45.2 | 18.3 | 26.8 | 6.30 | 120 |
| 1975–1980 | 382,000 | 143,000 | 239,000 | 45.1 | 16.5 | 28.6 | 6.40 | 108 |
| 1980–1985 | 439,000 | 143,000 | 296,000 | 44.7 | 15.0 | 29.7 | 6.40 | 98 |
| 1985–1990 | 487,000 | 148,000 | 339,000 | 42.9 | 14.1 | 28.9 | 6.10 | 93 |
| 1990–1995 | 536,000 | 172,000 | 364,000 | 41.0 | 14.0 | 27.0 | 5.70 | 94 |
| 1995–2000 | 563,000 | 204,000 | 359,000 | 38.0 | 14.6 | 23.5 | 5.10 | 96 |
| 2000–2005 | 632,000 | 243,000 | 389,000 | 38.0 | 15.3 | 22.7 | 4.92 | 97 |
| 2005–2010 | 691,000 | 270,000 | 421,000 | 37.2 | 15.0 | 22.2 | 4.67 | 94 |
| * CBR = crude birth rate (per 1,000); CDR = crude death rate (per 1,000); NC = natural change (per 1,000); IMR = infant mortality rate per 1,000 births; TFR = total fertility rate (number of children per woman) | ||||||||
Life expectancy
| Period | Life expectancy in Years[6] |
|---|---|
| 1950–1955 | 38.54 |
| 1955–1960 | |
| 1960–1965 | |
| 1965–1970 | |
| 1970–1975 | |
| 1975–1980 | |
| 1980–1985 | |
| 1985–1990 | |
| 1990–1995 | |
| 1995–2000 | |
| 2000–2005 | |
| 2005–2010 | |
| 2010–2015 |
Ethnic groups
Languages
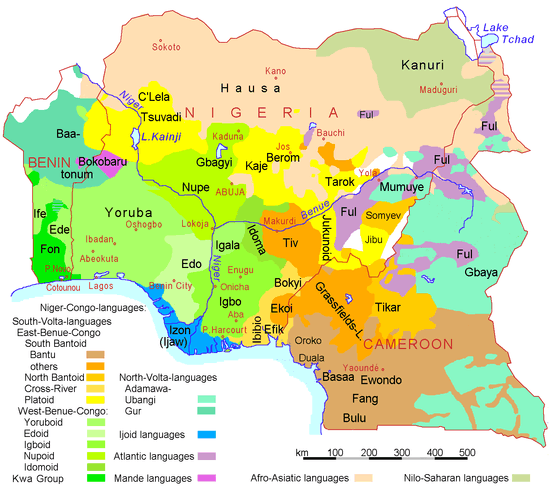
There are 24 major African language groups in Cameroon; additionally, English and French are official languages. Cameroonian Pidgin English is also widely spoken.
Peoples concentrated in the Southwest and Northwest Provinces—around Buea and Bamenda—use standard English and Cameroonian Pidgin English, as well as their local languages. In the three northern provinces—Adamawa, North, and Far North—either French or Fulfulde (the language of the Fulani) is widely spoken. Elsewhere, French is the principal second language, although pidgin and some local languages such as Ewondo, the dialect of a Beti clan from the Yaoundé area, have a wide currency.
Indigenous languages of Cameroon include:
CIA World Factbook demographic statistics
The following demographic statistics are from the CIA World Factbook, unless otherwise indicated.
Population
- 24,994,885 (2017 est.)
- Note: estimates for this country explicitly take into account the effects of excess mortality due to AIDS; this can result in lower life expectancy, higher infant mortality and death rates, lower population and growth rates, and changes in the distribution of population by age and sex than would otherwise be expected (July 2018 est.)
Birth rate
- 35.4 births/1,000 population (2017 est.)
Death rate
- 9.6 deaths/1,000 population (2017 est.)
Net migration rate
- -0.1 migrants/1,000 population (2017 est.).
Median age
- total: 18.5 years
- male: 18.4 years
- female: 18.7 years (2017 est.)
Population growth rate
- 2.56% (2013 est.)
Urbanization
- Urban population: 58% of total population (2010)
- Rate of urbanization: 3.3% annual rate of change (2010–15 est.)
Sex ratio
- At birth: 1.03 male(s)/female
- Under 15 years: 1.02 male(s)/female
- 15-64 years: 1.01 male(s)/female
- 65 years and over: 0.85 male(s)/female
- Total population: 1.01 male(s)/female (2009 est.)
Life expectancy at birth
- total population: 59 years
- male: 57.6 years
- female: 60.4 years (2017 est.)
Total Fertility Rate
According to Cameroon government website, average children per woman was 5.0 in 2004,[8] 4.7 in 2016.
HIV/AIDS
- Adult prevalence rate: 3.7% (2017 est.)
- People living with HIV/AIDS: 510,000 (2017 est.)
- Deaths: 24,000 (2017 est.)
Major infectious diseases
- Degree of risk: very high
- Food or waterborne diseases: bacterial and protozoal diarrhea, hepatitis A and hepatitis E, and typhoid fever
- Vectorborne diseases: malaria and yellow fever
- Water contact disease: schistosomiasis
- Respiratory disease: meningococcal meningitis
- Animal contact disease: rabies (2009)
Nationality
- Noun: Cameroonian(s)
- Adjective: Cameroonian
Religions
Literacy
- Definition: age 15 and over can read and write
- Total population: 75% (2015 est.)
- Male: 81.2%
- Female: 68.9%
Education expenditure
- 2.8% of GDP (2013)
References
- ↑ Cameroon - Third General Census of Population and Housing 2005 - IPUMS Subset (download first findings "Rapport de presentation des résultats définitifs" - pdf)
- ↑ "World Population Prospects: The 2017 Revision". ESA.UN.org (custom data acquired via website). United Nations Department of Economic and Social Affairs, Population Division. Retrieved 10 September 2017.
- 1 2 "Population Division of the Department of Economic and Social Affairs of the United Nations Secretariat, World Population Prospects: The 2010 Revision". Esa.un.org. Retrieved 2017-08-27.
- ↑ "MEASURE DHS: Demographic and Health Surveys". microdata.worldbank.org.
- ↑ "Cameroun : Enquête Démographique et de Santé et à Indicateurs Multiples 2011" (PDF). Dhsprogram.com. Retrieved 2017-08-27.
- ↑ "World Population Prospects - Population Division - United Nations". esa.un.org. Retrieved 2018-08-26.
- 1 2 3 4 5 6 7 8 9 10 11 12 13 14 15 "Africa ::CAMEROON". CIA The World Factbook.
- ↑ "LA POPULATION DU CAMEROUN EN 2010" (PDF). Statistics-cameroon.org. Retrieved 2017-08-27.

External links
| Wikimedia Commons has media related to Demographics of Cameroon. |
- Cameroon Undertakes Nationwide Census, a November 2005 article from Voice of America
- UNDP. 2006. Beyond scarcity: Power, poverty and the global water crisis. Human Development Report 2006. New York: United Nations Development Programme (UNDP).