Welsh Conservatives
Welsh Conservatives Ceidwadwyr Cymreig | |
|---|---|
|
| |
| Chairman | Byron Davies |
| Leader of the Assembly Group | [1] |
| Founded | 1921 |
| Headquarters |
Unit 5 Rhymney House Parc Ty Glas Llanishen Cardiff CF14 5DU |
| Ideology |
Conservatism[2] British unionism Economic liberalism[2] |
| Political position | Centre-right |
| National affiliation | Conservative Party |
| European affiliation | Alliance of Conservatives and Reformists in Europe |
| International affiliation | International Democrat Union |
| European Parliament group | European Conservatives and Reformists |
| Colours | Blue |
| National Assembly for Wales |
12 / 60 |
| House of Commons (Welsh seats) |
8 / 40 |
| European Parliament (Welsh seats) |
1 / 4 |
| Local government in Wales |
184 / 1,264 |
| Website | |
| https://www.welshconservatives.com | |
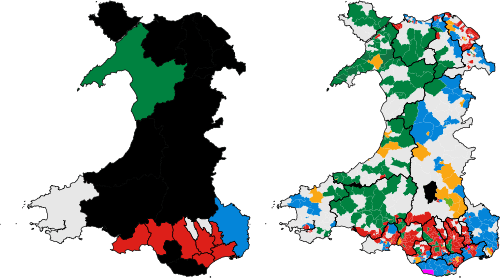
The Welsh Conservative Party (Welsh: Plaid Geidwadol Cymru) is the part of the Conservative Party that operates in Wales. At General Elections, it is the second most popular political party in Wales, having obtained the second largest share of the vote in every one since 1931.[3] In Welsh Assembly elections, the Conservatives are the third most supported party. They hold one of the four Welsh seats in the European Parliament, eight of the forty Welsh seats in the UK Parliament, and twelve of the sixty seats in the National Assembly for Wales.
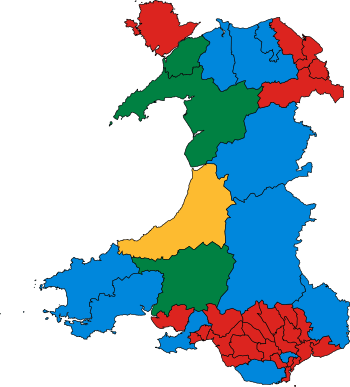
The 2015 general election saw the party's best results for thirty years.[4] At the 2017 General Election, the Welsh Conservatives dropped from eleven seats to eight.[5]
History
The Welsh Conservatives were formed (as the Wales and Monmouthshire Conservative and Unionist Council) in 1921 by the merger of the three existing Welsh Provincial Associations of the Party's National Union.[6] For much of their history they were dominated by the party in England, even to the extent of supplying the Welsh Secretaries of State. It was after the Assembly came to be established in 1999, which their members opposed, that they adjusted to becoming more of a Welsh orientated party. Their first Welsh Assembly leader, the former Welsh Office Minister Rod Richards, showed a combative style of politics against the Labour Assembly government. Richards subsequently resigned shortly after the Assembly had become established in response to allegations of an assault, from which he was later cleared.[7] Nicholas Bourne, a law professor and former leader of the No campaign in the Welsh Assembly referendum then became the leader, in an election that was unopposed. From 1999 to 2007 the party remained firmly in opposition in Wales, opposed to forming an alliance with other political parties. This changed in 2007 when the Welsh Conservatives were briefly involved in coalition talks after the indecisive 2007 Welsh election on a "rainbow coalition" with the Welsh Liberal Democrats and Plaid Cymru which collapsed after the Liberal Democrats backed out. Plaid Cymru ruled itself out of having a coalition with the Conservatives on an ideological basis. Plaid Cymru and Labour eventually formed the government under the terms of their One Wales agreement.[8] As a result of the agreement, the Conservatives, the largest opposition party, became the Official Opposition in the Welsh Assembly.
In the otherwise mainly successful Welsh Assembly elections of 2011 the long serving Welsh Conservative Party group leader, Nicholas Bourne (2000–2011) lost his regional list seat in Mid and West Wales. He had been the longest serving of the party political leaders in the Welsh Assembly. The Preseli Pembrokeshire Assembly Member Paul Davies then became the interim group leader whilst an election took place. The contest then consisted of Andrew R.T. Davies (South Wales Central) against Nick Ramsay (Monmouthshire). Andrew RT Davies won with some 53.1 per cent of the vote on a 49 per cent turnout of the party's Welsh membership. Also in the post May 2011 Welsh Assembly elections period David Melding (South Wales Central) was elected as the Deputy Presiding Officer for the Welsh Assembly. The first time a Conservative had held this post.
Electoral performance
Local elections
| Year | Votes | % | +/- | Overall control of Councils | +/- | Seats | +/- |
|---|---|---|---|---|---|---|---|
| 1993 | 84,909 | 12.5% | ? | 0 | ? | 32 | ?? |
| 1995 | 75,448 | 8.1% | 0 | 42 | |||
| 1999 | 99,565 | 10.1% | 0 | 75 | |||
| 2004 | 99,991 | 11.0% | 1 | 107 | |||
| 2008 | 148,708 | 15.6% | 2 | 165 | |||
| 2012* | 108,365 | 12.8% | 0 | 105 | |||
| 2017 | 182,520 | 18.8% | 1 | 184 | |||
*The 2012 figures excludes Anglesey which was elected in 2013 although the change in seats and votes shown is a direct comparison between the 2008 and 2012 figures in the 21 councils up for election. The 2017 figures are based on changes from the 2012 & 2013 elections.
European Parliament Elections
| Year | Share of votes | Seats |
|---|---|---|
| 1979 | 36.6% | 1 / 4 |
| 1984 | 25.4% | 1 / 4 |
| 1989 | 23.5% | 0 / 4 |
| 1994 | 14.6% | 0 / 5 |
| 1999 | 22.8% | 1 / 5 |
| 2004 | 19.4% | 1 / 4 |
| 2009 | 21.2% | 1 / 4 |
| 2014 | 17.4% | 1 / 4 |
UK General Elections
| Year | Share of votes | Seats |
|---|---|---|
| 1922 | 21.4% | 6 / 36 |
| 1923 | 21% | 4 / 36 |
| 1924 | 28.3% | 9 / 36 |
| 1929 | 21.9% | 1 / 36 |
| 1931 | 22.1% | 6 / 36 |
| 1935 | 23.3% | 6 / 36 |
| 1945 | 16.5% | 3 / 36 |
| 1950 | 21% | 3 / 36 |
| 1951 | 27.6% | 5 / 36 |
| 1955 | 26.7% | 5 / 36 |
| 1959 | 29.6% | 6 / 36 |
| 1964 | 27.6% | 6 / 36 |
| 1966 | 27% | 3 / 36 |
| 1970 | 27.7% | 7 / 36 |
| 1974 (Feb) | 25.9% | 8 / 36 |
| 1974 (Oct) | 23.9% | 8 / 36 |
| 1979 | 32.2% | 11 / 36 |
| 1983 | 31% | 14 / 38 |
| 1987 | 29.5% | 8 / 38 |
| 1992 | 28.6% | 6 / 38 |
| 1997 | 19.6% | 0 / 40 |
| 2001 | 21% | 0 / 40 |
| 2005 | 21.4% | 3 / 40 |
| 2010 | 26.1% | 8 / 40 |
| 2015 | 27.2% | 11 / 40 |
| 2017 | 33.6% | 8 / 40 |
Welsh Assembly Elections
| Year | Share of votes (constituency) | Share of votes (regional) | Seats (constituency) | Seats (regional) | Seats (total) | Government |
|---|---|---|---|---|---|---|
| 1999 | 15.8% | 16.5% | 1 / 40 |
8 / 20 |
9 / 60 |
Opposition |
| 2003 | 19.9% | 19.2% | 1 / 40 |
10 / 20 |
11 / 60 |
Opposition |
| 2007 | 22.4% | 21.4% | 5 / 40 |
7 / 20 |
12 / 60 |
Opposition |
| 2011 | 25.0% | 22.5% | 6 / 40 |
8 / 20 |
14 / 60 |
Opposition |
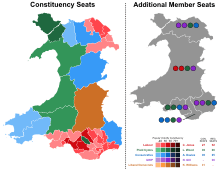
| 2016 | 21.1% | 18.8% | 6 / 40 |
5 / 20 |
11 / 60 |
Opposition |
References
- ↑ "BBC Wales Politics on Twitter".
- 1 2 Nordsieck, Wolfram (2016). "Wales/UK". Parties and Elections in Europe. Text "accessdate7 October 2018" ignored (help)
- ↑ Jones, B, Welsh Elections 1885 – 1997(1999), Lolfa
- ↑ Election 2015: Best Welsh Tory election for 30 years, 8 May 2015 BBC News
- ↑ "Results of the 2017 General Election". BBC News.
- ↑ Melding, D, Have We Been Anti-Welsh? The Conservative Party and the Welsh Nation (2005), Cymdeithas Y Kymberiaid
- ↑ "Welsh Tory leader resigns". BBC News. 11 August 1999. Retrieved 20 December 2011.
- ↑ "Labour agrees historic coalition". BBC News. 6 July 2007. Retrieved 20 December 2011.
| AMs in the National Assembly (60) |
|
|---|---|
| MPs in the UK Parliament (40) |
|
| Councillors in local unitary authorities (1,249) |
|