Hartland, Connecticut
Hartland is a town in Hartford County, Connecticut, United States. The population was 2,114 at the 2010 census.[1]
Hartland, Connecticut | |
|---|---|
 Seal | |
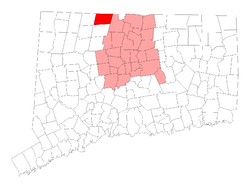 Location in Hartford County, Connecticut. | |
| Coordinates: 42°00′18″N 72°56′53″W | |
| Country | |
| U.S. state | |
| County | Hartford |
| Metropolitan area | Hartford |
| Incorporated | 1761 |
| Villages | Hartland East Hartland West Hartland |
| Government | |
| • Type | Selectman-town meeting |
| • First selectman | Wade E. Cole (D) |
| • Selectman | Magi Winslow (D) |
| • Selectman | Scott M. Levan (R) |
| Area | |
| • Total | 34.6 sq mi (89.6 km2) |
| • Land | 33.1 sq mi (85.7 km2) |
| • Water | 1.5 sq mi (3.9 km2) |
| Elevation | 531 ft (162 m) |
| Population (2010) | |
| • Total | 2,114 |
| • Density | 61/sq mi (24/km2) |
| Time zone | UTC-5 (Eastern) |
| • Summer (DST) | UTC-4 (Eastern) |
| ZIP code | 06027 |
| FIPS code | 09-37140 |
| GNIS feature ID | 0213443 |
| Website | www |
History
Residents petitioned the General Court and the legislature incorporated the town in May 1761.[2]
Geography
The town is bisected by the Farmington River's east branch, now the northern section of Barkhamsted Reservoir after construction of the Saville Dam in 1940.[3] The reservoir and surrounding land, owned by the Metropolitan District Commission (MDC) water authority, divides the town into two halves, East Hartland and West Hartland.
According to the United States Census Bureau, the town has a total area of 34.6 square miles (89.6 km2), of which 33.1 square miles (85.7 km2) is land and 1.5 square miles (3.9 km2), or 4.39%, is water.[1] Bounded on the north by the Massachusetts border, Hartland is drained by the Farmington River, a tributary of the Connecticut River. The 42nd parallel north and the 73rd meridian west meet in the central western part of town.
Hartland is home to three Connecticut State forests, Peoples State Forest, Tunxis State Forest, and American Legion State Forest[4] The Barkhamsted Reservoir, an 11-mile long, approximately 30 billion gallon reservoir, and is the primary source of drinking water for most of Hartford County. The construction of the reservoir and the Saville Dam required the relocation of over 1,000 people, four cemeteries, and countless family farms in Hartland and Barkhamsted.[3] In total, over 70% of Hartland's land, or over 15,500 acres, is permanently designated as open space, encompassing state forests and parks, watersheds, and public land conservation trusts.[5]
Demographics
| Historical population | |||
|---|---|---|---|
| Census | Pop. | %± | |
| 1800 | 1,318 | — | |
| 1810 | 1,284 | −2.6% | |
| 1820 | 1,254 | −2.3% | |
| 1830 | 1,221 | −2.6% | |
| 1840 | 1,060 | −13.2% | |
| 1850 | 848 | −20.0% | |
| 1860 | 846 | −0.2% | |
| 1870 | 789 | −6.7% | |
| 1880 | 643 | −18.5% | |
| 1890 | 565 | −12.1% | |
| 1900 | 592 | 4.8% | |
| 1910 | 544 | −8.1% | |
| 1920 | 448 | −17.6% | |
| 1930 | 296 | −33.9% | |
| 1940 | 300 | 1.4% | |
| 1950 | 549 | 83.0% | |
| 1960 | 1,040 | 89.4% | |
| 1970 | 1,303 | 25.3% | |
| 1980 | 1,416 | 8.7% | |
| 1990 | 1,866 | 31.8% | |
| 2000 | 2,012 | 7.8% | |
| 2010 | 2,114 | 5.1% | |
| U.S. ACS Census"American Community Survey 2017 Select Tables for Connecticut Towns and Census Tracts by Connecticut Data". Retrieved November 1, 2019.</ref> | |||
As of the census[6] American Community Survey of 2017, there were 2,083 people and 756 households residing in the town, for an estimated annual population decline of .08%. The population density was 63 people per square mile (23.5/km²). There were 822 housing units, of which 97.2% were single units, and 693 (91.7%) were owner-occupied. The racial makeup of the town was 91.84% White, 0.34% African American, 4.18% Native American, 1.54% Asian, 2.11% from other races and two or more races. Hispanic or Latino of any race were 2.11% of the population.
Of the 756 households, 24.7% had children under the age of 18 living with them. Of households with children, 82.26% were married couples, 14.52% had a female householder with no husband present, 3.23% had a male householder with no wife present, and 0.00% were non-families.
The population distribution in 2017 was 18.48% under the age of 14, 10.75% from 15 to 24, 18.58% from 25 to 44, 35.67% from 45 to 64, and 16.51% who were 65 years of age or older. 7.15% town members were veterans. In 2015, 51.25% of the population was female, 48.75% were male. 14.39% of females were under the age of 18, while 20.98% of females were 65 or older. 16.75% of males were under the age of 18, while 15.99% of males were 65 or older. Median age was 47.
The median income was $94,569, and per capita income was $41,377. 2.97% of the total population and 3.96% of children under 18 were below the poverty line. 2.91% of the town qualified for Supplemental Nutritional Assistance Program (SNAP).
Education
Educational data is provided by the Connecticut Economic Resource Center (CERC). Hartland School District consists of one school, Hartland School, pre-K through grade 8, with an enrollment in 2017 of 162. High school students can attend any of the CREC magnet schools, State of CT vocational schools, State of CT vocational-agricultural schools, the town-designated public high school (Granby High School as of 2019), or receive a voucher to attend another town public high school. Because of the wide variety in high school choice, 4-year cohort graduation rates were not available. From 2013-17, 73.1% of students attended public school, while 26.9% attended private school. By highest education level achieved as of 2017, 32% of the town earned a high school diploma, 12% an associate degree, and 32% bachelor's degree or higher.[7]
Government
Hartland is governed by a three-person, elected Board of Selectman with supporting elected town committees for Finance, School Board, Library Board, Planning & Zoning, and Zoning Board of Appeals. Total Revenues for 2017 was $7,217,096, with total expenditures of $6,988,601 including $115,495 (1.7% of expenditures) for debt (bond) service. Hartland is rated A1 by Moody's, and conveys a mill rate of 25.50 on a net Grand List of $198,192,769. Of the net Grand List, 1.3% is commercial/industrial.[8]
| Voter Registration and Party Enrollment as of November 5, 2018[9] | |||||
|---|---|---|---|---|---|
| Party | Active Voters | Inactive Voters | Total Voters | Percentage | |
| Republican | 626 | 29 | 655 | 40.89% | |
| Democratic | 332 | 15 | 347 | 21.66% | |
| Minor Parties | 31 | 1 | 32 | 2.00% | |
| Unaffiliated | 539 | 29 | 568 | 35.46% | |
| Total | 1,528 | 74 | 1,602 | 100% | |
Politics
Unlike most towns in the United States, results for this town are available for all presidential elections since 1856. From 1856-1876, Hartland mostly supported Democrats for president, with the sole GOP victory being a plurality that Abraham Lincoln received in the four-way race in 1860. The best Democratic showing in that time was the 64.71% received by New York governor Samuel J. Tilden in the close election of 1876. Tilden's showing remains a record for Democrats in Hartland as of 2019.
In the generations that have followed, Hartland has established itself as one of the most consistently Republican jurisdictions in the entire Northeastern United States, with the GOP currently holding a streak of 35 straight presidential election victories in Hartland. Of those 35 campaigns, 19 of them resulted in the GOP drawing a higher percentage than Tilden did in 1876, most recently Donald Trump in 2016. The record for a GOP candidate is the 86.77% that Dwight D. Eisenhower received in 1956
| Year | Democratic | Republican | Third Parties |
|---|---|---|---|
| 2016[11] | 28.19% 349 | 64.94% 804 | 6.87% 85 |
| 2012[12] | 34.36% 414 | 64.56% 778 | 1.08% 13 |
| 2008[13] | 38.87% 496 | 59.25% 756 | 1.88% 24 |
| 2004[14] | 37.15% 435 | 60.46% 708 | 2.39% 28 |
| 2000[15] | 36.60% 388 | 54.81% 581 | 8.59% 91 |
| 1996[16] | 32.31% 317 | 50.56% 496 | 17.13% 168 |
| 1992[17] | 28.42% 303 | 42.96% 458 | 28.61% 305* |
| 1988[18] | 35.25% 318 | 63.97% 577 | 0.78% 7 |
| 1984[19] | 22.97% 181 | 76.40% 602 | 0.63% 5 |
| 1980[20] | 25.83% 178 | 57.62% 397 | 16.55% 114 |
| 1976[21] | 33.12% 206 | 66.24% 412 | 0.64% 4 |
| 1972[22] | 21.31% 130 | 77.71% 474 | 0.98% 6 |
| 1968[23] | 26.12% 146 | 67.26% 376 | 6.62% 37 |
| 1964[24] | 43.01% 203 | 56.99% 269 | 0.00% 0 |
| 1960[25] | 21.03% 98 | 78.70% 362 | 0.00% 0 |
| 1956[26] | 13.23% 52 | 86.77% 341 | 0.00% 0 |
| 1952[27] | 17.47% 58 | 82.53% 274 | 0.00% 0 |
| 1948[28] | 21.27% 47 | 78.28% 173 | 0.45% 1 |
| 1944[29] | 25.98% 53 | 74.02% 151 | 0.00% 0 |
| 1940[30] | 31.71% 52 | 68.29% 112 | 0.00% 0 |
| 1936[31] | 27.88% 40 | 72.22% 104 | 0.00% 0 |
| 1932[32] | 24.31% 35 | 75.69% 109 | 0.00% 0 |
| 1928[33] | 17.56% 23 | 82.44% 108 | 0.00% 0 |
| 1924[34] | 17.89% 22 | 79.67% 98 | 2.44% 3 |
| 1920[35] | 18.87% 20 | 80.19% 85 | 0.94% 1 |
| 1916[36] | 38.00% 38 | 59.00% 59 | 3.00% 3 |
| 1912[37] | 38.00% 38 | 49.00% 49 | 13.00% 13 |
| 1908[38] | 25.56% 23 | 73.33% 66 | 1.11% 1 |
| 1904[39] | 23.64% 26 | 73.64% 81 | 2.73% 3 |
| 1900[40] | 23.16% 22 | 76.84% 73 | 0.00% 0 |
| 1896[41] | 20.80% 26 | 67.20% 84 | 12.00% 15 |
| 1892[42] | 35.81% 53 | 62.84% 93 | 1.35% 2 |
| 1888[43] | 42.01% 71 | 56.21% 95 | 1.78% 3 |
| 1884[44] | 45.50% 86 | 52.89% 100 | 1.59% 3 |
| 1880[45] | 48.57% 85 | 51.43% 90 | 0.00% 0 |
| 1876[46] | 64.71% 110 | 35.29% 60 | 0.00% 0 |
| 1872[47] | 61.97% 88 | 38.03% 54 | 0.00% 0 |
| 1868[48] | 60.22% 109 | 39.78% 72 | 0.00% 0 |
| 1864[49] | 55.50% 106 | 44.50% 85 | 0.00% 0 |
| 1860[50] | 39.49% 62 | 47.13% 74 | 13.38% 21 |
| 1856[51] | 49.74% 96 | 47.67% 92 | 2.59% 5 |
Site of interest
Notable residents
- Asher Benjamin, architect
- Gary Burghoff, actor
- Uriel Holmes, congressman
- Consider Tiffany, British loyalist
- John Trumbull, artist
References
- "Geographic Identifiers: 2010 Demographic Profile Data (G001): Hartland town, Hartford County, Connecticut". U.S. Census Bureau, American Factfinder. Archived from the original on February 12, 2020. Retrieved November 28, 2012.
- Hartford Courant (25 July 1996). "Hartland". Hartford Courant. Retrieved 15 September 2019.
- https://connecticuthistory.org/barkhamsted-reservoir-construction-washes-away-a-community/
- http://cteco.uconn.edu/maps/town/DEPProp/DEEPProp_Hartland.pdf
- https://patch.com/connecticut/brookfield/map-how-much-of-your-town-is-open-space
- "American Community Survey 2017 Select Tables for Connecticut Towns and Census Tracts by Connecticut Data". Retrieved November 1, 2018.
- "Connecticut Economic Resource Center 2019 Town Profile for Hartland CT" (PDF). Retrieved November 1, 2019.
- "Connecticut Economic Resource Center 2019 Town Profile for Hartland CT" (PDF). Retrieved November 1, 2019.
- "Registration and Party Enrollment Statistics as of November 5, 2018" (PDF). Connecticut Secretary of State. Retrieved 2019-11-01.
- https://authoring.ct.gov//SOTS/Election-Services/Statement-Of-Vote-PDFs/General-Elections-Statement-of-Vote-1922
- https://portal.ct.gov/-/media/SOTS/ElectionServices/StatementOfVote_PDFs/2016StatementofVotepdf.pdf?la=en
- https://portal.ct.gov/-/media/SOTS/ElectionServices/StatementOfVote_PDFs/2012StatementofVoteBookpdf.pdf?la=en
- https://portal.ct.gov/-/media/SOTS/ElectionServices/StatementOfVote_PDFs/2008SOVpdf.pdf?la=en
- https://portal.ct.gov/-/media/SOTS/ElectionServices/StatementOfVote_PDFs/2004SOVpdf.pdf?la=en
- https://portal.ct.gov/-/media/SOTS/ElectionServices/StatementOfVote_PDFs/2000SOVpdf.pdf?la=en
- https://portal.ct.gov/-/media/SOTS/ElectionServices/StatementOfVote_PDFs/1996SOVpdf.pdf?la=en
- https://portal.ct.gov/-/media/SOTS/ElectionServices/StatementOfVote_PDFs/1992SOVpdf.pdf?la=en
- https://portal.ct.gov/-/media/SOTS/ElectionServices/StatementOfVote_PDFs/1988SOVpdf.pdf?la=en
- https://portal.ct.gov/-/media/SOTS/ElectionServices/StatementOfVote_PDFs/1984SOVpdf.pdf?la=en
- https://portal.ct.gov/-/media/SOTS/ElectionServices/StatementOfVote_PDFs/1980SOVpdf.pdf?la=en
- https://portal.ct.gov/-/media/SOTS/ElectionServices/StatementOfVote_PDFs/1976SOVpdf.pdf?la=en
- https://portal.ct.gov/-/media/SOTS/ElectionServices/StatementOfVote_PDFs/1972SOVpdf.pdf?la=en
- https://portal.ct.gov/-/media/SOTS/ElectionServices/StatementOfVote_PDFs/1968SOVpdf.pdf?la=en
- https://portal.ct.gov/-/media/SOTS/ElectionServices/StatementOfVote_PDFs/1964SOVpdf.pdf?la=en
- https://portal.ct.gov/-/media/SOTS/ElectionServices/StatementOfVote_PDFs/1960SOVpdf.pdf?la=en
- https://portal.ct.gov/-/media/SOTS/ElectionServices/StatementOfVote_PDFs/1956SOVpdf.pdf?la=en
- https://portal.ct.gov/-/media/SOTS/ElectionServices/StatementOfVote_PDFs/1952SOVpdf.pdf?la=en
- https://portal.ct.gov/-/media/SOTS/ElectionServices/StatementOfVote_PDFs/1948SOVpdf.pdf?la=en
- https://portal.ct.gov/-/media/SOTS/ElectionServices/StatementOfVote_PDFs/1944SOVpdf.pdf?la=en
- https://portal.ct.gov/-/media/SOTS/ElectionServices/StatementOfVote_PDFs/1940SOVpdf.pdf?la=en
- https://portal.ct.gov/-/media/SOTS/ElectionServices/StatementOfVote_PDFs/1936SOVpdf.pdf?la=en
- https://portal.ct.gov/-/media/SOTS/ElectionServices/StatementOfVote_PDFs/1932SOVpdf.pdf?la=en
- https://portal.ct.gov/-/media/SOTS/ElectionServices/StatementOfVote_PDFs/1928SOVpdf.pdf?la=en
- https://portal.ct.gov/-/media/SOTS/ElectionServices/StatementOfVote_PDFs/1924SOVpdf.pdf?la=en
- https://babel.hathitrust.org/cgi/pt?id=njp.32101077270518&view=1up&seq=467
- https://babel.hathitrust.org/cgi/pt?id=njp.32101077270518&view=1up&seq=467
- https://babel.hathitrust.org/cgi/pt?id=njp.32101077270435&view=1up&seq=460
- https://babel.hathitrust.org/cgi/pt?id=njp.32101077270435&view=1up&seq=460
- https://babel.hathitrust.org/cgi/pt?id=njp.32101077270377&view=1up&seq=430
- https://babel.hathitrust.org/cgi/pt?id=njp.32101077270377&view=1up&seq=430
- https://babel.hathitrust.org/cgi/pt?id=coo.31924112672369&view=1up&seq=364
- https://babel.hathitrust.org/cgi/pt?id=coo.31924112672369&view=1up&seq=364
- https://babel.hathitrust.org/cgi/pt?id=umn.31951d02560755n&view=1up&seq=337
- https://babel.hathitrust.org/cgi/pt?id=umn.31951d02560755n&view=1up&seq=337
- https://babel.hathitrust.org/cgi/pt?id=umn.31951d02560755n&view=1up&seq=337
- https://babel.hathitrust.org/cgi/pt?id=umn.31951d02560755n&view=1up&seq=337
- https://babel.hathitrust.org/cgi/pt?id=umn.31951d02560755n&view=1up&seq=337
- https://babel.hathitrust.org/cgi/pt?id=umn.31951d02560755n&view=1up&seq=337
- https://babel.hathitrust.org/cgi/pt?id=umn.31951d02560755n&view=1up&seq=337
- https://babel.hathitrust.org/cgi/pt?id=umn.31951d02560755n&view=1up&seq=337
- https://babel.hathitrust.org/cgi/pt?id=umn.31951d02560755n&view=1up&seq=337
Further reading
External links

Municipalities and communities of Hartford County, Connecticut, United States | ||
|---|---|---|
| Cities | 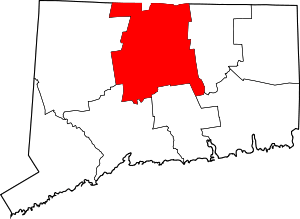 | |
| Towns | ||
| CDPs | ||
| Other communities | ||
| Authority control |
|
|---|