2012 United States presidential election in Wisconsin
The 2012 United States presidential election in Wisconsin took place on November 6, 2012, as part of the 2012 United States presidential election in which all 50 states plus the District of Columbia participated. Wisconsin voters chose 10 electors to represent them in the Electoral College via a popular vote pitting incumbent Democratic President Barack Obama and his running mate, Vice President Joe Biden, against Republican challenger and former Massachusetts Governor Mitt Romney and his running mate, Congressman Paul Ryan.
| ||||||||||||||||||||||||||
| Turnout | 70.35%[1] | |||||||||||||||||||||||||
|---|---|---|---|---|---|---|---|---|---|---|---|---|---|---|---|---|---|---|---|---|---|---|---|---|---|---|
| ||||||||||||||||||||||||||
 County Results
| ||||||||||||||||||||||||||
| ||||||||||||||||||||||||||
| Elections in Wisconsin | ||||||||||
|---|---|---|---|---|---|---|---|---|---|---|
 | ||||||||||
|
||||||||||
|
||||||||||
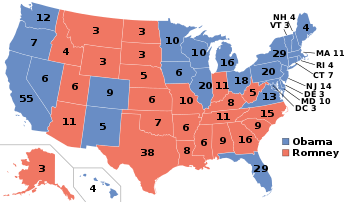
When all ballots were counted, Obama won 52.83% of the vote to Romney's 45.89%, a 6.94% margin of victory.[2]
While this represented a reduced margin from Obama's nearly 14-point sweep in 2008, it was still a stronger Democratic win in Wisconsin than was achieved by either John Kerry in 2004 or Al Gore in 2000; in both of those years Democrats won the state by a margin of less than 1 point. Obama-Biden's win was also surprisingly comfortable in spite of the fact that Wisconsin was the home state of Republican vice presidential candidate Paul Ryan, making him the first Republican vice presidential candidate to lose their home state since Jack Kemp lost New York in 1996. Despite Ryan losing his home state and the state weighing in as three percentage points more Democratic than the national average, the state would unexpectedly flip red in the 2016 election.
General Election
Results
Although Paul Ryan was from Wisconsin, the Republicans lost by around a seven-point margin. This kept Wisconsin a Democratic state.
| 2012 United States presidential election in Wisconsin | ||||||
|---|---|---|---|---|---|---|
| Party | Candidate | Running mate | Votes | Percentage | Electoral votes | |
| Democratic | Barack Obama | Joe Biden | 1,620,985 | 52.83% | 10 | |
| Republican | Mitt Romney | Paul Ryan | 1,407,966 | 45.89% | 0 | |
| Libertarian | Gary Johnson | Jim Gray | 20,439 | 0.67% | 0 | |
| Green | Jill Stein | Cheri Honkala | 7,665 | 0.25% | 0 | |
| Write-Ins | Write-Ins | 5,170 | 0.17% | 0 | ||
| Constitution | Virgil Goode | Jim Clymer | 4,930 | 0.16% | 0 | |
| Socialist Equality | Jerry White | Phyllis Scherrer | 553 | 0.02% | 0 | |
| Socialism and Liberation | Gloria La Riva | Filberto Ramirez Jr. | 526 | 0.02% | 0 | |
| Justice | Rocky Anderson | Luis J. Rodriguez | 112 | 0.00% | 0 | |
| Peace & Freedom | Roseanne Barr | Cindy Sheehan | 88 | 0.00% | 0 | |
| Totals | 3,068,434 | 100.00% | 10 | |||
Results by county
| County | Obama | Votes | Romney | Votes | Others | Votes | Total |
|---|---|---|---|---|---|---|---|
| Adams | 53.87% | 5,542 | 45.14% | 4,644 | 0.98% | 101 | 10,287 |
| Ashland | 64.49% | 5,399 | 33.68% | 2,820 | 1.83% | 153 | 8,372 |
| Barron | 47.99% | 10,890 | 50.43% | 11,443 | 1.58% | 359 | 22,692 |
| Bayfield | 61.64% | 6,033 | 36.84% | 3,606 | 1.52% | 149 | 9,788 |
| Brown | 48.50% | 62,526 | 50.29% | 64,836 | 1.21% | 1,566 | 128,928 |
| Buffalo | 50.72% | 3,570 | 47.79% | 3,364 | 1.49% | 105 | 7,039 |
| Burnett | 45.94% | 3,986 | 52.44% | 4,550 | 1.62% | 141 | 8,677 |
| Calumet | 43.49% | 11,489 | 55.03% | 14,539 | 1.48% | 392 | 26,420 |
| Chippewa | 49.26% | 15,237 | 49.53% | 15,322 | 1.21% | 373 | 30,932 |
| Clark | 44.72% | 6,172 | 53.71% | 7,412 | 1.57% | 217 | 13,801 |
| Columbia | 56.03% | 17,175 | 42.49% | 13,026 | 1.48% | 453 | 30,654 |
| Crawford | 59.22% | 4,629 | 39.24% | 3,067 | 1.55% | 121 | 7,817 |
| Dane | 71.03% | 216,071 | 27.50% | 83,644 | 1.47% | 4,466 | 304,181 |
| Dodge | 42.17% | 18,762 | 56.67% | 25,211 | 1.16% | 515 | 44,488 |
| Door | 52.95% | 9,357 | 45.96% | 8,121 | 1.09% | 193 | 17,671 |
| Douglas | 64.92% | 14,863 | 33.66% | 7,705 | 1.42% | 326 | 22,894 |
| Dunn | 51.46% | 11,316 | 46.49% | 10,224 | 2.06% | 452 | 21,992 |
| Eau Claire | 55.95% | 30,666 | 42.43% | 23,256 | 1.61% | 884 | 54,806 |
| Florence | 36.30% | 953 | 62.67% | 1,645 | 1.03% | 27 | 2,625 |
| Fond du Lac | 41.91% | 22,379 | 56.84% | 30,355 | 1.25% | 668 | 53,402 |
| Forest | 52.17% | 2,425 | 46.73% | 2,172 | 1.10% | 51 | 4,648 |
| Grant | 56.06% | 13,594 | 42.29% | 10,255 | 1.65% | 399 | 24,248 |
| Green | 58.00% | 11,206 | 40.66% | 7,857 | 1.34% | 259 | 19,322 |
| Green Lake | 39.20% | 3,793 | 59.76% | 5,782 | 1.03% | 100 | 9,675 |
| Iowa | 64.66% | 8,105 | 34.20% | 4,287 | 1.13% | 142 | 12,534 |
| Iron | 49.12% | 1,784 | 49.28% | 1,790 | 1.60% | 58 | 3,632 |
| Jackson | 56.89% | 5,298 | 41.88% | 3,900 | 1.23% | 115 | 9,313 |
| Jefferson | 45.52% | 20,158 | 53.11% | 23,517 | 1.37% | 606 | 44,281 |
| Juneau | 52.78% | 6,242 | 45.75% | 5,411 | 1.47% | 174 | 11,827 |
| Kenosha | 55.46% | 44,867 | 43.24% | 34,977 | 1.30% | 1,053 | 80,897 |
| Kewaunee | 46.69% | 5,153 | 52.07% | 5,747 | 1.24% | 137 | 11,037 |
| La Crosse | 57.82% | 36,693 | 40.58% | 25,751 | 1.60% | 1,018 | 63,462 |
| Lafayette | 57.04% | 4,536 | 41.68% | 3,314 | 1.28% | 102 | 7,952 |
| Langlade | 43.47% | 4,573 | 55.29% | 5,816 | 1.24% | 130 | 10,519 |
| Lincoln | 49.70% | 7,563 | 48.99% | 7,455 | 1.30% | 198 | 15,216 |
| Manitowoc | 47.88% | 20,403 | 50.69% | 21,604 | 1.43% | 610 | 42,617 |
| Marathon | 46.32% | 32,363 | 52.41% | 36,617 | 1.26% | 882 | 69,862 |
| Marinette | 47.56% | 9,882 | 51.11% | 10,619 | 1.33% | 276 | 20,777 |
| Marquette | 49.52% | 4,014 | 49.25% | 3,992 | 1.22% | 99 | 8,105 |
| Menominee | 86.49% | 1,191 | 13.00% | 179 | 0.51% | 7 | 1,377 |
| Milwaukee | 67.49% | 332,438 | 31.45% | 154,924 | 1.06% | 5,214 | 492,576 |
| Monroe | 48.83% | 9,515 | 49.65% | 9,675 | 1.51% | 295 | 19,485 |
| Oconto | 44.64% | 8,865 | 54.09% | 10,741 | 1.27% | 253 | 19,859 |
| Oneida | 48.27% | 10,452 | 50.42% | 10,917 | 1.31% | 283 | 21,652 |
| Outagamie | 48.28% | 45,659 | 50.09% | 47,372 | 1.63% | 1,538 | 94,569 |
| Ozaukee | 34.32% | 19,159 | 64.63% | 36,077 | 1.04% | 581 | 55,817 |
| Pepin | 50.72% | 1,876 | 48.50% | 1,794 | 0.78% | 29 | 3,699 |
| Pierce | 48.69% | 10,235 | 49.46% | 10,397 | 1.85% | 388 | 21,020 |
| Polk | 44.62% | 10,073 | 53.58% | 12,094 | 1.80% | 406 | 22,573 |
| Portage | 56.12% | 22,075 | 42.24% | 16,615 | 1.64% | 647 | 39,337 |
| Price | 49.20% | 3,887 | 49.16% | 3,884 | 1.65% | 130 | 7,901 |
| Racine | 51.28% | 53,008 | 47.74% | 49,347 | 0.98% | 1,009 | 103,364 |
| Richland | 57.41% | 4,969 | 41.28% | 3,573 | 1.31% | 113 | 8,655 |
| Rock | 61.00% | 49,219 | 37.82% | 30,517 | 1.18% | 954 | 80,690 |
| Rusk | 47.24% | 3,397 | 51.12% | 3,676 | 1.64% | 118 | 7,191 |
| Sauk | 58.68% | 18,736 | 40.21% | 12,838 | 1.11% | 353 | 31,927 |
| Sawyer | 49.71% | 4,486 | 49.22% | 4,442 | 1.07% | 97 | 9,025 |
| Shawano | 44.38% | 9,000 | 54.35% | 11,022 | 1.27% | 257 | 20,279 |
| Sheboygan | 44.56% | 27,918 | 54.38% | 34,072 | 1.06% | 661 | 62,651 |
| St Croix | 43.07% | 19,910 | 55.17% | 25,503 | 1.76% | 812 | 46,225 |
| Taylor | 39.56% | 3,763 | 58.88% | 5,601 | 1.56% | 148 | 9,512 |
| Trempealeau | 56.41% | 7,605 | 42.33% | 5,707 | 1.25% | 169 | 13,481 |
| Vernon | 56.37% | 8,044 | 41.64% | 5,942 | 1.98% | 283 | 14,269 |
| Vilas | 42.99% | 5,951 | 55.98% | 7,749 | 1.03% | 142 | 13,842 |
| Walworth | 43.12% | 22,552 | 55.46% | 29,006 | 1.42% | 745 | 52,303 |
| Washburn | 47.88% | 4,447 | 50.60% | 4,699 | 1.52% | 141 | 9,287 |
| Washington | 29.42% | 23,166 | 69.55% | 54,765 | 1.03% | 811 | 78,742 |
| Waukesha | 32.31% | 78,779 | 66.76% | 162,798 | 0.93% | 2,279 | 243,856 |
| Waupaca | 44.81% | 11,578 | 54.19% | 14,002 | 1.01% | 260 | 25,840 |
| Waushara | 44.28% | 5,335 | 54.47% | 6,562 | 1.25% | 151 | 12,048 |
| Winnebago | 50.97% | 45,449 | 47.24% | 42,122 | 1.80% | 1,602 | 89,173 |
| Wood | 47.77% | 18,581 | 50.65% | 19,704 | 1.58% | 615 | 38,900 |
| Totals | 52.83% | 1,620,985 | 45.89% | 1,407,966 | 1.29% | 39,483 | 3,068,434 |
Democratic primary
[data unknown/missing]
President Barack Obama was unopposed in the Democratic Primary, winning 293,914 votes, or 97.89% of the vote. 'Uncommitted' received 5.492 votes, or 1.89% of the vote. 849 votes, 0.28%, were scattered. 111 delegates were sent to the 2012 Democratic National Convention in Charlotte, North Carolina http://gab.wi.gov/sites/default/files/Percentage%20Results_Spring%20Election%20and%20Presidential%20Preference_4.3.12.pdf
Republican primary
| |||||||||||||||||||||||||||||||||||||||||
| |||||||||||||||||||||||||||||||||||||||||
 Wisconsin results by county
Mitt Romney
Rick Santorum | |||||||||||||||||||||||||||||||||||||||||

The 2012 Wisconsin Republican 2012 primary took place on April 3, 2012,[3][4] the same day as the District of Columbia and Maryland Republican primaries.
| 2012 Wisconsin Republican primary[5] | |||
|---|---|---|---|
| Candidate | Votes | Percentage | Delegates |
| 346,876 | 44.03% | 33 | |
| Rick Santorum | 290,139 | 36.83% | 9 |
| Ron Paul | 87,858 | 11.15% | 0 |
| Newt Gingrich | 45,978 | 5.84% | 0 |
| Michele Bachmann | 6,045 | 0.77% | 0 |
| Jon Huntsman | 5,083 | 0.65% | 0 |
| Uninstructed | 4,200 | 0.53% | 0 |
| Scattering | 1,668 | 0.21% | 0 |
| Total: | 787,847 | 100% | 42 |
See also
References
- http://elections.wi.gov/elections-voting/statistics/turnout
- "Wisconsin Gov Accountability Board" (PDF). Retrieved January 16, 2013.
- "Primary and Caucus Printable Calendar". CNN. Retrieved January 12, 2012.
- "Presidential Primary Dates" (PDF). Federal Election Commission. Retrieved January 23, 2012.
- http://gab.wi.gov/sites/default/files/Percentage%20Results_Spring%20Election%20and%20Presidential%20Preference_4.3.12.pdf
External links
- The Green Papers: for Wisconsin
- The Green Papers: Major state elections in chronological order
State and district results of the 2012 United States presidential election | ||
|---|---|---|
|  | |
| ||