2012 United States presidential election in Maryland
The 2012 United States presidential election in Maryland took place on November 6, 2012, as part of the 2012 general election in which all 50 states plus the District of Columbia participated. Maryland voters chose 10 electors to represent them in the Electoral College via a popular vote pitting incumbent Democratic President Barack Obama and his running mate, Vice President Joe Biden, against Republican challenger and former Massachusetts Governor Mitt Romney and his running mate, Congressman Paul Ryan.
| ||||||||||||||||||||||||||
| ||||||||||||||||||||||||||
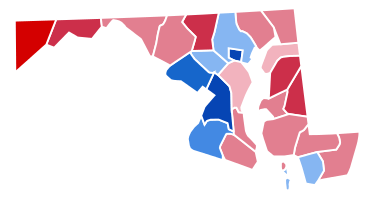 County Results
| ||||||||||||||||||||||||||
| ||||||||||||||||||||||||||
| Elections in Maryland | ||||||||
|---|---|---|---|---|---|---|---|---|
.svg.png) | ||||||||
|
||||||||
|
||||||||
|
Elections by year |
||||||||
|
| ||||||||
Results
| United States presidential election in Maryland, 2012[1] | ||||||
|---|---|---|---|---|---|---|
| Party | Candidate | Running mate | Votes | Percentage | Electoral votes | |
| Democratic | Barack Obama | Joe Biden | 1,677,844 | 61.97% | 10 | |
| Republican | Mitt Romney | Paul Ryan | 971,869 | 35.90% | 0 | |
| Libertarian | Gary Johnson | Jim Gray | 30,195 | 1.12% | 0 | |
| Green | Jill Stein | Cheri Honkala | 17,110 | 0.63% | 0 | |
| Others | 10,309 | 0.38% | 0 | |||
| Totals | 2,707,327 | 100.00% | 10 | |||
| Voter turnout (registered voters) | 69.4% | |||||
Results by county
| County | Barack Hussein Obama Democratic |
Willard Mitt Romney Republican |
Various candidates Other parties |
Margin | Total votes cast | ||||
|---|---|---|---|---|---|---|---|---|---|
| # | % | # | % | # | % | # | % | ||
| Allegany | 9,805 | 32.85% | 19,230 | 64.42% | 815 | 2.73% | -9,425 | -31.57% | 29,850 |
| Anne Arundel | 126,635 | 48.68% | 126,832 | 48.75% | 6,688 | 2.57% | -197 | -0.08% | 260,155 |
| Baltimore County | 220,322 | 57.26% | 154,908 | 40.26% | 9,552 | 2.48% | 65,414 | 17.00% | 384,782 |
| Baltimore City | 221,478 | 87.19% | 28,171 | 11.09% | 4,356 | 1.71% | 193,307 | 76.10% | 254,005 |
| Calvert | 20,529 | 45.10% | 23,952 | 52.62% | 1,037 | 2.28% | -3,423 | -7.52% | 45,518 |
| Caroline | 4,970 | 37.21% | 8,098 | 60.63% | 289 | 2.16% | -3,128 | -23.42% | 13,357 |
| Carroll | 27,939 | 31.92% | 56,761 | 64.84% | 2,836 | 3.24% | -28,822 | -32.93% | 87,536 |
| Cecil | 16,557 | 38.98% | 24,806 | 58.39% | 1,117 | 2.63% | -8,249 | -19.42% | 42,480 |
| Charles | 48,774 | 64.84% | 25,178 | 33.47% | 1,270 | 1.69% | 23,596 | 31.37% | 75,222 |
| Dorchester | 7,257 | 46.99% | 7,976 | 51.64% | 211 | 1.37% | -719 | -4.66% | 15,444 |
| Frederick | 55,146 | 47.09% | 58,798 | 50.21% | 3,171 | 2.71% | -3,652 | -3.12% | 117,115 |
| Garrett | 3,124 | 23.74% | 9,743 | 74.05% | 290 | 2.20% | -6,619 | -50.31% | 13,157 |
| Harford | 49,729 | 39.48% | 72,911 | 57.89% | 3,314 | 2.63% | -23,182 | -18.41% | 125,954 |
| Howard | 91,393 | 59.69% | 57,758 | 37.72% | 3,957 | 2.58% | 33,635 | 21.97% | 153,108 |
| Kent | 4,842 | 48.89% | 4,870 | 49.17% | 192 | 1.94% | -28 | -0.28% | 9,904 |
| Montgomery | 323,400 | 70.92% | 123,353 | 27.05% | 9,239 | 2.03% | 200,047 | 43.87% | 455,992 |
| Prince George's | 347,938 | 89.73% | 35,734 | 9.22% | 4,072 | 1.05% | 312,204 | 80.52% | 387,744 |
| Queen Anne's | 8,556 | 34.38% | 15,823 | 63.58% | 509 | 2.05% | -7,267 | -29.20% | 24,888 |
| St. Mary's | 19,711 | 41.22% | 26,797 | 56.03% | 1,316 | 2.75% | -7,086 | -14.82% | 47,824 |
| Somerset | 5,240 | 50.39% | 5,042 | 48.49% | 117 | 1.13% | 198 | 1.90% | 10,399 |
| Talbot | 8,808 | 43.05% | 11,339 | 55.42% | 312 | 1.53% | -2,531 | -12.37% | 20,459 |
| Washington | 25,042 | 39.90% | 36,074 | 57.48% | 1,639 | 2.61% | -11,032 | -17.58% | 62,755 |
| Wicomico | 19,635 | 46.46% | 21,764 | 51.50% | 860 | 2.04% | -2,129 | -5.04% | 42,259 |
| Worcester | 11,014 | 40.17% | 15,951 | 58.17% | 455 | 1.66% | -4,937 | -18.01% | 27,420 |
| Totals | 1,677,844 | 61.97% | 971,869 | 35.90% | 57,614 | 2.13% | 705,975 | 26.08% | 2,707,327 |
Republican primary
| |||||||||||||||||||||||||||||||||||||||||
| |||||||||||||||||||||||||||||||||||||||||
 Maryland results by county
Mitt Romney
Rick Santorum | |||||||||||||||||||||||||||||||||||||||||

The Republican primary took place on April 3, 2012, the same day as the District of Columbia Republican primary and the Wisconsin Republican primary.[2] After the primary, 37 delegates were selected to attend the Republican National Convention.
| Maryland Republican primary, 2012[3][4] | |||
|---|---|---|---|
| Candidate | Votes | Percentage | Delegates |
| 117,527 | 49.2% | 37 | |
| Rick Santorum | 69,020 | 28.9% | 0 |
| Newt Gingrich | 26,088 | 10.9% | 0 |
| Ron Paul | 22,698 | 9.5% | 0 |
| Jon Huntsman, Jr. | 1,406 | 0.6% | 0 |
| Rick Perry | 1,041 | 0.4% | 0 |
| Buddy Roemer | 858 | 0.4% | 0 |
| Fred Karger | 342 | 0.1% | 0 |
| Unprojected delegates: | 3 | ||
| Total: | 238,987 | 100% | 37 |
| Elections in Maryland | ||||||||
|---|---|---|---|---|---|---|---|---|
| ||||||||
|
||||||||
|
||||||||
|
Elections by year |
||||||||
|
| ||||||||
Minor parties
Green convention
| Green National Convention, Maryland Delegate Vote[5][6] | |||
|---|---|---|---|
| Candidate | Delegates | Percentage | |
| Jill Stein | 5 | 83% | |
| Roseanne Barr | 1 | 17% | |
| Others | - | - | |
| Total | 6 | 100% | |
Libertarian convention
| Libertarian National Convention, Maryland Delegate Vote [7] | |||
|---|---|---|---|
| Candidate | Delegates | Percentage | |
| Gary Johnson | 9 | 64% | |
| R. Lee Wrights | 4 | 29% | |
| Carl Person | 1 | 7% | |
| Others | - | - | |
| Total | 14 | 100% | |
References
- "Maryland State Board of Elections". Retrieved 2012-11-10.
- "Maryland Republican Primary". The New York Times. Retrieved June 8, 2015.
- http://www.sos.ms.gov/elections/electionresults/Republican%20Certification_2012%20Primary.pdf
- "maryland Republican Primary - Election Results - Election 2012". The New York Times.
- https://web.archive.org/web/20150215154138/http://www.jillstein.org/primaries
- https://www.youtube.com/watch?v=PNsmiN6mi6E
- https://www.lp.org/wp-content/uploads/2016/11/2012-Libertarian-Party-Convention-Minutes1.pdf
State and district results of the 2012 United States presidential election | ||
|---|---|---|
| 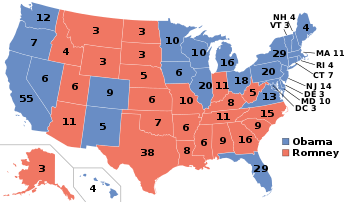 | |
| ||