Green County, Wisconsin
Green County is a county located in the U.S. state of Wisconsin. As of the 2010 census, the population was 36,842.[1] Its county seat is Monroe.[2] Green County is included in the Madison WI Metropolitan Statistical Area.
Green County | |
|---|---|
 | |
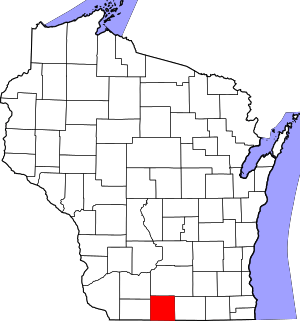 Location within the U.S. state of Wisconsin | |
 Wisconsin's location within the U.S. | |
| Coordinates: 42°41′N 89°36′W | |
| Country | |
| State | |
| Founded | 1837 |
| Named for | Nathanael Greene |
| Seat | Monroe |
| Largest city | Monroe |
| Area | |
| • Total | 584 sq mi (1,510 km2) |
| • Land | 584 sq mi (1,510 km2) |
| • Water | 0.5 sq mi (1 km2) 0.09%% |
| Population (2010) | |
| • Total | 36,842 |
| • Estimate (2019) | 36,960 |
| • Density | 63/sq mi (24/km2) |
| Time zone | UTC−6 (Central) |
| • Summer (DST) | UTC−5 (CDT) |
| Congressional district | 2nd |
| Website | www |
History
The county was created in 1837 from the Wisconsin Territory.[3] It is named for General Nathanael Greene,[4] who commanded the Southern Campaign in the American Revolutionary War.
Geography
According to the U.S. Census Bureau, the county has a total area of 584 square miles (1,510 km2), of which 584 square miles (1,510 km2) is land and 0.5 square miles (1.3 km2) (0.09%) is water.[5]
Major highways


Airport
Monroe Municipal Airport (KEFT) serves the county and surrounding communities.
Adjacent counties
- Dane County - north
- Rock County - east
- Winnebago County, Illinois - southeast
- Stephenson County, Illinois - south
- Lafayette County - west
- Iowa County - northwest
Demographics
| Historical population | |||
|---|---|---|---|
| Census | Pop. | %± | |
| 1840 | 933 | — | |
| 1850 | 8,566 | 818.1% | |
| 1860 | 19,808 | 131.2% | |
| 1870 | 23,611 | 19.2% | |
| 1880 | 21,729 | −8.0% | |
| 1890 | 22,732 | 4.6% | |
| 1900 | 22,719 | −0.1% | |
| 1910 | 21,641 | −4.7% | |
| 1920 | 21,568 | −0.3% | |
| 1930 | 21,870 | 1.4% | |
| 1940 | 23,146 | 5.8% | |
| 1950 | 24,172 | 4.4% | |
| 1960 | 25,851 | 6.9% | |
| 1970 | 26,714 | 3.3% | |
| 1980 | 30,012 | 12.3% | |
| 1990 | 30,339 | 1.1% | |
| 2000 | 33,647 | 10.9% | |
| 2010 | 36,842 | 9.5% | |
| Est. 2019 | 36,960 | [6] | 0.3% |
| U.S. Decennial Census[7] 1790–1960[8] 1900–1990[9] 1990–2000[10] 2010–2019[1] | |||

As of the 2000 census,[11] there were 33,647 people, 13,212 households, and 9,208 families residing in the county. The population density was 58 people per square mile (22/km²). There were 13,878 housing units at an average density of 24 per square mile (9/km²). The racial makeup of the county was 98.14% White, 0.26% Black or African American, 0.21% Native American, 0.29% Asian, 0.36% from other races, and 0.75% from two or more races. 0.97% of the population were Hispanic or Latino of any race. 31.9% were of German, 20.3% Swiss, 14.9% Norwegian, 6.7% Irish, 5.7% English and 5.5% American ancestry. 96.5% spoke English, 2.0% German and 1.1% Spanish as their first language.
There were 13,212 households out of which 33.70% had children under the age of 18 living with them, 58.30% were married couples living together, 7.50% had a female householder with no husband present, and 30.30% were non-families. 25.00% of all households were made up of individuals and 11.20% had someone living alone who was 65 years of age or older. The average household size was 2.51 and the average family size was 3.01.
In the county, the population was spread out with 26.50% under the age of 18, 6.70% from 18 to 24, 29.20% from 25 to 44, 22.90% from 45 to 64, and 14.70% who were 65 years of age or older. The median age was 38 years. For every 100 females there were 96.90 males. For every 100 females age 18 and over, there were 94.20 males.
As late as the 1970 federal census, Green County was the only county in the United States in which the largest foreign-born population was people born in Switzerland.
Communities

Cities
- Brodhead (partly in Rock County)
- Monroe (county seat)
Villages
- Albany
- Belleville (mostly in Dane County)
- Brooklyn (mostly in Dane County)
- Browntown
- Monticello
- New Glarus
Towns
Census-designated place
Unincorporated communities
Ghost towns/neighborhoods
Politics
Until the 1992 presidential election, Green County voters primarily backed the Republican Party candidate in national elections. Prior to that year, the only times they failed to win the county were in the midst of a divided party vote in 1912, the presence of Wisconsinite Robert La Follette on the ballot in 1924, & national Democratic Party landslides in 1932, 1936, & 1964. From 1992 onward, the county has backed the Democratic candidate in every presidential election, though their margins of victory have been often relatively narrow.
| Year | Republican | Democratic | Third parties |
|---|---|---|---|
| 2016 | 45.8% 8,693 | 48.1% 9,122 | 6.2% 1,170 |
| 2012 | 40.7% 7,857 | 58.0% 11,206 | 1.3% 259 |
| 2008 | 36.3% 6,730 | 62.1% 11,502 | 1.6% 302 |
| 2004 | 46.6% 8,497 | 52.5% 9,575 | 1.0% 176 |
| 2000 | 44.5% 6,790 | 51.5% 7,863 | 4.1% 623 |
| 1996 | 37.2% 4,697 | 48.6% 6,136 | 14.1% 1,783 |
| 1992 | 34.5% 4,887 | 38.6% 5,467 | 27.0% 3,829 |
| 1988 | 55.7% 6,636 | 43.3% 5,153 | 1.0% 119 |
| 1984 | 63.7% 7,827 | 35.5% 4,367 | 0.8% 102 |
| 1980 | 54.0% 7,714 | 37.4% 5,336 | 8.6% 1,227 |
| 1976 | 54.3% 7,085 | 43.2% 5,632 | 2.5% 329 |
| 1972 | 66.1% 7,422 | 32.4% 3,634 | 1.5% 166 |
| 1968 | 61.0% 6,502 | 32.9% 3,501 | 6.1% 651 |
| 1964 | 49.1% 5,364 | 50.8% 5,548 | 0.2% 17 |
| 1960 | 67.8% 7,939 | 32.2% 3,766 | 0.1% 6 |
| 1956 | 66.0% 7,114 | 33.5% 3,614 | 0.5% 51 |
| 1952 | 70.5% 7,949 | 29.5% 3,326 | 0.1% 6 |
| 1948 | 52.4% 4,403 | 46.2% 3,881 | 1.4% 114 |
| 1944 | 57.3% 5,556 | 42.3% 4,101 | 0.4% 42 |
| 1940 | 55.1% 5,711 | 44.1% 4,565 | 0.9% 88 |
| 1936 | 37.5% 3,700 | 60.3% 5,941 | 2.2% 218 |
| 1932 | 36.4% 3,190 | 61.7% 5,406 | 1.9% 162 |
| 1928 | 64.2% 5,152 | 35.0% 2,812 | 0.8% 63 |
| 1924 | 35.1% 2,922 | 5.1% 423 | 59.9% 4,986 |
| 1920 | 84.7% 5,466 | 9.8% 633 | 5.5% 356 |
| 1916 | 55.8% 2,422 | 38.8% 1,687 | 5.4% 234 |
| 1912 | 38.8% 1,601 | 41.6% 1,716 | 19.6% 807 |
| 1908 | 54.5% 2,617 | 38.6% 1,856 | 6.9% 331 |
| 1904 | 62.1% 2,992 | 30.4% 1,466 | 7.6% 364 |
| 1900 | 60.2% 2,996 | 35.7% 1,776 | 4.1% 204 |
| 1896 | 54.7% 3,093 | 41.4% 2,339 | 3.9% 220 |
| 1892 | 46.1% 2,329 | 40.6% 2,052 | 13.4% 677 |
References
- "State & County QuickFacts". United States Census Bureau. Archived from the original on June 6, 2011. Retrieved January 18, 2014.
- "Find a County". National Association of Counties. Archived from the original on May 31, 2011. Retrieved June 7, 2011.
- "Wisconsin: Individual County Chronologies". Wisconsin Atlas of Historical County Boundaries. The Newberry Library. 2007. Retrieved August 13, 2015.
- Gannett, Henry (1905). The Origin of Certain Place Names in the United States. Govt. Print. Off. p. 143.
- "2010 Census Gazetteer Files". United States Census Bureau. August 22, 2012. Retrieved August 4, 2015.
- "Population and Housing Unit Estimates". Retrieved March 26, 2020.
- "U.S. Decennial Census". United States Census Bureau. Retrieved August 4, 2015.
- "Historical Census Browser". University of Virginia Library. Retrieved August 4, 2015.
- Forstall, Richard L., ed. (March 27, 1995). "Population of Counties by Decennial Census: 1900 to 1990". United States Census Bureau. Retrieved August 4, 2015.
- "Census 2000 PHC-T-4. Ranking Tables for Counties: 1990 and 2000" (PDF). United States Census Bureau. April 2, 2001. Retrieved August 4, 2015.
- "U.S. Census website". United States Census Bureau. Retrieved May 14, 2011.
- Leip, David. "Dave Leip's Atlas of U.S. Presidential Elections". uselectionatlas.org. Retrieved May 7, 2018.
Further reading
- Commemorative Biographical Record of the Counties of Rock, Green, Grant, Iowa, and Lafayette, Wisconsin, Containing Biographical Sketches of Prominent and Representative Citizens, and of Many of the Early Settled Families. Chicago: J. H. Beers and Co., 1901.
- History of Green County, Wisconsin. Springfield, Ill.: Union Publishing Company, 1884.
External links
- Green County government website
- Green County map from the Wisconsin Department of Transportation
- Green County Sheriff's Office
Places adjacent to Green County, Wisconsin | ||||||||||
|---|---|---|---|---|---|---|---|---|---|---|
| ||||||||||
Municipalities and communities of Green County, Wisconsin, United States | ||
|---|---|---|
| Cities | | |
| Villages | ||
| Towns | ||
| CDP | ||
| Unincorporated communities | ||
| Ghost townsneighborhoods | ||
| Footnotes | ‡This populated place also has portions in an adjacent county or counties | |
| Authority control |
|
|---|