Columbia County, Wisconsin
Columbia County is a county located in the U.S. state of Wisconsin. As of the 2010 census, the population was 56,833.[1] Its county seat and largest city is Portage.[2] The county was created in 1846[3] as part of Wisconsin Territory.
Columbia County | |
|---|---|
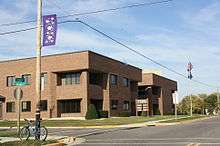
 Columbia County courthouse in December 2014 | |
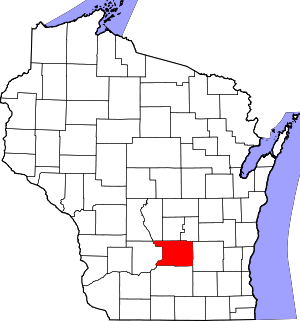 Location within the U.S. state of Wisconsin | |
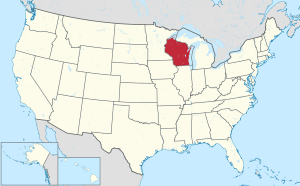 Wisconsin's location within the U.S. | |
| Coordinates: 43°28′N 89°20′W | |
| Country | |
| State | |
| Founded | 1846 |
| Seat | Portage |
| Largest city | Portage |
| Area | |
| • Total | 796 sq mi (2,060 km2) |
| • Land | 766 sq mi (1,980 km2) |
| • Water | 30 sq mi (80 km2) 3.8% |
| Population (2010) | |
| • Total | 56,833 |
| • Estimate (2019) | 57,532 |
| • Density | 71/sq mi (28/km2) |
| Time zone | UTC−6 (Central) |
| • Summer (DST) | UTC−5 (CDT) |
| Congressional district | 6th |
| Website | www |
Columbia County is part of the Madison, WI Metropolitan Statistical Area as well as the Madison-Janesville-Beloit, WI Combined Statistical Area.
Geography
According to the U.S. Census Bureau, the county has a total area of 796 square miles (2,060 km2), of which 766 square miles (1,980 km2) is land and 30 square miles (78 km2) (3.8%) is water.[4] The county's highest point is in the Baraboo Range, near Durward's Glen at 1,480 feet above sea level.[5]
Major highways


Airports
- 94C - Gilbert Field airport serves the county and surrounding communities.
- C47 - Portage Municipal Airport supports the county.
Adjacent counties
- Marquette County – north
- Green Lake County – northeast
- Dodge County – east
- Dane County – south
- Sauk County – west
- Juneau County – northwest
- Adams County – northwest
Demographics
| Historical population | |||
|---|---|---|---|
| Census | Pop. | %± | |
| 1850 | 9,565 | — | |
| 1860 | 24,441 | 155.5% | |
| 1870 | 28,802 | 17.8% | |
| 1880 | 28,065 | −2.6% | |
| 1890 | 28,350 | 1.0% | |
| 1900 | 31,121 | 9.8% | |
| 1910 | 31,129 | 0.0% | |
| 1920 | 30,468 | −2.1% | |
| 1930 | 30,503 | 0.1% | |
| 1940 | 32,517 | 6.6% | |
| 1950 | 34,023 | 4.6% | |
| 1960 | 36,708 | 7.9% | |
| 1970 | 40,150 | 9.4% | |
| 1980 | 43,222 | 7.7% | |
| 1990 | 45,088 | 4.3% | |
| 2000 | 52,468 | 16.4% | |
| 2010 | 56,833 | 8.3% | |
| Est. 2019 | 57,532 | [6] | 1.2% |
| U.S. Decennial Census[7] 1790–1960[8] 1900–1990[9] 1990–2000[10] 2010–2019[1] | |||


As of the census[11] of 2000, there were 52,468 people, 20,439 households, and 14,164 families residing in the county. The population density was 68 people per square mile (26/km²). There were 22,685 housing units at an average density of 29 per square mile (11/km²). The racial makeup of the county was 97.18% White, 0.88% Black or African American, 0.35% Native American, 0.33% Asian, 0.02% Pacific Islander, 0.44% from other races, and 0.79% from two or more races. 1.58% of the population were Hispanic or Latino of any race. 46.4% were of German, 10.2% Norwegian, 7.8% Irish, 6.4% English and 5.0% United States or American ancestry.
There were 20,439 households out of which 32.20% had children under the age of 18 living with them, 58.10% were married couples living together, 7.40% had a female householder with no husband present, and 30.70% were non-families. 25.50% of all households were made up of individuals and 11.00% had someone living alone who was 65 years of age or older. The average household size was 2.49 and the average family size was 2.99.
In the county, the population was spread out with 25.20% under the age of 18, 7.10% from 18 to 24, 29.90% from 25 to 44, 23.40% from 45 to 64, and 14.40% who were 65 years of age or older. The median age was 38 years. For every 100 females, there were 101.60 males. For every 100 females age 18 and over, there were 100.40 males.
In 2017, there were 602 births, giving a general fertility rate of 63.9 births per 1000 women aged 15–44, the 35th highest out of all 72 Wisconsin Counties.[12] Additionally, there were 63 reported induced abortions performed on women of Columbia County residence, with a rate of 6.7 abortions per 1000 women aged 15–44, which is above the Wisconsin average rate of 5.2.[13]
Communities
Cities
- Columbus (partly in Dodge County)
- Lodi
- Portage (county seat)
- Wisconsin Dells (partly in Adams County, Juneau County, and Sauk County)
Villages
Towns
Census-designated places
- Lake Wisconsin (partial)
Unincorporated communities
Ghost town/neighborhood
Politics
For most of its history, Columbia County voters have backed the Republican Party candidate in national elections. Prior to 1992, the only times Republicans failed to win the county in the preceding 100 years of presidential elections were in the midst of a divided party vote in 1912, in 1924 when Wisconsinite Robert La Follette was on the ballot, and in the national Democratic Party landslides of 1932, 1936, & 1964. From 1992 onward, the county has been a Democratic-leaning swing county, voting for the statewide winner in all presidential elections since then except in 2004, and voting for the national winner in all except 2000. Republican Donald Trump won the county in 2016, though a majority of county residents voted for Democrat Tammy Baldwin's re-election to the U.S. Senate two years later in 2018.
| Year | Republican | Democratic | Third parties |
|---|---|---|---|
| 2016 | 47.7% 14,163 | 45.6% 13,528 | 6.8% 2,007 |
| 2012 | 42.6% 13,026 | 56.2% 17,175 | 1.1% 345 |
| 2008 | 41.7% 12,193 | 56.9% 16,661 | 1.4% 418 |
| 2004 | 50.6% 14,956 | 48.4% 14,300 | 1.0% 299 |
| 2000 | 46.9% 11,987 | 49.4% 12,636 | 3.8% 964 |
| 1996 | 38.9% 8,377 | 48.0% 10,336 | 13.1% 2,808 |
| 1992 | 37.9% 9,099 | 39.0% 9,348 | 23.1% 5,537 |
| 1988 | 53.1% 10,475 | 46.3% 9,132 | 0.6% 123 |
| 1984 | 58.5% 11,662 | 40.8% 8,125 | 0.7% 140 |
| 1980 | 49.9% 10,478 | 41.5% 8,715 | 8.6% 1,803 |
| 1976 | 50.6% 10,075 | 47.5% 9,457 | 1.9% 368 |
| 1972 | 58.0% 10,122 | 40.6% 7,083 | 1.4% 242 |
| 1968 | 52.6% 8,633 | 40.8% 6,698 | 6.6% 1,083 |
| 1964 | 38.2% 6,253 | 61.7% 10,093 | 0.2% 24 |
| 1960 | 60.9% 10,282 | 39.0% 6,576 | 0.1% 15 |
| 1956 | 66.0% 10,120 | 33.7% 5,158 | 0.3% 52 |
| 1952 | 67.8% 11,133 | 32.1% 5,272 | 0.1% 20 |
| 1948 | 52.6% 6,406 | 46.1% 5,615 | 1.2% 148 |
| 1944 | 56.5% 7,867 | 43.1% 5,997 | 0.4% 60 |
| 1940 | 53.7% 8,260 | 45.6% 7,021 | 0.7% 106 |
| 1936 | 37.3% 5,607 | 59.4% 8,936 | 3.4% 511 |
| 1932 | 36.4% 4,970 | 62.0% 8,455 | 1.6% 216 |
| 1928 | 60.7% 7,615 | 38.4% 4,819 | 0.9% 111 |
| 1924 | 40.4% 4,724 | 7.8% 907 | 51.8% 6,059 |
| 1920 | 83.3% 7,394 | 13.5% 1,201 | 3.2% 287 |
| 1916 | 57.5% 3,395 | 39.0% 2,299 | 3.5% 208 |
| 1912 | 42.6% 2,463 | 42.7% 2,473 | 14.7% 852 |
| 1908 | 60.1% 4,072 | 34.9% 2,363 | 5.0% 338 |
| 1904 | 67.5% 4,730 | 27.2% 1,907 | 5.2% 367 |
| 1900 | 65.7% 4,763 | 30.1% 2,181 | 4.2% 305 |
| 1896 | 63.6% 4,845 | 31.2% 2,380 | 5.2% 397 |
| 1892 | 49.3% 3,314 | 44.0% 2,957 | 6.8% 457 |
References
- "State & County QuickFacts". United States Census Bureau. Retrieved January 18, 2014.
- "Find a County". National Association of Counties. Archived from the original on May 31, 2011. Retrieved June 7, 2011.
- "Wisconsin: Individual County Chronologies". Wisconsin Atlas of Historical County Boundaries. The Newberry Library. 2007. Retrieved August 13, 2015.
- "2010 Census Gazetteer Files". United States Census Bureau. August 22, 2012. Retrieved August 2, 2015.
- Wisconsin High Points. Wisconsin State Cartographer's Office.
- "Population and Housing Unit Estimates". Retrieved March 26, 2020.
- "U.S. Decennial Census". United States Census Bureau. Retrieved August 2, 2015.
- "Historical Census Browser". University of Virginia Library. Retrieved August 2, 2015.
- Forstall, Richard L., ed. (March 27, 1995). "Population of Counties by Decennial Census: 1900 to 1990". United States Census Bureau. Retrieved August 2, 2015.
- "Census 2000 PHC-T-4. Ranking Tables for Counties: 1990 and 2000" (PDF). United States Census Bureau. April 2, 2001. Retrieved August 2, 2015.
- "U.S. Census website". United States Census Bureau. Retrieved May 14, 2011.
- Annual Wisconsin Birth and Infant Mortality Report, 2017 P-01161-19 (June 2019): Detailed Tables
- Reported Induced Abortions in Wisconsin, Office of Health Informatics, Division of Public Health, Wisconsin Department of Health Services. Section: Trend Information, 2013-2017, Table 18, pages 17-18
- Leip, David. "Dave Leip's Atlas of U.S. Presidential Elections". uselectionatlas.org. Retrieved May 7, 2018.
Further reading
- The History of Columbia County, Wisconsin. Chicago: Western Historical Company, 1880.
- Memorial and Biographical Record and Illustrated Compendium of Biography ... of Columbia, Sauk and Adams counties, Wisconsin.... Chicago: Geo. A. Ogle, 1901.
External links
- Columbia County government website
- Columbia County map from the Wisconsin Department of Transportation
Places adjacent to Columbia County, Wisconsin | ||||||||||
|---|---|---|---|---|---|---|---|---|---|---|
| ||||||||||
Municipalities and communities of Columbia County, Wisconsin, United States | ||
|---|---|---|
| Cities | | |
| Villages | ||
| Towns | ||
| CDP | ||
| Unincorporated communities | ||
| Ghost town/neighborhood | ||
| Footnotes | ‡This populated place also has portions in an adjacent county or counties | |
| Authority control |
|
|---|