Richland County, Wisconsin
Richland County is a county in the U.S. state of Wisconsin. As of the 2010 census, the population was 18,021.[1] Its county seat is Richland Center.[2] The county was created from the Wisconsin Territory in 1842 and organized in 1850.[3] It is named for the high quality of its soil.[4] Some rural areas in the county have their power provided by the Richland Electric Cooperative.[5]
Richland County | |
|---|---|
.jpg) Richland County Courthouse | |
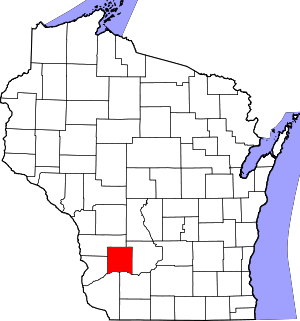 Location within the U.S. state of Wisconsin | |
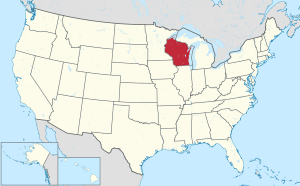 Wisconsin's location within the U.S. | |
| Coordinates: 43°23′N 90°26′W | |
| Country | |
| State | |
| Founded | 1850 |
| Seat | Richland Center |
| Largest city | Richland Center |
| Area | |
| • Total | 589 sq mi (1,530 km2) |
| • Land | 586 sq mi (1,520 km2) |
| • Water | 3.1 sq mi (8 km2) 0.5%% |
| Population (2010) | |
| • Total | 18,021 |
| • Estimate (2018) | 17,377 |
| • Density | 31/sq mi (12/km2) |
| Time zone | UTC−6 (Central) |
| • Summer (DST) | UTC−5 (CDT) |
| Congressional districts | 2nd, 3rd |
| Website | co |
Geography
According to the U.S. Census Bureau, the county has a total area of 589 square miles (1,530 km2), of which 586 square miles (1,520 km2) is land and 3.1 square miles (8.0 km2) (0.5%) is water.[6]
Major highways


Airport
Richland Airport (93C) serves the county and surrounding communities.
Adjacent counties
- Vernon County – north
- Sauk County – east
- Iowa County – southeast
- Grant County – southwest
- Crawford County – west
Demographics
| Historical population | |||
|---|---|---|---|
| Census | Pop. | %± | |
| 1850 | 903 | — | |
| 1860 | 9,732 | 977.7% | |
| 1870 | 15,731 | 61.6% | |
| 1880 | 18,174 | 15.5% | |
| 1890 | 19,121 | 5.2% | |
| 1900 | 19,483 | 1.9% | |
| 1910 | 18,809 | −3.5% | |
| 1920 | 19,823 | 5.4% | |
| 1930 | 19,525 | −1.5% | |
| 1940 | 20,381 | 4.4% | |
| 1950 | 19,245 | −5.6% | |
| 1960 | 17,684 | −8.1% | |
| 1970 | 17,079 | −3.4% | |
| 1980 | 17,476 | 2.3% | |
| 1990 | 17,521 | 0.3% | |
| 2000 | 17,924 | 2.3% | |
| 2010 | 18,021 | 0.5% | |
| Est. 2018 | 17,377 | [7] | −3.6% |
| U.S. Decennial Census[8] 1790–1960[9] 1900–1990[10] 1990–2000[11] 2010–2018[1] | |||


As of the census[12] of 2000, there were 17,924 people, 7,118 households, and 4,833 families residing in the county. The population density was 31 people per square mile (12/km²). There were 8,164 housing units at an average density of 14 per square mile (5/km²). The racial makeup of the county was 98.39% White, 0.15% Black or African American, 0.26% Native American, 0.21% Asian, 0.03% Pacific Islander, 0.28% from other races, and 0.68% from two or more races. 0.93% of the population were Hispanic or Latino of any race. 37.7% were of German, 12.5% Norwegian, 10.3% Irish, 9.5% English and 8.8% American ancestry. 97.1% spoke English, 1.1% German and 1.1% Spanish as their first language.
There were 7,118 households out of which 30.50% had children under the age of 18 living with them, 56.30% were married couples living together, 7.70% had a female householder with no husband present, and 32.10% were non-families. 27.20% of all households were made up of individuals and 13.40% had someone living alone who was 65 years of age or older. The average household size was 2.48 and the average family size was 3.01.
In the county, the population was spread out with 25.20% under the age of 18, 8.40% from 18 to 24, 25.50% from 25 to 44, 23.70% from 45 to 64, and 17.20% who were 65 years of age or older. The median age was 39 years. For every 100 females there were 98.20 males. For every 100 females age 18 and over, there were 94.90 males.
Communities
City
- Richland Center (county seat)
Villages
- Boaz
- Cazenovia (partly in Sauk County)
- Lone Rock
- Viola (partly in Vernon County)
- Yuba
Towns
Census-designated places
Unincorporated communities
- Ash Ridge
- Aubrey
- Balmoral
- Basswood
- Bear Valley
- Bloom City
- Bosstown
- Buck Creek
- Bunker Hill
- Byrds Creek
- Eagle Corners
- Excelsior
- Germantown
- Gillingham
- Hub City
- Ithaca
- Jimtown
- Keyesville
- Loyd
- Neptune
- Nevels Corners
- Rockbridge
- Port Andrew
- Sabin
- Sand Prairie
- Sylvan
- Tavera
- Tunnelville (partial)
- Twin Bluffs
- West Lima
- Westport
- Wild Rose
- Woodstock
Ghost towns/neighborhoods
Politics
| Year | Republican | Democratic | Third parties |
|---|---|---|---|
| 2016 | 49.7% 4,013 | 44.2% 3,569 | 6.0% 487 |
| 2012 | 41.3% 3,573 | 57.4% 4,969 | 1.3% 113 |
| 2008 | 39.0% 3,298 | 59.7% 5,041 | 1.3% 111 |
| 2004 | 51.3% 4,836 | 47.8% 4,501 | 0.9% 83 |
| 2000 | 48.2% 3,994 | 46.3% 3,837 | 5.6% 462 |
| 1996 | 36.6% 2,642 | 48.5% 3,502 | 14.9% 1,078 |
| 1992 | 36.8% 3,144 | 40.5% 3,458 | 22.7% 1,938 |
| 1988 | 52.2% 4,026 | 47.3% 3,643 | 0.5% 39 |
| 1984 | 62.7% 4,858 | 36.7% 2,844 | 0.7% 51 |
| 1980 | 53.6% 4,601 | 39.7% 3,413 | 6.7% 574 |
| 1976 | 54.1% 4,466 | 44.0% 3,634 | 1.8% 151 |
| 1972 | 66.1% 5,062 | 32.6% 2,492 | 1.3% 100 |
| 1968 | 59.8% 4,141 | 33.1% 2,288 | 7.1% 493 |
| 1964 | 42.7% 3,224 | 57.2% 4,315 | 0.1% 9 |
| 1960 | 63.8% 5,253 | 36.0% 2,965 | 0.1% 11 |
| 1956 | 64.3% 5,062 | 35.3% 2,783 | 0.4% 29 |
| 1952 | 74.4% 6,605 | 25.5% 2,260 | 0.1% 10 |
| 1948 | 55.6% 3,836 | 43.3% 2,990 | 1.2% 80 |
| 1944 | 61.9% 5,088 | 37.8% 3,109 | 0.4% 29 |
| 1940 | 60.5% 5,527 | 38.6% 3,524 | 1.0% 88 |
| 1936 | 48.9% 4,245 | 47.0% 4,080 | 4.2% 361 |
| 1932 | 43.8% 3,256 | 54.2% 4,027 | 2.0% 152 |
| 1928 | 70.9% 5,685 | 28.2% 2,262 | 0.9% 75 |
| 1924 | 42.1% 2,669 | 14.2% 898 | 43.7% 2,771 |
| 1920 | 77.0% 3,952 | 17.9% 917 | 5.1% 261 |
| 1916 | 48.6% 2,051 | 43.7% 1,845 | 7.8% 328 |
| 1912 | 41.0% 1,623 | 37.7% 1,493 | 21.3% 842 |
| 1908 | 54.8% 2,464 | 37.6% 1,689 | 7.6% 341 |
| 1904 | 61.5% 2,698 | 30.6% 1,340 | 7.9% 348 |
| 1900 | 59.5% 2,593 | 35.0% 1,524 | 5.5% 240 |
| 1896 | 54.0% 2,636 | 43.0% 2,098 | 3.0% 145 |
| 1892 | 50.0% 2,194 | 38.1% 1,670 | 12.0% 525 |
References
- "State & County QuickFacts". United States Census Bureau. Retrieved January 23, 2014.
- "Find a County". National Association of Counties. Archived from the original on May 31, 2011. Retrieved June 7, 2011.
- "Wisconsin: Individual County Chronologies". Wisconsin Atlas of Historical County Boundaries. The Newberry Library. 2007. Retrieved August 15, 2015.
- "Here's How Iron Got Its Name". The Rhinelander Daily News. June 16, 1932. p. 2. Retrieved August 24, 2014 – via Newspapers.com.

- "Welcome | Richland Electric Cooperative". www.rec.coop. Retrieved August 14, 2018.
- "2010 Census Gazetteer Files". United States Census Bureau. August 22, 2012. Retrieved August 8, 2015.
- "Population and Housing Unit Estimates". Retrieved July 26, 2019.
- "U.S. Decennial Census". United States Census Bureau. Retrieved August 8, 2015.
- "Historical Census Browser". University of Virginia Library. Retrieved August 8, 2015.
- Forstall, Richard L., ed. (March 27, 1995). "Population of Counties by Decennial Census: 1900 to 1990". United States Census Bureau. Retrieved August 8, 2015.
- "Census 2000 PHC-T-4. Ranking Tables for Counties: 1990 and 2000" (PDF). United States Census Bureau. April 2, 2001. Retrieved August 8, 2015.
- "U.S. Census website". United States Census Bureau. Retrieved May 14, 2011.
- Leip, David. "Dave Leip's Atlas of U.S. Presidential Elections". uselectionatlas.org. Retrieved August 14, 2018.
Further reading
- History of Crawford and Richland Counties, Wisconsin. Springfield, Ill.: Union Publishing, 1884.
- Miner, James H. (ed.) History of Richland County, Wisconsin. Madison, Wis.: Western Historical Association, 1906.
External links
- Richland County website
- Richland County map from the Wisconsin Department of Transportation
- Richland County Health and Demographic Data
Places adjacent to Richland County, Wisconsin | ||||||||||
|---|---|---|---|---|---|---|---|---|---|---|
| ||||||||||
Municipalities and communities of Richland County, Wisconsin, United States | ||
|---|---|---|
| City | | |
| Villages | ||
| Towns | ||
| CDPs | ||
| Unincorporated communities |
| |
| Former communities | ||
| Footnotes | ‡This populated place also has portions in an adjacent county or counties | |
| Authority control |
|
|---|