2008 United States presidential election in Ohio
The 2008 United States presidential election in Ohio took place on November 4, 2008, which was part of the 2008 United States presidential election. Voters chose 20 representatives, or electors to the Electoral College, who voted for president and vice president.
| ||||||||||||||||||||||||||
| ||||||||||||||||||||||||||
 County Results
| ||||||||||||||||||||||||||
| ||||||||||||||||||||||||||
| Elections in Ohio | ||||||||||||||||||||
|---|---|---|---|---|---|---|---|---|---|---|---|---|---|---|---|---|---|---|---|---|
.svg.png) | ||||||||||||||||||||
|
||||||||||||||||||||
|
||||||||||||||||||||
|
|
||||||||||||||||||||
|
||||||||||||||||||||
|
|
||||||||||||||||||||
Ohio was won by Democratic nominee Barack Obama with a 4.6% margin of victory. Prior to the election, most news organizations considered this state as a major swing state and bellwether. Both major party candidates visited the Buckeye State numerous times and campaigned throughout the state extensively trying to sway moderates and independent voters to their side. The polls in Ohio were fairly even throughout the campaign but Obama had a slight lead as Election Day drew closer. In the end, Obama flipped Ohio into the Democratic column.
Primaries
- 2008 Ohio Republican primary
- 2008 Ohio Democratic primary
Campaign
Predictions
There were 16 news organizations who made state-by-state predictions of the election. Here are their last predictions before election day:
- D.C. Political Report: Republican[1]
- Cook Political Report: Toss-up[2]
- Takeaway: Toss-up[3]
- Electoral-vote.com: Leaning Democrat[4]
- Washington Post: Leaning Obama[5]
- Politico: Leaning Obama[6]
- Real Clear Politics: Toss-up[7]
- FiveThirtyEight.com: Leaning Obama[5]
- CQ Politics: Leaning Democrat[8]
- New York Times: Toss-up[9]
- CNN: Toss-up[10]
- NPR: Toss-up[5]
- MSNBC: Leaning McCain[5]
- Fox News: Toss-up[11]
- Associated Press: Toss-up[12]
- Rasmussen Reports: Toss-up[13]
Polling
During most of the summer and September, McCain led many state polls and many by 50% of over. Rasmussen had McCain leading with as high as 51% in September.[14] But many voters in the state changed their minds as Obama later gained a steady lead in most polls taken starting in the beginning of October (around the time of the 2008 financial crisis).[15][16]
Fundraising
Obama raised $7,218,801. McCain raised $5,682,839.[17]
Advertising and visits
A major swing state, Obama spent over $28 million to McCain's $24 million.[18] The Republican ticket visited the state 28 times to the Obama ticket's 22 times.[19]
Analysis
Going into Election 2008, both McCain and Obama knew that Ohio was a crucial state. Earlier in the primary season, Ohio had given a major comeback victory to Hillary Rodham Clinton. Both candidates campaigned heavily throughout the state in hopes for winning its 20 electoral votes. As no Republican has ever won the presidency without winning Ohio, it was seen in particular as a "must-win" state for McCain. George W. Bush's narrow wins in 2000 (by 3.50% against Al Gore) and 2004 (2.11% against John Kerry) proved critical in Bush's narrow wins nationally.
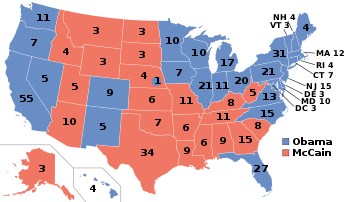
On Election Day 2008, Obama won the Buckeye State's 20 electoral votes by a margin of 4.59%. Obama's win in heavily populated areas such as Cuyahoga County (Cleveland), Franklin County (Columbus), Lucas County (Toledo), Montgomery County (Dayton) and the traditionally Republican Hamilton County (Cincinnati) greatly contributed to his victory in the state.
McCain did best in the Republican base in the center and western regions, composed of relatively rural areas combined with Cincinnati and Columbus' heavily Republican suburbs. In addition, McCain won all but one county in the Appalachian southeast, mirroring the troubles Obama had throughout this region. On the other hand, Obama did best in the Democratic base—Cleveland (where he won almost 70% of the vote), Youngstown and the heavily unionized counties next to Pennsylvania. However, he was unable to significantly improve upon John Kerry's performance in these areas. More surprisingly, the cities of Cincinnati and Columbus gave him strong support. Cincinnati, the only major city that didn't vote for Franklin D. Roosevelt, voted Democratic for the first time since 1964. Columbus, a city shifting to the Democrats, also voted for Obama by a three-to-two margin. In addition, Obama won several northern counties along the shore of Lake Erie that John Kerry had lost in 2004.
As polls closed and results were coming in on Election Night, Republican strategist and adviser Karl Rove joined Brit Hume on Fox News offering analysis. Rove was discussing the impact an Ohio loss would have on McCain's chances of winning the election. "If he loses Ohio," Rove stated of McCain, "he goes from 286, which the Republicans carried in 2004, down to 266, and that puts him below the 270 threshold needed to win the White House. So he'd not only need to sweep the rest of these states which were won by the Republicans in 2004, he'd also need to pick up something as well." In an untimely moment, Hume broke in. "Guess what Karl," Hume interrupted, "I've just received word that the state of Ohio has gone for Barack Obama."[20]
As of the 2016 presidential election, this is the last election in which Lake County, Monroe County, Belmont County, Tuscarawas County, and Jefferson County voted for a Democratic Presidential candidate.[21]
Results
| 2008 United States presidential election in Ohio | ||||||
|---|---|---|---|---|---|---|
| Party | Candidate | Running mate | Votes | Percentage | Electoral votes | |
| Democratic | Barack Obama | Joe Biden | 2,940,044 | 51.50% | 20 | |
| Republican | John McCain | Sarah Palin | 2,677,820 | 46.91% | 0 | |
| Independent | Ralph Nader | Matt Gonzalez | 42,337 | 0.74% | 0 | |
| Libertarian | Bob Barr | Wayne Allyn Root | 19,917 | 0.35% | 0 | |
| Write-ins | Write-ins | 13,682 | 0.24% | 0 | ||
| Constitution | Chuck Baldwin | Darrell Castle | 12,565 | 0.22% | 0 | |
| Green | Cynthia McKinney | Rosa Clemente | 8,518 | 0.15% | 0 | |
| Others | Others | 6,843 | 0.12% | 0 | ||
| Totals | 5,721,726 | 100.00% | 20 | |||
| Voter turnout (Voting age population) | 67.3% | |||||
Results by county
| County | Barack Hussein Obama Democratic |
John Sidney McCain III Republican |
Ralph Nader[22] Independent |
Various candidates Other parties |
Margin | Total | |||||
|---|---|---|---|---|---|---|---|---|---|---|---|
| # | % | # | % | # | % | # | % | # | % | ||
| Adams | 4,170 | 36.62% | 6,914 | 60.71% | 131 | 1.15% | 173 | 1.52% | -2,744 | -24.10% | 11,388 |
| Allen | 19,521 | 38.84% | 29,941 | 59.57% | 362 | 0.72% | 439 | 0.87% | -10,420 | -20.73% | 50,263 |
| Ashland | 9,300 | 36.95% | 15,158 | 60.23% | 225 | 0.89% | 485 | 1.93% | -5,858 | -23.28% | 25,168 |
| Ashtabula | 25,027 | 55.77% | 18,949 | 42.23% | 456 | 1.02% | 442 | 0.98% | 6,078 | 13.54% | 44,874 |
| Athens | 20,722 | 66.63% | 9,742 | 31.33% | 263 | 0.85% | 371 | 1.19% | 10,980 | 35.31% | 31,098 |
| Auglaize | 6,727 | 28.64% | 16,395 | 69.81% | 169 | 0.72% | 195 | 0.83% | -9,668 | -41.16% | 23,486 |
| Belmont | 16,302 | 50.30% | 15,422 | 47.58% | 402 | 1.24% | 285 | 0.88% | 880 | 2.72% | 32,411 |
| Brown | 7,503 | 37.30% | 12,192 | 60.62% | 220 | 1.09% | 198 | 0.98% | -4,689 | -23.31% | 20,113 |
| Butler | 66,030 | 38.00% | 105,340 | 60.62% | 1,039 | 0.60% | 1,367 | 0.79% | -39,310 | -22.62% | 173,776 |
| Carroll | 6,423 | 46.03% | 7,097 | 50.86% | 213 | 1.53% | 220 | 1.58% | -674 | -4.83% | 13,953 |
| Champaign | 7,385 | 39.10% | 11,141 | 58.99% | 196 | 1.04% | 165 | 0.87% | -3,756 | -19.89% | 18,887 |
| Clark | 31,958 | 47.86% | 33,634 | 50.37% | 661 | 0.99% | 517 | 0.77% | -1,676 | -2.51% | 66,770 |
| Clermont | 31,611 | 33.11% | 62,559 | 65.52% | 599 | 0.63% | 711 | 0.74% | -30,948 | -32.41% | 95,480 |
| Clinton | 6,558 | 33.97% | 12,410 | 64.28% | 197 | 1.02% | 141 | 0.73% | -5,852 | -30.31% | 19,306 |
| Columbiana | 21,882 | 45.13% | 25,585 | 52.77% | 545 | 1.12% | 475 | 0.98% | -3,703 | -7.64% | 48,487 |
| Coshocton | 7,689 | 45.60% | 8,675 | 51.44% | 221 | 1.31% | 278 | 1.65% | -986 | -5.85% | 16,863 |
| Crawford | 8,288 | 39.14% | 12,316 | 58.17% | 242 | 1.14% | 327 | 1.54% | -4,028 | -19.02% | 21,173 |
| Cuyahoga | 458,204 | 68.89% | 199,864 | 30.05% | 3,616 | 0.54% | 3,433 | 0.52% | 258,340 | 38.84% | 665,117 |
| Darke | 7,964 | 30.88% | 17,290 | 67.03% | 273 | 1.06% | 266 | 1.03% | -9,326 | -36.16% | 25,793 |
| Defiance | 8,399 | 43.75% | 10,407 | 54.21% | 154 | 0.80% | 237 | 1.23% | -2,008 | -10.46% | 19,197 |
| Delaware | 36,653 | 39.66% | 54,778 | 59.27% | 359 | 0.39% | 629 | 0.68% | -18,125 | -19.61% | 92,419 |
| Erie | 23,148 | 56.14% | 17,432 | 42.28% | 349 | 0.85% | 300 | 0.73% | 5,716 | 13.86% | 41,229 |
| Fairfield | 29,250 | 40.66% | 41,580 | 57.79% | 493 | 0.69% | 623 | 0.87% | -12,330 | -17.14% | 71,946 |
| Fayette | 4,401 | 37.63% | 7,102 | 60.73% | 103 | 0.88% | 88 | 0.75% | -2,701 | -23.10% | 11,694 |
| Franklin | 334,684 | 59.73% | 218,478 | 38.99% | 2,993 | 0.53% | 4,136 | 0.74% | 116,206 | 20.74% | 560,291 |
| Fulton | 9,900 | 45.06% | 11,689 | 53.20% | 167 | 0.76% | 217 | 0.99% | -1,789 | -8.14% | 21,973 |
| Gallia | 4,777 | 35.87% | 8,247 | 61.92% | 132 | 0.99% | 162 | 1.22% | -3,470 | -26.05% | 13,318 |
| Geauga | 21,250 | 41.58% | 29,096 | 56.94% | 379 | 0.74% | 377 | 0.74% | -7,846 | -15.35% | 51,102 |
| Greene | 33,540 | 40.12% | 48,936 | 58.54% | 510 | 0.61% | 603 | 0.72% | -15,396 | -18.42% | 83,589 |
| Guernsey | 7,625 | 44.01% | 9,197 | 53.09% | 228 | 1.32% | 275 | 1.59% | -1,572 | -9.07% | 17,325 |
| Hamilton | 224,644 | 52.97% | 195,107 | 46.01% | 1,903 | 0.45% | 2,431 | 0.57% | 29,537 | 6.96% | 424,085 |
| Hancock | 13,870 | 37.61% | 22,420 | 60.79% | 309 | 0.84% | 282 | 0.76% | -8,550 | -23.18% | 36,881 |
| Hardin | 5,013 | 38.23% | 7,749 | 59.09% | 139 | 1.06% | 213 | 1.62% | -2,736 | -20.86% | 13,114 |
| Harrison | 3,683 | 47.30% | 3,872 | 49.72% | 104 | 1.34% | 128 | 1.64% | -189 | -2.43% | 7,787 |
| Henry | 6,320 | 42.59% | 8,239 | 55.52% | 115 | 0.77% | 166 | 1.12% | -1,919 | -12.93% | 14,840 |
| Highland | 6,857 | 35.74% | 11,908 | 62.06% | 204 | 1.06% | 219 | 1.14% | -5,051 | -26.32% | 19,188 |
| Hocking | 6,231 | 48.32% | 6,326 | 49.06% | 154 | 1.19% | 184 | 1.43% | -95 | -0.74% | 12,895 |
| Holmes | 3,141 | 28.26% | 7,720 | 69.47% | 113 | 1.02% | 139 | 1.25% | -4,579 | -41.20% | 11,113 |
| Huron | 12,076 | 47.21% | 12,884 | 50.36% | 212 | 0.83% | 410 | 1.60% | -808 | -3.16% | 25,582 |
| Jackson | 5,397 | 38.57% | 8,219 | 58.74% | 179 | 1.28% | 198 | 1.41% | -2,822 | -20.17% | 13,993 |
| Jefferson | 17,635 | 49.07% | 17,559 | 48.86% | 395 | 1.10% | 350 | 0.97% | 76 | 0.21% | 35,939 |
| Knox | 11,014 | 39.01% | 16,640 | 58.94% | 233 | 0.83% | 344 | 1.22% | -5,626 | -19.93% | 28,231 |
| Lake | 60,155 | 49.58% | 59,142 | 48.74% | 1,086 | 0.90% | 952 | 0.78% | 1,013 | 0.83% | 121,335 |
| Lawrence | 11,262 | 41.41% | 15,415 | 56.69% | 282 | 1.04% | 235 | 0.86% | -4,153 | -15.27% | 27,194 |
| Licking | 33,896 | 41.19% | 46,886 | 56.98% | 685 | 0.83% | 816 | 0.99% | -12,990 | -15.79% | 82,283 |
| Logan | 7,936 | 35.72% | 13,848 | 62.33% | 208 | 0.94% | 225 | 1.01% | -5,912 | -26.61% | 22,217 |
| Lorain | 85,276 | 58.07% | 59,068 | 40.22% | 1,273 | 0.87% | 1,242 | 0.85% | 26,208 | 17.85% | 146,859 |
| Lucas | 142,852 | 64.98% | 73,706 | 33.53% | 1,488 | 0.68% | 1,785 | 0.81% | 69,146 | 31.45% | 219,831 |
| Madison | 6,532 | 37.43% | 10,603 | 60.76% | 142 | 0.81% | 174 | 1.00% | -4,071 | -23.33% | 17,451 |
| Mahoning | 79,173 | 62.24% | 45,319 | 35.63% | 1,300 | 1.02% | 1,411 | 1.11% | 33,854 | 26.61% | 127,203 |
| Marion | 12,870 | 44.35% | 15,454 | 53.26% | 301 | 1.04% | 392 | 1.35% | -2,584 | -8.91% | 29,017 |
| Medina | 40,924 | 45.24% | 48,189 | 53.28% | 638 | 0.71% | 700 | 0.77% | -7,265 | -8.03% | 90,451 |
| Meigs | 4,094 | 39.54% | 6,015 | 58.09% | 111 | 1.07% | 134 | 1.29% | -1,921 | -18.55% | 10,354 |
| Mercer | 5,853 | 27.52% | 15,100 | 70.99% | 127 | 0.60% | 191 | 0.90% | -9,247 | -43.47% | 21,271 |
| Miami | 18,372 | 34.79% | 33,417 | 63.28% | 426 | 0.81% | 592 | 1.12% | -15,045 | -28.49% | 52,807 |
| Monroe | 3,705 | 53.07% | 3,066 | 43.91% | 116 | 1.66% | 95 | 1.36% | 639 | 9.15% | 6,982 |
| Montgomery | 145,997 | 52.48% | 128,679 | 46.25% | 1,734 | 0.62% | 1,801 | 0.65% | 17,318 | 6.22% | 278,211 |
| Morgan | 2,966 | 44.88% | 3,440 | 52.06% | 106 | 1.60% | 96 | 1.45% | -474 | -7.17% | 6,608 |
| Morrow | 6,177 | 37.11% | 10,067 | 60.49% | 179 | 1.08% | 220 | 1.32% | -3,890 | -23.37% | 16,643 |
| Muskingum | 17,730 | 45.38% | 20,549 | 52.59% | 364 | 0.93% | 428 | 1.10% | -2,819 | -7.22% | 39,071 |
| Noble | 2,474 | 40.08% | 3,450 | 55.90% | 141 | 2.28% | 107 | 1.73% | -976 | -15.81% | 6,172 |
| Ottawa | 12,049 | 52.23% | 10,618 | 46.03% | 194 | 0.84% | 208 | 0.90% | 1,431 | 6.20% | 23,069 |
| Paulding | 4,165 | 42.63% | 5,317 | 54.43% | 127 | 1.30% | 160 | 1.64% | -1,152 | -11.79% | 9,769 |
| Perry | 7,261 | 47.14% | 7,721 | 50.12% | 206 | 1.34% | 216 | 1.40% | -460 | -2.99% | 15,404 |
| Pickaway | 9,077 | 38.26% | 14,228 | 59.97% | 210 | 0.89% | 211 | 0.89% | -5,151 | -21.71% | 23,726 |
| Pike | 6,033 | 48.24% | 6,162 | 49.27% | 143 | 1.14% | 168 | 1.34% | -129 | -1.03% | 12,506 |
| Portage | 41,856 | 53.52% | 34,822 | 44.53% | 664 | 0.85% | 864 | 1.10% | 7,034 | 8.99% | 78,206 |
| Preble | 6,999 | 33.33% | 13,562 | 64.57% | 227 | 1.08% | 214 | 1.02% | -6,563 | -31.25% | 21,002 |
| Putnam | 5,281 | 28.27% | 13,072 | 69.98% | 163 | 0.87% | 164 | 0.88% | -7,791 | -41.71% | 18,680 |
| Richland | 25,727 | 42.09% | 34,034 | 55.68% | 579 | 0.95% | 782 | 1.28% | -8,307 | -13.59% | 61,122 |
| Ross | 14,455 | 45.40% | 16,759 | 52.64% | 289 | 0.91% | 337 | 1.06% | -2,304 | -7.24% | 31,840 |
| Sandusky | 15,601 | 51.36% | 14,190 | 46.72% | 300 | 0.99% | 282 | 0.93% | 1,411 | 4.65% | 30,373 |
| Scioto | 14,926 | 45.83% | 16,994 | 52.18% | 348 | 1.07% | 303 | 0.93% | -2,068 | -6.35% | 32,571 |
| Seneca | 13,087 | 47.68% | 13,823 | 50.36% | 289 | 1.05% | 250 | 0.91% | -736 | -2.68% | 27,449 |
| Shelby | 7,317 | 30.92% | 15,924 | 67.28% | 230 | 0.97% | 197 | 0.83% | -8,607 | -36.37% | 23,668 |
| Stark | 96,990 | 51.72% | 86,743 | 46.25% | 1,784 | 0.95% | 2,028 | 1.08% | 10,247 | 5.46% | 187,545 |
| Summit | 155,105 | 57.65% | 110,499 | 41.07% | 1,758 | 0.65% | 1,697 | 0.63% | 44,606 | 16.58% | 269,059 |
| Trumbull | 64,145 | 60.00% | 40,164 | 37.57% | 1,285 | 1.20% | 1,317 | 1.23% | 23,981 | 22.43% | 106,911 |
| Tuscarawas | 21,498 | 50.05% | 20,454 | 47.62% | 465 | 1.08% | 533 | 1.24% | 1,044 | 2.43% | 42,950 |
| Union | 8,761 | 35.15% | 15,744 | 63.16% | 173 | 0.69% | 250 | 1.00% | -6,983 | -28.01% | 24,928 |
| Van Wert | 5,178 | 35.34% | 9,168 | 62.57% | 139 | 0.95% | 167 | 1.14% | -3,990 | -27.23% | 14,652 |
| Vinton | 2,463 | 43.62% | 3,021 | 53.51% | 94 | 1.66% | 68 | 1.20% | -558 | -9.88% | 5,646 |
| Warren | 33,398 | 31.44% | 71,691 | 67.50% | 488 | 0.46% | 639 | 0.60% | -38,293 | -36.05% | 106,216 |
| Washington | 12,368 | 41.32% | 17,019 | 56.86% | 285 | 0.95% | 260 | 0.87% | -4,651 | -15.54% | 29,932 |
| Wayne | 21,712 | 41.64% | 29,342 | 56.27% | 433 | 0.83% | 655 | 1.26% | -7,630 | -14.63% | 52,142 |
| Williams | 8,174 | 44.43% | 9,880 | 53.70% | 153 | 0.83% | 190 | 1.03% | -1,706 | -9.27% | 18,397 |
| Wood | 34,285 | 52.73% | 29,648 | 45.60% | 513 | 0.79% | 577 | 0.89% | 4,637 | 7.13% | 65,023 |
| Wyandot | 4,461 | 40.64% | 6,270 | 57.12% | 134 | 1.22% | 112 | 1.02% | -1,809 | -16.48% | 10,977 |
| Totals | 2,933,388 | 51.48% | 2,674,491 | 46.94% | 42,337 | 0.74% | 47,644 | 0.84% | 258,897 | 4.54% | 5,697,860 |
Projections based on published official or unofficial county election board results,[23] where available; otherwise, on the unofficial state board of elections results.[24]
By congressional district
Although Barack Obama won the state of Ohio, John McCain carried ten of the state’s eighteen congressional districts, including two districts held by Democratic incumbents and one district that simultaneously elected a Democrat. Obama carried 8 districts, including one district held by a Republican incumbent.
| District | Obama | McCain | Representative |
|---|---|---|---|
| 1st | 54.66% | 44.30% | Steve Chabot (110th Congress) |
| Steve Driehaus (111th Congress) | |||
| 2nd | 40.02% | 58.61% | Jean Schmidt |
| 3rd | 47.39% | 51.14% | Mike Turner |
| 4th | 38.16% | 59.84% | Jim Jordan |
| 5th | 45.05% | 52.95% | Paul E. Gillmor (110th Congress) |
| Bob Latta (111th Congress) | |||
| 6th | 47.60% | 50.30% | Charlie Wilson |
| 7th | 44.57% | 53.80% | Dave Hobson (110th Congress) |
| Steve Austria (111th Congress) | |||
| 8th | 37.87% | 60.38% | John Boehner |
| 9th | 62.26% | 36.17% | Marcy Kaptur |
| 10th | 59.16% | 38.98% | Dennis Kucinich |
| 11th | 84.76% | 14.39% | Stephanie Tubbs Jones (110th Congress) |
| Marcia Fudge (111th Congress) | |||
| 12th | 54.15% | 44.62% | Pat Tiberi |
| 13th | 54.15% | 44.62% | Betty Sutton |
| 14th | 49.13% | 49.35% | Steven LaTourette |
| 15th | 53.61% | 44.64% | Deborah Pryce (110th Congress) |
| Mary Jo Kilroy (111th Congress) | |||
| 16th | 47.69% | 50.32% | Ralph Regula (110th Congress) |
| John Boccieri (111th Congress) | |||
| 17th | 61.84% | 36.09% | Tim Ryan |
| 18th | 44.79% | 52.81% | Zack Space |
Electors
Technically the voters of Ohio cast their ballots for electors: representatives to the Electoral College. Ohio is allocated 20 electors because it has 18 congressional districts and 2 senators. All candidates who appear on the ballot or qualify to receive write-in votes must submit a list of 20 electors, who pledge to vote for their candidate and his or her running mate. Whoever wins the majority of votes in the state is awarded all 20 electoral votes. Their chosen electors then vote for president and vice president. Although electors are pledged to their candidate and running mate, they are not obligated to vote for them.[25] An elector who votes for someone other than his or her candidate is known as a faithless elector.
The electors of each state and the District of Columbia met on December 15, 2008, to cast their votes for president and vice president. The Electoral College itself never meets as one body. Instead the electors from each state and the District of Columbia met in their respective capitols.
The following were the members of the Electoral College from the state. All 20 were pledged to Barack Obama and Joe Biden:[26]
- Catherine Barrett
- Barbara Tuckerman
- Wade Kapszukiewicz
- Tamela Lee
- Renee Cafaro
- Victoria Wulsin
- Craig Brown
- Jimmy Cotner
- Janet Carson
- Bruce Johnson
- Nannette Whaley
- Martha Jane Brooks
- Eugene Miller
- Fran Alberty
- Chris Redfern
- John Kosty
- Kelly Gillis
- Charleta Tavares
- Michael Todd
- Ted Strickland
References
- "D.C.'s Political Report: The complete source for campaign summaries". Archived from the original on 2009-01-01. Retrieved 2009-12-25.
- Presidential | The Cook Political Report Archived May 5, 2015, at the Wayback Machine
- Adnaan (2008-09-20). "Track the Electoral College vote predictions". The Takeaway. Archived from the original on April 22, 2009. Retrieved 2009-11-14.
- Electoral-vote.com: President, Senate, House Updated Daily
- Based on Takeaway
- POLITICO's 2008 Swing State Map - POLITICO.com
- RealClearPolitics - Electoral Map
- CQ Politics | CQ Presidential Election Maps, 2008 Archived October 29, 2008, at the Wayback Machine
- "Electoral College Map". The New York Times. Retrieved 2010-05-26.
- "October – 2008 – CNN Political Ticker - CNN.com Blogs". CNN. Retrieved 2010-05-26.
- "Winning the Electoral College". Fox News. 2010-04-27.
- roadto270
- Election 2008: Electoral College Update - Rasmussen Reports™
- "Archived copy". Archived from the original on 2009-03-14. Retrieved 2009-06-28.CS1 maint: archived copy as title (link)
- "RealClearPolitics - Election 2008 - Ohio". Retrieved 2008-11-28.
- Election 2008 Polls - Dave Leip's Atlas of U.S. Presidential Elections
- "Presidential Campaign Finance". Archived from the original on 2009-03-24. Retrieved 2009-08-18.
- "Map: Campaign Ad Spending - Election Center 2008 from CNN.com". CNN. Retrieved 2010-05-26.
- "Map: Campaign Candidate Visits - Election Center 2008 from CNN.com". CNN. Retrieved 2010-05-26.
- Danny Shea (4 November 2008). "Fox News Calls Ohio For Obama As Rove Says McCain Needs Ohio To Win". Huffington Post.
- Sullivan, Robert David; ‘How the Red and Blue Map Evolved Over the Past Century’; America Magazine in The National Catholic Review; June 29, 2016
- "OH US President November 04, 2008". Our Campaigns.
- "County Boards of Elections Directory". Archived from the original on 26 November 2008. Retrieved 28 November 2008.
- "President / Vice-President : Unofficial Results". Archived from the original on 11 May 2009. Retrieved 28 November 2008.
- "Electoral College". California Secretary of State. Archived from the original on October 30, 2008. Retrieved 2008-11-01.
- U. S. Electoral College 2008 Election - Certificates