2008 United States presidential election in Arkansas
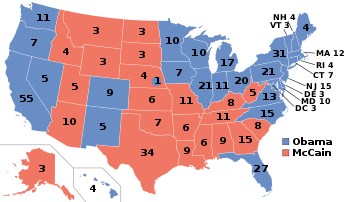
The 2008 United States presidential election in Arkansas took place on November 4, 2008, and was part of the 2008 United States presidential election. Voters chose 6 representatives, or electors to the Electoral College, who voted for president and vice president.
| ||||||||||||||||||||||||||
| ||||||||||||||||||||||||||
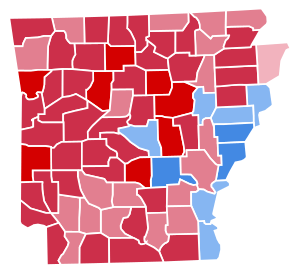 County Results
| ||||||||||||||||||||||||||
| ||||||||||||||||||||||||||
| Elections in Arkansas | ||||||||||
|---|---|---|---|---|---|---|---|---|---|---|
 | ||||||||||
|
||||||||||
|
||||||||||
Arkansas was won by Republican John McCain by a 19.9% margin of victory, an even greater margin than George W. Bush did in 2004, despite the national Democratic trend. Prior to the election, all 17 news organizations considered this a state McCain would win, or otherwise considered as a safe red state. The state trended dramatically Republican in 2008, as McCain performed over 4% better than Bush did in 2004, more than any other state. Only five counties swung more Democratic in 2008, and the vast majority of counties swung heavily Republican (some by as much as a 30% swing toward the Republicans).[1] Of the 10 counties with the largest % swing to the Republicans in 2008, 6 of them, a majority, were in Arkansas.[2] Barack Obama became the first Democrat to win the White House without carrying Arkansas. Arkansas was one of the six states where neither Obama nor McCain won during the primary season.
Socialism and Liberation candidate, Gloria La Riva, had the notable achievement of winning the precinct of Murray in Newton County, ahead of major party candidates Barack Obama and John McCain.[3]
Primaries
Arkansas swung and trended more Republican than any other state in the nation during the election
- Arkansas Democratic primary, 2008
- Arkansas Republican primary, 2008
Campaign
Predictions
There were 16 news organizations who made state-by-state predictions of the election. Here are their last predictions before election day:
- D.C. Political Report: Republican[4]
- Cook Political Report: Solid Republican[5]
- Takeaway: Leaning McCain[6]
- Electoral-vote.com: Leaning Republican[7]
- Washington Post: Leaning McCain[8]
- Politico: Solid McCain[9]
- Real Clear Politics: Leaning McCain[10]
- FiveThirtyEight.com: Solid McCain[8]
- CQ Politics: Safe Republican[11]
- New York Times: Solid Republican[12]
- CNN: Leaning Republican[13]
- NPR: Solid McCain[8]
- MSNBC: Solid McCain[8]
- Fox News: Republican[14]
- Associated Press: Republican[15]
- Rasmussen Reports: Safe Republican[16]
Polling
John McCain won every single opinion poll taken in Arkansas prior to the election. Although, McCain polled just in the low 50% range.[17] RealClearPolitics gave the state an average of 52.3% for McCain, compared to 38.8% for Obama. The margin of victory on election day was more than double of the RCP average.[18] The state was not seriously contested by either campaign.
Fundraising
Obama raised $1,004,783. McCain raised $934,884. Both candidates raised the most in Pulaski County.[19][20]
Analysis
Although former President Bill Clinton, a Democrat, easily carried his home state of Arkansas in 1992 and 1996, the state was largely considered a safe state for McCain. Early polls gave McCain a double-digit lead among possible voters on Election Day.[23] Although the state was still strongly Democratic at the state and local levels, on Election Day, Arkansas voted for McCain by a margin of approximately 20%--ten points better than Bush's showing four years earlier. A possible factor for such the large swing away from the Democrats could have been the fact that Hillary Clinton, who once served as First Lady of Arkansas while her husband was Governor, did not receive the Democratic presidential nomination in 2008. The polls showed Clinton defeating McCain in Arkansas. Obama became the first Democrat in history to win the White House without carrying Arkansas.
During the same election, however, freshman Democratic U.S. Senator Mark Pryor faced no Republican opposition, and was reelected in a landslide victory over Rebekah Kennedy of the Green Party. The four members of the state's delegation to the U.S. House of Representatives (three Democrats and one Republican) were also reelected with no major-party opposition. Republicans, however, picked up three seats in the Arkansas House of Representatives and one Democratic state representative became a Green (he later returned to the Democratic Party in 2009).
Results
| United States presidential election in Arkansas, 2008[24] | ||||||
|---|---|---|---|---|---|---|
| Party | Candidate | Running mate | Votes | Percentage | Electoral votes | |
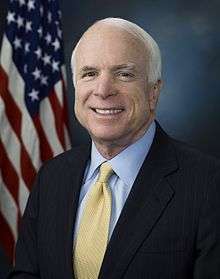
| Republican | John McCain | Sarah Palin | 638,017 | 58.72% | 6 | |
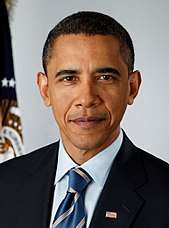
| Democratic | Barack Obama | Joe Biden | 422,310 | 38.86% | 0 | |
| Independent | Ralph Nader | Matt Gonzalez | 12,882 | 1.19% | 0 | |
| Libertarian | Bob Barr | Wayne Allyn Root | 4,776 | 0.44% | 0 | |
| Constitution | Chuck Baldwin | Darrell Castle | 4,023 | 0.37% | 0 | |
| Green | Cynthia McKinney | Rosa Clemente | 3,470 | 0.32% | 0 | |
| Socialism and Liberation | Gloria La Riva | Eugene Puryear | 1,139 | 0.10% | 0 | |
| Totals | 1,086,617 | 100.00% | 6 | |||
| Voter turnout | 64.52% | |||||
By congressional district
McCain swept every congressional district in Arkansas, three of which were held by Democrats.
| District | McCain | Obama | Representative |
|---|---|---|---|
| 1st | 58.69% | 38.41% | Marion Berry |
| 2nd | 53.98% | 44.07% | Vic Snyder |
| 3rd | 64.16% | 33.45% | John Boozman |
| 4th | 58.14% | 39.33% | Michael Avery Ross |
By county
| County | Obama% | Obama# | McCain% | McCain# | Others% | Others# | Total |
|---|---|---|---|---|---|---|---|
| Arkansas | 37.53% | 2,619 | 59.97% | 4,185 | 2.49% | 174 | 6,978 |
| Ashley | 34.44% | 2,976 | 62.55% | 5,406 | 3.01% | 260 | 8,642 |
| Baxter | 32.73% | 6,539 | 64.32% | 12,852 | 2.95% | 590 | 19,981 |
| Benton | 30.67% | 23,331 | 67.20% | 51,124 | 2.13% | 1,618 | 76,073 |
| Boone | 28.66% | 4,435 | 68.34% | 10,575 | 3.% | 464 | 15,474 |
| Bradley | 41.57% | 1,680 | 55.98% | 2,262 | 2.45% | 99 | 4,041 |
| Calhoun | 31.17% | 691 | 65.94% | 1,462 | 2.89% | 64 | 2,217 |
| Carroll | 39.44% | 4,172 | 57.50% | 6,083 | 3.06% | 324 | 10,579 |
| Chicot | 58.43% | 3,043 | 40.69% | 2,119 | .88% | 46 | 5,208 |
| Clark | 46.92% | 4,267 | 50.67% | 4,608 | 2.41% | 219 | 9,094 |
| Clay | 40.72% | 2,244 | 55.02% | 3,032 | 4.26% | 235 | 5,511 |
| Cleburne | 26.03% | 2,951 | 70.22% | 7,962 | 3.75% | 425 | 11,338 |
| Cleveland | 25.99% | 911 | 69.93% | 2,451 | 4.08% | 143 | 3,505 |
| Columbia | 37.18% | 3,554 | 61.32% | 5,861 | 1.5% | 143 | 9,558 |
| Conway | 38.70% | 3,149 | 57.64% | 4,691 | 3.66% | 298 | 8,138 |
| Craighead | 36.47% | 11,294 | 60.97% | 18,881 | 2.56% | 793 | 30,968 |
| Crawford | 25.51% | 5,238 | 71.54% | 14,688 | 2.95% | 606 | 20,532 |
| Crittenden | 56.59% | 10,330 | 41.91% | 7,650 | 1.51% | 275 | 18,255 |
| Cross | 36.19% | 2,580 | 61.61% | 4,393 | 2.2% | 157 | 7,130 |
| Dallas | 44.33% | 1,471 | 52.95% | 1,757 | 2.71% | 90 | 3,318 |
| Desha | 54.92% | 2,569 | 42.73% | 1,999 | 2.35% | 110 | 4,678 |
| Drew | 39.30% | 2,598 | 58.40% | 3,860 | 2.3% | 152 | 6,610 |
| Faulkner | 36.32% | 14,955 | 61.59% | 25,362 | 2.09% | 862 | 41,179 |
| Franklin | 28.86% | 1,869 | 68.12% | 4,411 | 3.01% | 195 | 6,475 |
| Fulton | 38.90% | 1,819 | 57.78% | 2,702 | 3.31% | 155 | 4,676 |
| Garland | 36.37% | 15,899 | 61.36% | 26,825 | 2.28% | 995 | 43,719 |
| Grant | 22.99% | 1,562 | 73.94% | 5,023 | 3.06% | 208 | 6,793 |
| Greene | 33.36% | 4,541 | 63.02% | 8,578 | 3.62% | 493 | 13,612 |
| Hempstead | 39.04% | 2,869 | 58.14% | 4,273 | 2.82% | 207 | 7,349 |
| Hot Spring | 35.87% | 4,288 | 60.30% | 7,209 | 3.83% | 458 | 11,955 |
| Howard | 36.03% | 1,746 | 61.02% | 2,957 | 2.95% | 143 | 4,846 |
| Independence | 29.99% | 3,688 | 67.12% | 8,255 | 2.89% | 356 | 12,299 |
| Izard | 34.34% | 1,792 | 61.19% | 3,193 | 4.47% | 233 | 5,218 |
| Jackson | 39.54% | 2,207 | 55.86% | 3,118 | 4.6% | 257 | 5,582 |
| Jefferson | 62.19% | 18,465 | 35.89% | 10,655 | 1.92% | 569 | 29,689 |
| Johnson | 37.09% | 3,034 | 60.17% | 4,922 | 2.74% | 224 | 8,180 |
| Lafayette | 39.04% | 1,133 | 58.06% | 1,685 | 2.89% | 84 | 2,902 |
| Lawrence | 36.67% | 2,138 | 57.58% | 3,357 | 5.75% | 335 | 5,830 |
| Lee | 60.14% | 2,263 | 38.64% | 1,454 | 1.22% | 46 | 3,763 |
| Lincoln | 38.81% | 1,710 | 57.04% | 2,513 | 4.15% | 183 | 4,406 |
| Little River | 34.03% | 1,753 | 63.02% | 3,247 | 2.95% | 152 | 5,152 |
| Logan | 28.91% | 2,286 | 67.66% | 5,350 | 3.43% | 271 | 7,907 |
| Lonoke | 25.14% | 5,968 | 72.63% | 17,242 | 2.24% | 531 | 23,741 |
| Madison | 33.88% | 2,144 | 62.77% | 3,972 | 3.35% | 212 | 6,328 |
| Marion | 33.29% | 2,384 | 63.17% | 4,524 | 3.55% | 254 | 7,162 |
| Miller | 32.32% | 4,869 | 65.81% | 9,913 | 1.87% | 281 | 15,063 |
| Mississippi | 47.59% | 6,667 | 49.79% | 6,976 | 2.62% | 367 | 14,010 |
| Monroe | 46.83% | 1,615 | 50.86% | 1,754 | 2.32% | 80 | 3,449 |
| Montgomery | 30.15% | 1,092 | 65.30% | 2,365 | 4.56% | 165 | 3,622 |
| Nevada | 40.55% | 1,474 | 56.73% | 2,062 | 2.72% | 99 | 3,635 |
| Newton | 29.85% | 1,182 | 65.35% | 2,588 | 4.8% | 190 | 3,960 |
| Ouachita | 43.63% | 4,346 | 54.49% | 5,427 | 1.88% | 187 | 9,960 |
| Perry | 31.60% | 1,352 | 64.10% | 2,743 | 4.3% | 184 | 4,279 |
| Phillips | 63.50% | 5,695 | 34.53% | 3,097 | 1.97% | 177 | 8,969 |
| Pike | 27.46% | 1,089 | 68.76% | 2,727 | 3.78% | 150 | 3,966 |
| Poinsett | 34.59% | 2,742 | 61.84% | 4,903 | 3.57% | 283 | 7,928 |
| Polk | 25.48% | 1,957 | 71.25% | 5,473 | 3.27% | 251 | 7,681 |
| Pope | 27.18% | 6,002 | 70.51% | 15,568 | 2.31% | 509 | 22,079 |
| Prairie | 31.00% | 1,048 | 65.75% | 2,223 | 3.25% | 110 | 3,381 |
| Pulaski | 55.07% | 88,854 | 43.52% | 70,212 | 1.41% | 2,277 | 161,343 |
| Randolph | 39.07% | 2,469 | 57.21% | 3,615 | 3.72% | 235 | 6,319 |
| Saline | 28.43% | 12,695 | 69.38% | 30,981 | 2.19% | 977 | 44,653 |
| Scott | 26.36% | 1,053 | 69.86% | 2,791 | 3.78% | 151 | 3,995 |
| Searcy | 24.98% | 961 | 70.86% | 2,726 | 4.16% | 160 | 3,847 |
| Sebastian | 31.64% | 13,673 | 66.27% | 28,637 | 2.09% | 902 | 43,212 |
| Sevier | 28.19% | 1,291 | 68.23% | 3,125 | 3.58% | 164 | 4,580 |
| Sharp | 33.59% | 2,436 | 62.53% | 4,535 | 3.87% | 281 | 7,252 |
| St. Francis | 57.72% | 5,486 | 41.21% | 3,917 | 1.07% | 102 | 9,505 |
| Stone | 30.02% | 1,598 | 66.38% | 3,534 | 3.61% | 192 | 5,324 |
| Union | 36.03% | 6,190 | 62.15% | 10,677 | 1.82% | 312 | 17,179 |
| Van Buren | 32.09% | 2,151 | 63.79% | 4,276 | 4.12% | 276 | 6,703 |
| Washington | 42.44% | 29,021 | 55.52% | 37,963 | 2.04% | 1,396 | 68,380 |
| White | 24.97% | 6,732 | 72.22% | 19,467 | 2.8% | 756 | 26,955 |
| Woodruff | 51.14% | 1,412 | 43.68% | 1,206 | 5.18% | 143 | 2,761 |
| Yell | 33.18% | 2,003 | 63.09% | 3,808 | 3.73% | 225 | 6,036 |
Electors
Technically the voters of Arkansas cast their ballots for electors: representatives to the Electoral College. Arkansas is allocated 6 electors because it has 4 congressional districts and 2 senators. All candidates who appear on the ballot or qualify to receive write-in votes must submit a list of 6 electors, who pledge to vote for their candidate and his or her running mate. Whoever wins the majority of votes in the state is awarded all 6 electoral votes. Their chosen electors then vote for president and vice president. Although electors are pledged to their candidate and running mate, they are not obligated to vote for them.[25] An elector who votes for someone other than his or her candidate is known as a faithless elector.
The electors of each state and the District of Columbia met on December 15, 2008, to cast their votes for president and vice president. The Electoral College itself never meets as one body. Instead the electors from each state and the District of Columbia met in their respective capitols.
The following were the members of the Electoral College from the state. All 6 were pledged to John McCain and Sarah Palin:[26]
- Jim Burnett
- Reta Hamilton
- Rose Bryant Jones
- Phyllis Kincannon
- Steve Lux
- Kermit Parks
References
- "Arkansas Swing 2008". Uselectionatlas.org. Retrieved 2013-10-27.
- "2008 Election Statistics". Uselectionatlas.org. Retrieved 2019-05-04.
- "D.C.'s Political Report: The complete source for campaign summaries". Dcpoliticalreport.com. Archived from the original on 2009-01-01. Retrieved 2012-07-26.
- "Presidential | The Cook Political Report". Cookpolitical.com. Archived from the original on May 5, 2015. Retrieved 2012-07-26.
- Vote 2008 - The Takeaway - Track the Electoral College vote predictions Archived April 22, 2009, at the Wayback Machine
- "President, Senate, House Updated Daily". Electoral-vote.com. Retrieved 2012-07-26.
- Based on Takeaway
- "POLITICO's 2008 Swing State Map". Politico.Com. Retrieved 2012-07-26.
- "Electoral Map". RealClearPolitics. Retrieved 2012-07-26.
- CQ Politics | CQ Presidential Election Maps, 2008 Archived June 14, 2009, at the Wayback Machine
- "Electoral College Map". The New York Times. Retrieved May 26, 2010.
- "October – 2008 – CNN Political Ticker - CNN.com Blogs". CNN. Retrieved May 26, 2010.
- "Winning the Electoral College". Fox News. April 27, 2010.
- "roadto270". Hosted.ap.org. Retrieved 2012-07-26.
- "Election 2008: Electoral College Update - Rasmussen Reports™". Rasmussenreports.com. 2008-11-03. Retrieved 2012-07-26.
- "Election 2008 Polls - Dave Leip's Atlas of U.S. Presidential Elections". Uselectionatlas.org. Retrieved 2012-07-26.
- "Alabama: McCain vs. Obama". RealClearPolitics. Retrieved May 31, 2009.
- "Map: Campaign money race - Election Center 2008 from CNN.com". CNN. Retrieved May 26, 2010.
- Archived January 18, 2009, at the Wayback Machine
- "Map: Campaign Ad Spending - Election Center 2008 from CNN.com". CNN. Retrieved May 26, 2010.
- "Map: Campaign Candidate Visits - Election Center 2008 from CNN.com". CNN. Retrieved May 26, 2010.
- "RealClearPolitics - Election 2008 - Arkansas". Retrieved 2008-12-17.
- "Official General Election Results". Arkansas Secretary of State. Retrieved 2008-12-12.
- "Electoral College". California Secretary of State. Archived from the original on October 30, 2008. Retrieved 2008-11-01.
- "U. S. Electoral College 2008 Election - Certificates". Archives.gov. Retrieved 2012-07-26.