2008 United States presidential election in Louisiana
The 2008 United States presidential election in Louisiana which took place on November 4, 2008, was part of the 2008 United States presidential election. Voters chose nine representatives, or electors to the Electoral College, who voted for president and vice president.
| ||||||||||||||||||||||||||
| ||||||||||||||||||||||||||
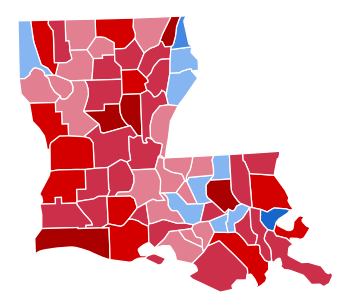 Parish Results
| ||||||||||||||||||||||||||
| ||||||||||||||||||||||||||
| Elections in Louisiana |
|---|
 |
|
Presidential Elections
U.S. Senate
U.S. House
|
|
State elections by year
Gubernatorial
Lieutenant gubernatorial Attorney General |
|
|
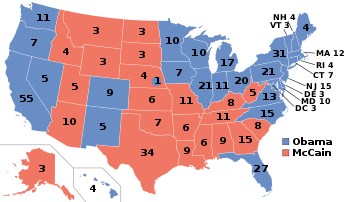
Louisiana was won by Republican nominee John McCain by an 18.6% margin of victory. Prior to the election, all 17 news organizations considered this a state McCain would win, or otherwise considered as a safe "red state". Although Bill Clinton carried the state twice, it had been trending Republican in recent years, despite having the second-highest percentage of African Americans in the country in 2000. Louisiana is rapidly turning into a more reliable red state as solidified by the comfortable margin enjoyed by McCain in 2008. This would also be the first time since the 1968 Presidential election that Louisiana failed to back the winning candidate when it voted for a third party candidate that year.
Primaries
- Louisiana Democratic primary, 2008
- Louisiana Republican caucuses and primary, 2008
Campaign
Predictions
There were 16 news organizations who made state-by-state predictions of the election. Here are their last predictions before election day:
- D.C. Political Report: Republican[1]
- Cook Political Report: Solid Republican[2]
- Takeaway: Solid McCain[3]
- Electoral-vote.com: Strong Republican[4]
- Washington Post: Solid McCain[5]
- Politico: Solid McCain[6]
- Real Clear Politics: Solid McCain[7]
- FiveThirtyEight.com: Solid McCain[5]
- CQ Politics: Safe Republican[8]
- New York Times: Solid Republican[9]
- CNN: Safe Republican[10]
- NPR: Solid McCain[5]
- MSNBC: Solid McCain[5]
- Fox News: Republican[11]
- Associated Press: Republican[12]
- Rasmussen Reports: Safe Republican[13]
Polling
McCain won every pre-election poll. The final 3 polls averaged McCain leading 50% to 40%.[14]
Fundraising
John McCain raised a total of $2,175,416 in the state. Barack Obama raised $1,438,276.[15]
Advertising and visits
Obama spent $368,039. McCain and his interest groups spent $6,019.[16] McCain visited the state once, in New Orleans.[17]
Analysis
.jpg)
Polling in Louisiana gave a strong lead to McCain, sometimes as high as 19%,[18] and Barack Obama did not seriously contest the state. Governor Bobby Jindal endorsed McCain early on in the primary season. Louisiana was also one of only two states to list Ron Paul on their official ballot (the other being Montana which gave the largest percentage to any third-party candidate nationwide).
In 2008, Louisiana was one of five states that swung even more Republican from 2004. John McCain carried Louisiana with 58.56% of the vote, a tad bit better than George W. Bush's 56.72% of the vote in 2004.
At the same time, however, incumbent Democratic U.S. Senator Mary Landrieu avoided the Republican trend in the state and held onto her U.S. Senate seat, taking in 52.11% of the vote to State Treasurer John N. Kennedy, a Democrat who switched parties to run against Landrieu. Republicans picked up two U.S. House seats in Louisiana (LA-02 and LA-06 with Joseph Cao and Bill Cassidy, respectively). In an extremely bad year for the Republican Party nationwide, Louisiana provided the GOP with a ray of hope and optimism.
Results
| United States presidential election in Louisiana, 2008[19] | ||||||
|---|---|---|---|---|---|---|
| Party | Candidate | Running mate | Votes | Percentage | Electoral votes | |
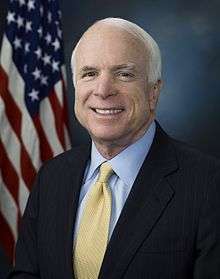
| Republican | John McCain | Sarah Palin | 1,148,275 | 58.56% | 9 | |
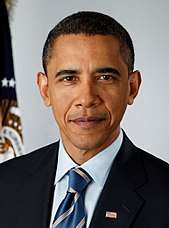
| Democratic | Barack Obama | Joe Biden | 782,989 | 39.93% | 0 | |
| Louisiana Taxpayers | Ron Paul (no campaign) | Barry Goldwater Jr. | 9,368 | 0.48% | 0 | |
| Green | Cynthia McKinney | Rosa Clemente | 9,187 | 0.47% | 0 | |
| Independent | Ralph Nader | Matt Gonzalez | 6,997 | 0.36% | 0 | |
| Constitution | Chuck Baldwin | Darrell Castle | 2,581 | 0.13% | 0 | |
| Socialist Workers | James Harris | Alyson Kennedy | 735 | 0.04% | 0 | |
| Socialism and Liberation | Gloria La Riva | Eugene Puryear | 354 | 0.02% | 0 | |
| Prohibition | Gene Amondson | Leroy Pletten | 275 | 0.01% | 0 | |
| Totals | 1,960,761 | 100.00% | 9 | |||
| Voter turnout (Voting age population) | 62.0% | |||||
Results breakdown
By parish
| Parish | Obama% | Obama# | McCain% | McCain# | Others% | Others# | Total |
|---|---|---|---|---|---|---|---|
| Acadia | 26.31% | 7,028 | 71.99% | 19,229 | 1.70% | 454 | 26,711 |
| Allen | 30.54% | 2,891 | 66.90% | 6,333 | 2.57% | 243 | 9,467 |
| Ascension | 31.40% | 14,625 | 67.08% | 31,239 | 1.52% | 707 | 46,571 |
| Assumption | 43.39% | 4,756 | 54.57% | 5,981 | 2.03% | 223 | 10,960 |
| Avoyelles | 37.35% | 6,327 | 60.43% | 10,236 | 2.21% | 375 | 16,938 |
| Beauregard | 21.82% | 3,071 | 76.15% | 10,718 | 2.03% | 285 | 14,074 |
| Bienville | 48.30% | 3,589 | 50.82% | 3,776 | 0.87% | 65 | 7,430 |
| Bossier | 27.71% | 12,703 | 71.37% | 32,713 | 0.91% | 419 | 45,835 |
| Caddo | 51.11% | 55,536 | 48.07% | 52,228 | 0.82% | 896 | 108,660 |
| Calcasieu | 36.82% | 30,244 | 61.43% | 50,449 | 1.75% | 1,438 | 82,131 |
| Caldwell | 22.85% | 1,118 | 75.54% | 3,696 | 1.61% | 79 | 4,893 |
| Cameron | 16.16% | 613 | 81.44% | 3,089 | 2.40% | 91 | 3,793 |
| Catahoula | 31.75% | 1,659 | 66.72% | 3,486 | 1.53% | 80 | 5,225 |
| Claiborne | 44.22% | 3,025 | 54.82% | 3,750 | 0.96% | 66 | 6,841 |
| Concordia | 39.53% | 3,766 | 59.49% | 5,668 | 0.98% | 93 | 9,527 |
| De Soto | 42.77% | 5,242 | 56.16% | 6,883 | 1.08% | 132 | 12,257 |
| East Baton Rouge | 50.50% | 99,652 | 48.34% | 95,390 | 1.17% | 2,307 | 197,349 |
| East Carroll | 63.70% | 2,267 | 35.23% | 1,254 | 1.07% | 38 | 3,559 |
| East Feliciana | 44.06% | 4,383 | 54.61% | 5,432 | 1.33% | 132 | 9,947 |
| Evangeline | 36.64% | 5,853 | 61.30% | 9,793 | 2.07% | 330 | 15,976 |
| Franklin | 31.64% | 2,961 | 67.09% | 6,278 | 1.27% | 119 | 9,358 |
| Grant | 17.22% | 1,474 | 80.71% | 6,907 | 2.07% | 177 | 8,558 |
| Iberia | 37.66% | 12,492 | 60.68% | 20,127 | 1.66% | 549 | 33,168 |
| Iberville | 54.95% | 9,023 | 43.75% | 7,185 | 1.30% | 213 | 16,421 |
| Jackson | 31.75% | 2,456 | 67.09% | 5,190 | 1.16% | 90 | 7,736 |
| Jefferson | 35.94% | 65,096 | 62.50% | 113,191 | 1.56% | 2,833 | 181,120 |
| Jefferson Davis | 29.06% | 3,923 | 68.72% | 9,278 | 2.22% | 300 | 13,501 |
| Lafayette | 33.61% | 32,145 | 64.88% | 62,055 | 1.51% | 1,442 | 95,642 |
| Lafourche | 25.50% | 9,662 | 71.49% | 27,089 | 3.01% | 1,142 | 37,893 |
| LaSalle | 13.12% | 860 | 85.49% | 5,602 | 1.39% | 91 | 6,553 |
| Lincoln | 43.23% | 8,292 | 55.69% | 10,680 | 1.08% | 207 | 19,179 |
| Livingston | 13.13% | 6,681 | 85.02% | 43,269 | 1.85% | 942 | 50,892 |
| Madison | 58.49% | 3,100 | 40.60% | 2,152 | 0.91% | 48 | 5,300 |
| Morehouse | 43.88% | 5,792 | 54.98% | 7,258 | 1.14% | 150 | 13,200 |
| Natchitoches | 45.71% | 7,801 | 53.05% | 9,054 | 1.24% | 212 | 17,067 |
| Orleans | 79.42% | 117,102 | 19.08% | 28,130 | 1.50% | 2,207 | 147,439 |
| Ouachita | 36.90% | 24,813 | 62.07% | 41,741 | 1.03% | 690 | 67,244 |
| Plaquemines | 32.35% | 3,380 | 65.98% | 6,894 | 1.67% | 175 | 10,449 |
| Pointe Coupee | 44.36% | 5,516 | 53.90% | 6,702 | 1.75% | 217 | 12,435 |
| Rapides | 34.99% | 20,127 | 63.65% | 36,611 | 1.36% | 783 | 57,521 |
| Red River | 44.93% | 2,080 | 53.66% | 2,484 | 1.40% | 65 | 4,629 |
| Richland | 36.06% | 3,311 | 62.64% | 5,751 | 1.30% | 119 | 9,181 |
| Sabine | 23.26% | 2,245 | 74.87% | 7,226 | 1.88% | 181 | 9,652 |
| St. Bernard | 25.78% | 3,491 | 71.21% | 9,643 | 3.01% | 407 | 13,541 |
| St. Charles | 33.56% | 8,522 | 64.80% | 16,457 | 1.65% | 418 | 25,397 |
| St. Helena | 57.68% | 3,567 | 40.78% | 2,522 | 1.54% | 95 | 6,184 |
| St. James | 55.67% | 6,994 | 43.23% | 5,432 | 1.10% | 138 | 12,564 |
| St. John the Baptist | 57.37% | 12,424 | 41.15% | 8,912 | 1.48% | 320 | 21,656 |
| St. Landry | 47.70% | 20,268 | 50.95% | 21,650 | 1.35% | 575 | 42,493 |
| St. Martin | 38.84% | 9,419 | 59.55% | 14,443 | 1.61% | 390 | 24,252 |
| St. Mary | 40.80% | 9,345 | 57.56% | 13,183 | 1.64% | 375 | 22,903 |
| St. Tammany | 22.45% | 24,596 | 75.84% | 83,078 | 1.71% | 1,868 | 109,542 |
| Tangipahoa | 33.82% | 16,438 | 64.68% | 31,434 | 1.50% | 730 | 48,602 |
| Tensas | 54.14% | 1,646 | 44.97% | 1,367 | 0.89% | 27 | 3,040 |
| Terrebonne | 28.46% | 11,581 | 69.32% | 28,210 | 2.22% | 905 | 40,696 |
| Union | 28.55% | 3,103 | 70.10% | 7,619 | 1.34% | 146 | 10,868 |
| Vermilion | 25.23% | 6,266 | 72.76% | 18,069 | 2.01% | 498 | 24,833 |
| Vernon | 22.41% | 3,534 | 75.76% | 11,946 | 1.83% | 289 | 15,769 |
| Washington | 32.87% | 6,122 | 65.59% | 12,215 | 1.54% | 287 | 18,624 |
| Webster | 36.18% | 6,610 | 62.49% | 11,417 | 1.33% | 243 | 18,270 |
| West Baton Rouge | 42.50% | 5,043 | 56.08% | 6,654 | 1.42% | 169 | 11,866 |
| West Carroll | 17.61% | 878 | 81.11% | 4,045 | 1.28% | 64 | 4,987 |
| West Feliciana | 42.97% | 2,415 | 56.05% | 3,150 | 0.98% | 55 | 5,620 |
| Winn | 30.23% | 2,047 | 68.40% | 4,632 | 1.37% | 93 | 6,772 |
By congressional district
John McCain carried 6 of the state’s 7 congressional districts.
| District | McCain | Obama | Representative |
|---|---|---|---|
| 1st | 72.72% | 25.68% | Bobby Jindal (110th Congress) |
| Steve Scalise (111th Congress) | |||
| 2nd | 24.86% | 74.13% | William J. Jefferson (110th Congress) |
| Joseph Cao (111th Congress) | |||
| 3rd | 60.99% | 37.03% | Charles Melancon |
| 4th | 59.28% | 39.57% | Jim McCrery (110th Congress) |
| John C. Fleming (111th Congress) | |||
| 5th | 61.75% | 36.96% | Rodney Alexander |
| 6th | 57.40% | 41.26% | Don Cazayoux (110th Congress) |
| Bill Cassidy (111th Congress) | |||
| 7th | 63.14% | 35.20% | Charles Boustany |
Electors
Technically the voters of Louisiana cast their ballots for electors: representatives to the Electoral College. Louisiana is allocated 9 electors because it has 7 congressional districts and 2 senators. All candidates who appear on the ballot or qualify to receive write-in votes must submit a list of 9 electors, who pledge to vote for their candidate and his or her running mate. Whoever wins the majority of votes in the state is awarded all 9 electoral votes. Their chosen electors then vote for president and vice president. Although electors are pledged to their candidate and running mate, they are not obligated to vote for them.[20] An elector who votes for someone other than his or her candidate is known as a faithless elector.
The electors of each state and the District of Columbia met on December 15, 2008, to cast their votes for president and vice president. The Electoral College itself never meets as one body. Instead the electors from each state and the District of Columbia met in their respective capitols.
The following were the members of the Electoral College from the state. All 9 were pledged to John McCain and Sarah Palin:[21]
- Lynn Skidmore
- Joe Lavigne
- Gordon Giles - He replaced Billy Nungesser, who was absent due to illness.[22]
- Alan Seabaugh
- Karen Haymon
- Charles Davis
- Charlie Buckels
- Dianne Christopher
- Roger F. Villere Jr.
References
- "D.C.'s Political Report: The complete source for campaign summaries". Archived from the original on 2009-01-01. Retrieved 2009-12-20.
- Presidential | The Cook Political Report Archived May 5, 2015, at the Wayback Machine
- Vote 2008 - The Takeaway - Track the Electoral College vote predictions Archived April 22, 2009, at the Wayback Machine
- Electoral-vote.com: President, Senate, House Updated Daily
- Based on Takeaway
- POLITICO's 2008 Swing State Map - POLITICO.com
- RealClearPolitics - Electoral Map
- CQ Politics | CQ Presidential Election Maps, 2008 Archived June 14, 2009, at the Wayback Machine
- "Electoral College Map". The New York Times. Retrieved May 26, 2010.
- "October – 2008 – CNN Political Ticker - CNN.com Blogs". CNN. Retrieved May 26, 2010.
- "Winning the Electoral College". Fox News. April 27, 2010.
- roadto270
- Election 2008: Electoral College Update - Rasmussen Reports™
- Election 2008 Polls - Dave Leip's Atlas of U.S. Presidential Elections
- "Presidential Campaign Finance". Archived from the original on 2009-03-24. Retrieved 2009-08-20.
- "Map: Campaign Ad Spending - Election Center 2008 from CNN.com". CNN. Retrieved May 26, 2010.
- "Map: Campaign Candidate Visits - Election Center 2008 from CNN.com". CNN. Retrieved May 26, 2010.
- "Archived copy". Archived from the original on 2009-01-31. Retrieved 2008-12-16.CS1 maint: archived copy as title (link)
- "Official General Election Results". The Green Papers. Retrieved 2008-12-12.
- "Electoral College". California Secretary of State. Archived from the original on October 30, 2008. Retrieved 2008-11-01.
- "Archived copy" (PDF). Archived from the original (PDF) on November 8, 2008. Retrieved November 8, 2008.CS1 maint: archived copy as title (link)
- http://www.katc.com/Global/story.asp?S=9525360%5B%5D