Morrow County, Ohio
Morrow County is a county located in the central portion of the U.S. state of Ohio. As of the 2010 census, the population was 34,827.[2] Its county seat is Mount Gilead.[3] The county was organized in 1848 from parts of four neighboring counties and named for Jeremiah Morrow who was the Governor of Ohio from 1822 to 1826. Shawnee people used the area for hunting purposes before white settlers arrived in the early 19th century.
Morrow County | |
|---|---|
 | |
 Seal | |
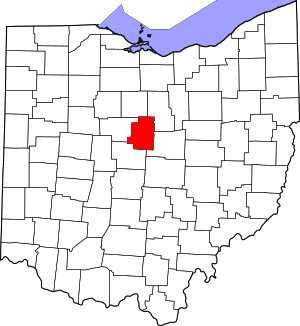 Location within the U.S. state of Ohio | |
 Ohio's location within the U.S. | |
| Coordinates: 40°32′N 82°48′W | |
| Country | |
| State | |
| Founded | March 1, 1848[1] |
| Named for | Jeremiah Morrow |
| Seat | Mount Gilead |
| Largest village | Mount Gilead |
| Area | |
| • Total | 407 sq mi (1,050 km2) |
| • Land | 406 sq mi (1,050 km2) |
| • Water | 1.1 sq mi (3 km2) 0.3%% |
| Population | |
| • Estimate (2019) | 35,328 |
| • Density | 86/sq mi (33/km2) |
| Time zone | UTC−5 (Eastern) |
| • Summer (DST) | UTC−4 (EDT) |
| Congressional district | 12th |
| Website | www |
Morrow County is included in the Columbus, OH Metropolitan Statistical Area.
In 2010, the center of population of Ohio was located in Morrow County, near the village of Marengo.[4]
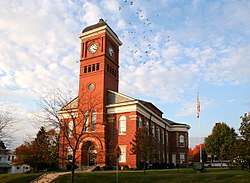
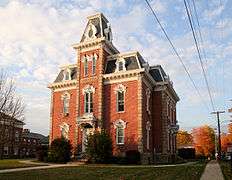
Morrow County's historic World War I Victory Shaft, unique in the United States, is located in the center of downtown Mount Gilead. Other areas interesting to the tourist include: Mount Gilead State Park; Amish farms and businesses near Johnsville and Chesterville; the Mid-Ohio Sports Car Course near Steam Corners; the rolling Allegheny foothills of eastern Morrow County; the site of the birthplace of President Warren G. Harding near Blooming Grove; the site of the former Ohio Central College in Iberia; the early 19th-century architecture of buildings in Chesterville, Ohio; the Revolutionary War Soldiers' Memorial in Mount Gilead; the Civil War monument in Cardington; and the mid-19th-century architecture of the Morrow County Courthouse and Old Jail in Mount Gilead.
Geography
According to the U.S. Census Bureau, the county has a total area of 407 square miles (1,050 km2), of which 406 square miles (1,050 km2) is land and 1.1 square miles (2.8 km2) (0.3%) is water.[5] Morrow County is considered to be a part of "Mid Ohio."
Adjacent counties
- Crawford County (north)
- Richland County (northeast)
- Knox County (southeast)
- Delaware County (southwest)
- Marion County (west)
Water features
| Ossing Run | |
|---|---|
 Ossing Run is located in Cardington, Ohio | |
| Location | |
| Country | United States |
| Physical characteristics | |
| Source | |
| • coordinates | 40°31′23″N 82°57′05″W |
| • elevation | 968 ft (295 m) |
| Mouth | |
• coordinates | 40°29′57″N 82°56′40″W |
| Length | 1.6 mi (2.6 km) |
Ossing Run is a tributary of Shaw Creek that flows through Morrow County, Ohio.[6] Shaw Creek flows into Whetstone Creek which is located adjacent to Cardington, Ohio. The United States Geological Survey’s Geographic Names Information System (GNIS) classifies Ossing Run as a stream with an identification number of 2761345. The feature name was entered into the GNIS system in April 2014.[7]
Demographics
| Historical population | |||
|---|---|---|---|
| Census | Pop. | %± | |
| 1850 | 20,280 | — | |
| 1860 | 20,445 | 0.8% | |
| 1870 | 18,583 | −9.1% | |
| 1880 | 19,072 | 2.6% | |
| 1890 | 18,120 | −5.0% | |
| 1900 | 17,879 | −1.3% | |
| 1910 | 16,815 | −6.0% | |
| 1920 | 15,570 | −7.4% | |
| 1930 | 14,489 | −6.9% | |
| 1940 | 15,646 | 8.0% | |
| 1950 | 17,168 | 9.7% | |
| 1960 | 19,405 | 13.0% | |
| 1970 | 21,348 | 10.0% | |
| 1980 | 26,480 | 24.0% | |
| 1990 | 27,749 | 4.8% | |
| 2000 | 31,628 | 14.0% | |
| 2010 | 34,827 | 10.1% | |
| Est. 2019 | 35,328 | [8] | 1.4% |
| U.S. Decennial Census[9] 1790-1960[10] 1900-1990[11] 1990-2000[12] 2010-2019[2] | |||
2000 census
As of the census[13] of 2000, there were 31,628 people, 11,499 households, and 8,854 families living in the county. The population density was 78 people per square mile (30/km²). There were 12,132 housing units at an average density of 30 per square mile (12/km²). The racial makeup of the county was 98.37% White, 0.27% Black or African American, 0.30% Native American, 0.15% Asian, 0.18% from other races, and 0.74% from two or more races. 0.58% of the population were Hispanic or Latino of any race.
There were 11,499 households out of which 35.60% had children under the age of 18 living with them, 64.60% were married couples living together, 8.10% had a female householder with no husband present, and 23.00% were non-families. 19.00% of all households were made up of individuals and 7.90% had someone living alone who was 65 years of age or older. The average household size was 2.72 and the average family size was 3.09.
In the county, the population was spread out with 27.30% under the age of 18, 7.60% from 18 to 24, 29.30% from 25 to 44, 24.30% from 45 to 64, and 11.50% who were 65 years of age or older. The median age was 36 years. For every 100 females there were 99.40 males. For every 100 females age 18 and over, there were 98.00 males.
The median income for a household in the county was $40,882, and the median income for a family was $45,747. Males had a median income of $33,129 versus $22,454 for females. The per capita income for the county was $17,830. About 6.60% of families and 9.00% of the population were below the poverty line, including 12.40% of those under age 18 and 7.10% of those age 65 or over.
2010 census
As of the 2010 United States Census, there were 34,827 people, 12,855 households, and 9,578 families living in the county.[14] The population density was 85.8 inhabitants per square mile (33.1/km2). There were 14,155 housing units at an average density of 34.9 per square mile (13.5/km2).[15] The racial makeup of the county was 97.7% white, 0.3% black or African American, 0.3% Asian, 0.1% American Indian, 0.2% from other races, and 1.3% from two or more races. Those of Hispanic or Latino origin made up 1.1% of the population.[14] In terms of ancestry, 30.8% were German, 16.1% were American, 14.4% were Irish, and 13.3% were English.[16]
Of the 12,855 households, 35.1% had children under the age of 18 living with them, 59.5% were married couples living together, 9.5% had a female householder with no husband present, 25.5% were non-families, and 20.7% of all households were made up of individuals. The average household size was 2.68 and the average family size was 3.08. The median age was 39.5 years.[14]
The median income for a household in the county was $49,891 and the median income for a family was $55,980. Males had a median income of $41,096 versus $32,911 for females. The per capita income for the county was $20,795. About 7.5% of families and 10.8% of the population were below the poverty line, including 13.9% of those under age 18 and 9.5% of those age 65 or over.[17]
Politics
Morrow County is a Republican stronghold county. The last time it voted for a Democratic candidate was Lyndon B. Johnson in 1964.
| Year | Republican | Democratic | Third parties |
|---|---|---|---|
| 2016 | 71.6% 11,948 | 22.5% 3,761 | 5.9% 979 |
| 2012 | 60.8% 9,865 | 36.6% 5,933 | 2.6% 419 |
| 2008 | 60.4% 10,067 | 37.0% 6,177 | 2.6% 435 |
| 2004 | 64.2% 10,474 | 35.4% 5,775 | 0.5% 79 |
| 2000 | 61.1% 7,842 | 35.3% 4,529 | 3.7% 468 |
| 1996 | 46.1% 5,655 | 37.7% 4,627 | 16.2% 1,993 |
| 1992 | 40.7% 5,208 | 30.5% 3,907 | 28.7% 3,676 |
| 1988 | 66.3% 7,130 | 32.7% 3,515 | 1.1% 115 |
| 1984 | 73.5% 8,116 | 25.7% 2,839 | 0.8% 87 |
| 1980 | 62.0% 6,179 | 32.5% 3,239 | 5.6% 554 |
| 1976 | 53.3% 5,814 | 44.6% 4,870 | 2.1% 228 |
| 1972 | 70.6% 6,886 | 25.9% 2,527 | 3.6% 346 |
| 1968 | 55.6% 4,898 | 27.3% 2,405 | 17.1% 1,509 |
| 1964 | 47.8% 4,194 | 52.2% 4,572 | |
| 1960 | 69.9% 6,357 | 30.1% 2,736 | |
| 1956 | 71.6% 5,885 | 28.4% 2,339 | |
| 1952 | 72.0% 6,106 | 28.0% 2,379 | |
| 1948 | 62.2% 4,327 | 37.6% 2,616 | 0.2% 12 |
| 1944 | 69.8% 5,439 | 30.2% 2,356 | |
| 1940 | 62.9% 5,457 | 37.1% 3,215 | |
| 1936 | 49.5% 4,086 | 47.8% 3,947 | 2.7% 219 |
| 1932 | 48.8% 3,811 | 49.3% 3,849 | 1.9% 146 |
| 1928 | 71.7% 4,801 | 27.1% 1,818 | 1.2% 80 |
| 1924 | 57.4% 3,790 | 36.0% 2,379 | 6.6% 435 |
| 1920 | 60.8% 4,484 | 38.7% 2,858 | 0.5% 36 |
| 1916 | 45.4% 2,062 | 51.6% 2,345 | 3.0% 134 |
| 1912 | 27.7% 1,240 | 41.9% 1,880 | 30.4% 1,365 |
| 1908 | 51.1% 2,500 | 45.7% 2,239 | 3.2% 157 |
| 1904 | 55.2% 2,563 | 39.3% 1,827 | 5.5% 255 |
| 1900 | 51.6% 2,605 | 45.1% 2,278 | 3.3% 167 |
| 1896 | 48.8% 2,506 | 49.0% 2,517 | 2.2% 113 |
| 1892 | 49.1% 2,297 | 41.8% 1,958 | 9.1% 426 |
| 1888 | 51.0% 2,514 | 42.0% 2,068 | 7.0% 345 |
| 1884 | 52.4% 2,612 | 43.3% 2,160 | 4.3% 214 |
| 1880 | 52.9% 2,581 | 43.9% 2,143 | 3.1% 153 |
| 1876 | 53.5% 2,450 | 44.6% 2,046 | 1.9% 88 |
| 1872 | 55.9% 2,197 | 42.9% 1,689 | 1.2% 48 |
| 1868 | 58.2% 2,469 | 41.7% 1,770 | |
| 1864 | 58.8% 2,366 | 41.1% 1,656 | |
| 1860 | 53.1% 2,260 | 45.3% 1,928 | 1.4% 62 |
| 1856 | 53.4% 2,031 | 43.8% 1,667 | 2.6% 101 |
Government
Communities
Cities
- Galion (part)
Villages
- Cardington
- Chesterville
- Edison
- Fulton
- Marengo
- Mount Gilead (county seat)
- Sparta
Census-designated places
Unincorporated communities
Notable residents
- Tim Belcher, former Major League Baseball pitcher
- Richard Dillingham, Quaker abolitionist
- Frank W. Gunsaulus, pastor
- Albert P. Halfhill, businessman, father of the tuna packing industry was born in the county.
- Warren G. Harding, U.S. President
- Dawn Powell, author
- Esther Tuttle Pritchard (1840–1900), minister, editor
- Samuel Newitt Wood, politician and women's rights advocate
References
- "Ohio County Profiles: Morrow County" (PDF). Ohio Department of Development. Archived from the original (PDF) on 2007-06-21. Retrieved 2007-04-28.
- "State & County QuickFacts". United States Census Bureau. Archived from the original on June 6, 2011. Retrieved February 9, 2015.
- "Find a County". National Association of Counties. Retrieved 2011-06-07.
- "Centers of Population by State: 2010". United States Census Bureau. Retrieved April 18, 2014.
- "2010 Census Gazetteer Files". United States Census Bureau. August 22, 2012. Archived from the original on May 4, 2014. Retrieved February 9, 2015.
- "14-R-046" (PDF). Commissioners' Journal. January 22, 2014. Archived from the original (PDF) on 2 April 2015. Retrieved 10 February 2015.
- "GNIS". Geographic Names Information System. United States Geological Survey. Retrieved 9 December 2014.
- "Population and Housing Unit Estimates". Retrieved March 26, 2020.
- "U.S. Decennial Census". United States Census Bureau. Retrieved February 9, 2015.
- "Historical Census Browser". University of Virginia Library. Retrieved February 9, 2015.
- Forstall, Richard L., ed. (March 27, 1995). "Population of Counties by Decennial Census: 1900 to 1990". United States Census Bureau. Retrieved February 9, 2015.
- "Census 2000 PHC-T-4. Ranking Tables for Counties: 1990 and 2000" (PDF). United States Census Bureau. April 2, 2001. Retrieved February 9, 2015.
- "U.S. Census website". United States Census Bureau. Retrieved 2008-01-31.
- "DP-1 Profile of General Population and Housing Characteristics: 2010 Demographic Profile Data". United States Census Bureau. Archived from the original on 2020-02-13. Retrieved 2015-12-27.
- "Population, Housing Units, Area, and Density: 2010 - County". United States Census Bureau. Archived from the original on 2020-02-13. Retrieved 2015-12-27.
- "DP02 SELECTED SOCIAL CHARACTERISTICS IN THE UNITED STATES – 2006-2010 American Community Survey 5-Year Estimates". United States Census Bureau. Archived from the original on 2020-02-13. Retrieved 2015-12-27.
- "DP03 SELECTED ECONOMIC CHARACTERISTICS – 2006-2010 American Community Survey 5-Year Estimates". United States Census Bureau. Archived from the original on 2020-02-13. Retrieved 2015-12-27.
- Leip, David. "Dave Leip's Atlas of U.S. Presidential Elections". uselectionatlas.org. Retrieved 2018-05-02.
External links
Places adjacent to Morrow County, Ohio | ||||||||||
|---|---|---|---|---|---|---|---|---|---|---|
| ||||||||||
Municipalities and communities of Morrow County, Ohio, United States | ||
|---|---|---|
| City | Map of Ohio highlighting Morrow County | |
| Villages | ||
| Townships | ||
| CDPs | ||
| Unincorporated communities | ||
| Ghost towns |
| |
| Footnotes | ‡This populated place also has portions in an adjacent county or counties | |
.svg.png)
| Authority control |
|
|---|