2008 United States presidential election in Minnesota
The 2008 United States presidential election in Minnesota took place on November 4, 2008, and was part of the 2008 United States presidential election. Voters chose 10 representatives, or electors to the Electoral College, who voted for president and vice president.
| ||||||||||||||||||||||||||
| Turnout | 78.11%[1] | |||||||||||||||||||||||||
|---|---|---|---|---|---|---|---|---|---|---|---|---|---|---|---|---|---|---|---|---|---|---|---|---|---|---|
| ||||||||||||||||||||||||||
 County Results
| ||||||||||||||||||||||||||
| ||||||||||||||||||||||||||
| Elections in Minnesota | ||||||||||
|---|---|---|---|---|---|---|---|---|---|---|
 | ||||||||||
|
||||||||||
|
State executive elections
|
||||||||||
|
||||||||||
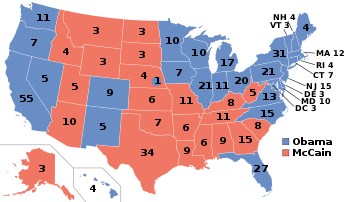
Minnesota was won by Democratic nominee Barack Obama by a 10.2% margin of victory. Prior to the election, all 17 news organizations considered this a state Obama would win, or otherwise considered as a safe blue state. Barack Obama carried the state with 54.06% of the vote in 2008 over John McCain's 43.82%. Minnesota has not voted Republican since Richard Nixon in 1972.
Caucuses
- 2008 Minnesota Democratic caucuses
- 2008 Minnesota Republican caucuses
Campaign
Predictions
There were 16 news organizations who made state-by-state predictions of the election. Here are the last predictions before election day:
- D.C. Political Report: Democrat[2]
- Cook Political Report: Leaning Democrat[3]
- Takeaway: Solid Obama[4]
- Electoral-vote.com: Strong Democrat[5]
- Washington Post: Leaning Obama[6]
- Politico: Solid Obama[7]
- Real Clear Politics: Solid Obama[8]
- FiveThirtyEight.com: Solid Obama[6]
- CQ Politics: Leaning Democrat[9]
- New York Times: Leaning Democrat[10]
- CNN: Leaning Democrat[11]
- NPR: Solid Obama[6]
- MSNBC: Solid Obama[6]
- Fox News: Democrat[12]
- Associated Press: Democrat[13]
- Rasmussen Reports: Safe Democrat[14]
Polling
In the aftermath of the GOP National Convention that was highlighted by a well delivered and received speech by vice presidential nominee Governor Sarah Palin, a strong Obama lead tightened into a very narrow polling lead. However, when the September financial crisis irreparably damaged McCain's chances at victory, McCain remained competitive in Minnesota for some time after Obama had pulled away in other states such as Michigan and Wisconsin. At no time, however, did polls indicate that John McCain was ahead in the state, and Obama eventually did pull away from John McCain.[15]
Fundraising
John McCain raised a total of $2,423,705 in the state. Barack Obama raised $6,058,168.[16]
Analysis
Although Minnesota, a Democratic-leaning state, had voted for the Democratic presidential candidate of every election since 1972, the margin of victory had been narrow in the past two presidential elections. With this in mind, Republicans targeted the state for the 2008 election, holding the 2008 Republican National Convention in Minneapolis-St. Paul. Although the state swung more Democratic in 2008 and Barack Obama performed better here than John Kerry did in 2004, the swing was smaller than the national average.
During the same election, a contentious U.S. Senate battle took place between incumbent Republican U.S. Senator Norm Coleman and Democrat Al Franken. The close election resulted in two court appeals, which both eventually declared Franken the winner, which caused Coleman to concede. At the state level, Democrats picked up two seats in the Minnesota House of Representatives and one seat in the Minnesota Senate.
On Election Day, Obama won Minnesota by a comfortable margin, piling up 2-1 margins in Hennepin County (Minneapolis) and Ramsey County (St. Paul). Obama also ran evenly in the Minneapolis suburbs and rural Minnesota. However, McCain mostly held the same counties Bush won in the Republican base of central Minnesota.[19] While Obama still won the state with ease, GOP efforts and the Republican National Convention led to a better Republican performance than seen in neighboring states in the Upper Midwest, and prevented the collapse of Republican support that occurred in neighboring Michigan and Wisconsin.
As of the 2016 presidential election, this is the last election in which Stevens County, Watonwan County, Pope County, Grant County, Yellow Medicine County, Lincoln County, Pennington County, Murray County, Pine County, Big Stone County, Marshall County, Polk County, Red Lake County, and Aitkin County voted for the Democratic candidate.
Results
| 2008 United States presidential election in Minnesota[20] | ||||||
|---|---|---|---|---|---|---|
| Party | Candidate | Running mate | Votes | Percentage | Electoral votes | |
| Democratic | Barack Obama | Joe Biden | 1,573,354 | 54.06% | 10 | |
| Republican | John McCain | Sarah Palin | 1,275,409 | 43.82% | 0 | |
| Independent | Ralph Nader | Matt Gonzalez | 30,152 | 1.04% | 0 | |
| Independent | Write-in candidates | 9,496 | 0.33% | 0 | ||
| Libertarian | Bob Barr | Wayne Allyn Root | 9,174 | 0.32% | 0 | |
| Constitution | Chuck Baldwin | Darrell Castle | 6,787 | 0.23% | 0 | |
| Green | Cynthia McKinney | Rosa Clemente | 5,174 | 0.18% | 0 | |
| Socialist Workers | Róger Calero | Alyson Kennedy | 790 | 0.03% | 0 | |
| Independent | Alan Keyes (write-in) | Brian Rohrbough | 22 | 0.00% | 0 | |
| Socialist Party USA | Brian Moore (write-in) | Stewart Alexander | 7 | 0.00% | 0 | |
| Independent | Joe Schriner (write-in) | Dale Way | 3 | 0.00% | 0 | |
| Independent | Curtis Montgomery (write-in) | Janice Montgomery | 1 | 0.00% | 0 | |
| Totals | 2,910,369 | 100.00% | 10 | |||
| Voter turnout (Voting age population) | 74.7% | |||||
By congressional district
Barack Obama carried five of the state’s eight congressional districts in Minnesota, including one seat held by a Republican. John McCain carried three congressional districts, including one seat held by a Democrat.
| District | McCain | Obama | Representative |
|---|---|---|---|
| 1st | 46.59% | 50.96% | Tim Walz |
| 2nd | 49.76% | 48.32% | John Kline |
| 3rd | 45.99% | 52.41% | Jim Ramstad (110th Congress) |
| Erik Paulsen (111th Congress) | |||
| 4th | 33.57% | 64.41% | Betty McCollum |
| 5th | 23.79% | 74.15% | Keith Ellison |
| 6th | 53.33% | 44.60% | Michele Bachmann |
| 7th | 50.10% | 47.39% | Collin Peterson |
| 8th | 44.50% | 53.10% | Jim Oberstar |
By county
| County | Barack Hussein Obama
Democratic |
John Sidney McCain III
Republican |
Other candidates
Various parties |
Total | |||
|---|---|---|---|---|---|---|---|
| % | # | % | # | % | # | ||
| Aitkin | 48.83% | 4,595 | 48.77% | 4,589 | 2.4% | 226 | 9,410 |
| Anoka | 47.73% | 86,976 | 50.13% | 91,357 | 2.14% | 3,891 | 182,224 |
| Becker | 45.31% | 7,687 | 52.17% | 8,851 | 2.52% | 427 | 16,965 |
| Beltrami | 54.05% | 12,019 | 43.90% | 9,762 | 2.05% | 455 | 22,236 |
| Benton | 43.71% | 8,454 | 53.46% | 10,338 | 2.83% | 547 | 19,339 |
| Big Stone | 51.91% | 1,552 | 45.55% | 1,362 | 2.54% | 76 | 2,990 |
| Blue Earth | 55.10% | 19,325 | 42.15% | 14,782 | 2.75% | 963 | 35,070 |
| Brown | 42.65% | 5,809 | 54.74% | 7,456 | 2.61% | 355 | 13,620 |
| Carlton | 62.34% | 11,501 | 35.50% | 6,549 | 2.16% | 399 | 18,449 |
| Carver | 41.57% | 20,654 | 56.67% | 28,156 | 1.76% | 873 | 49,683 |
| Cass | 44.62% | 7,276 | 53.11% | 8,660 | 2.28% | 371 | 16,307 |
| Chippewa | 51.60% | 3,280 | 45.74% | 2,907 | 2.66% | 169 | 6,356 |
| Chisago | 43.62% | 12,783 | 53.88% | 15,789 | 2.5% | 733 | 29,305 |
| Clay | 56.96% | 16,666 | 40.94% | 11,978 | 2.1% | 615 | 29,259 |
| Clearwater | 44.05% | 1,877 | 53.77% | 2,291 | 2.18% | 93 | 4,261 |
| Cook | 60.30% | 2,019 | 37.04% | 1,240 | 2.66% | 89 | 3,348 |
| Cottonwood | 45.71% | 2,759 | 52.30% | 3,157 | 1.99% | 120 | 6,036 |
| Crow Wing | 45.10% | 15,859 | 52.80% | 18,567 | 2.1% | 739 | 35,165 |
| Dakota | 51.79% | 116,778 | 46.29% | 104,364 | 1.92% | 4,330 | 225,472 |
| Dodge | 43.70% | 4,463 | 53.54% | 5,468 | 2.76% | 282 | 10,213 |
| Douglas | 44.25% | 9,256 | 53.74% | 11,241 | 2.01% | 421 | 20,918 |
| Faribault | 45.83% | 3,736 | 51.47% | 4,196 | 2.7% | 220 | 8,152 |
| Fillmore | 52.71% | 5,921 | 44.45% | 4,993 | 2.85% | 320 | 11,234 |
| Freeborn | 57.38% | 9,915 | 40.25% | 6,955 | 2.37% | 410 | 17,280 |
| Goodhue | 48.15% | 12,420 | 49.53% | 12,775 | 2.33% | 600 | 25,795 |
| Grant | 51.32% | 1,850 | 45.66% | 1,646 | 3.02% | 109 | 3,605 |
| Hennepin | 63.42% | 420,958 | 34.81% | 231,054 | 1.77% | 11,768 | 663,780 |
| Houston | 54.27% | 5,906 | 43.58% | 4,743 | 2.15% | 234 | 10,883 |
| Hubbard | 41.86% | 4,872 | 56.35% | 6,558 | 1.79% | 208 | 11,638 |
| Isanti | 41.13% | 8,248 | 56.47% | 11,324 | 2.4% | 481 | 20,053 |
| Itasca | 55.18% | 13,460 | 42.26% | 10,309 | 2.57% | 626 | 24,395 |
| Jackson | 46.56% | 2,618 | 50.83% | 2,858 | 2.61% | 147 | 5,623 |
| Kanabec | 44.04% | 3,743 | 52.70% | 4,479 | 3.26% | 277 | 8,499 |
| Kandiyohi | 46.24% | 10,125 | 51.70% | 11,319 | 2.06% | 451 | 21,895 |
| Kittson | 58.10% | 1,492 | 39.56% | 1,016 | 2.34% | 60 | 2,568 |
| Koochiching | 53.65% | 3,649 | 43.55% | 2,962 | 2.81% | 191 | 6,802 |
| Lac qui Parle | 51.53% | 2,160 | 45.61% | 1,912 | 2.86% | 120 | 4,192 |
| Lake County | 59.89% | 4,174 | 37.82% | 2,636 | 2.28% | 159 | 6,969 |
| Lake of the Woods | 41.98% | 971 | 55.25% | 1,278 | 2.77% | 64 | 2,313 |
| Le Sueur | 46.60% | 6,994 | 50.88% | 7,636 | 2.53% | 379 | 15,009 |
| Lincoln | 48.53% | 1,517 | 47.70% | 1,491 | 3.77% | 118 | 3,126 |
| Lyon | 48.08% | 6,110 | 49.69% | 6,315 | 2.23% | 283 | 12,708 |
| McLeod | 39.44% | 7,505 | 57.77% | 10,993 | 2.79% | 531 | 19,029 |
| Mahnomen | 61.29% | 1,436 | 35.98% | 843 | 2.73% | 64 | 2,343 |
| Marshall | 48.77% | 2,311 | 48.22% | 2,285 | 3.02% | 143 | 4,739 |
| Martin | 41.04% | 4,413 | 56.29% | 6,053 | 2.68% | 288 | 10,754 |
| Meeker | 42.89% | 5,380 | 53.70% | 6,737 | 3.41% | 428 | 12,545 |
| Mille Lacs | 44.83% | 6,072 | 52.05% | 7,049 | 3.12% | 423 | 13,544 |
| Morrison | 39.10% | 6,547 | 58.14% | 9,735 | 2.75% | 461 | 16,743 |
| Mower | 60.48% | 11,605 | 36.87% | 7,075 | 2.64% | 507 | 19,187 |
| Murray | 48.72% | 2,345 | 48.20% | 2,320 | 3.08% | 148 | 4,813 |
| Nicollet | 54.19% | 9,887 | 43.67% | 7,968 | 2.14% | 390 | 18,245 |
| Nobles | 48.16% | 4,244 | 49.56% | 4,368 | 2.28% | 201 | 8,813 |
| Norman | 62.00% | 2,129 | 35.06% | 1,204 | 2.94% | 101 | 3,434 |
| Olmsted | 50.62% | 38,711 | 47.34% | 36,202 | 2.04% | 1,557 | 76,470 |
| Otter Tail | 42.39% | 13,856 | 55.30% | 18,077 | 2.31% | 754 | 32,687 |
| Pennington | 49.75% | 3,394 | 47.61% | 3,248 | 2.64% | 180 | 6,822 |
| Pine | 49.25% | 7,084 | 47.71% | 6,862 | 3.04% | 437 | 14,383 |
| Pipestone | 42.14% | 2,023 | 55.24% | 2,652 | 2.62% | 126 | 4,801 |
| Polk | 51.19% | 7,850 | 46.62% | 7,148 | 2.19% | 336 | 15,334 |
| Pope | 50.75% | 3,317 | 46.96% | 3,069 | 2.29% | 150 | 6,536 |
| Ramsey | 65.96% | 182,974 | 32.06% | 88,942 | 1.97% | 5,470 | 277,386 |
| Red Lake | 51.12% | 1,120 | 44.87% | 983 | 4.02% | 88 | 2,191 |
| Redwood | 41.63% | 3,250 | 55.19% | 4,308 | 3.18% | 248 | 7,806 |
| Renville | 47.99% | 3,904 | 48.63% | 3,956 | 3.38% | 275 | 8,135 |
| Rice | 54.66% | 17,381 | 43.16% | 13,723 | 2.19% | 695 | 31,799 |
| Rock | 41.79% | 2,079 | 55.78% | 2,775 | 2.43% | 121 | 4,975 |
| Roseau | 40.22% | 3,097 | 57.64% | 4,438 | 2.14% | 165 | 7,700 |
| St. Louis | 65.10% | 77,351 | 32.61% | 38,742 | 2.29% | 2,721 | 118,814 |
| Scott | 43.51% | 29,208 | 54.70% | 36,724 | 1.79% | 1,200 | 67,132 |
| Sherburne | 39.91% | 17,957 | 58.10% | 26,140 | 1.98% | 893 | 44,990 |
| Sibley | 38.79% | 2,998 | 58.12% | 4,492 | 3.09% | 239 | 7,729 |
| Stearns | 45.32% | 35,690 | 52.31% | 41,194 | 2.38% | 1,872 | 78,756 |
| Steele | 45.87% | 9,016 | 51.22% | 10,068 | 2.91% | 572 | 19,656 |
| Stevens | 49.36% | 2,781 | 48.10% | 2,710 | 2.54% | 143 | 5,634 |
| Swift | 55.43% | 2,907 | 41.65% | 2,184 | 2.92% | 153 | 5,244 |
| Todd | 43.05% | 5,277 | 54.15% | 6,637 | 2.8% | 343 | 12,257 |
| Traverse | 51.25% | 1,043 | 45.85% | 933 | 2.9% | 59 | 2,035 |
| Wabasha | 47.47% | 5,646 | 49.90% | 5,935 | 2.62% | 312 | 11,893 |
| Wadena | 40.20% | 2,882 | 57.58% | 4,128 | 2.22% | 159 | 7,169 |
| Waseca | 44.51% | 4,401 | 52.70% | 5,211 | 2.79% | 276 | 9,888 |
| Washington | 51.27% | 70,277 | 46.94% | 64,334 | 1.79% | 2,448 | 137,059 |
| Watonwan | 48.73% | 2,562 | 48.04% | 2,526 | 3.23% | 170 | 5,258 |
| Wilkin | 45.40% | 1,550 | 52.31% | 1,786 | 2.28% | 78 | 3,414 |
| Winona | 58.38% | 16,308 | 39.29% | 10,975 | 2.33% | 652 | 27,935 |
| Wright | 40.17% | 26,343 | 57.61% | 37,779 | 2.22% | 1,456 | 65,578 |
| Yellow Medicine | 50.57% | 2,816 | 46.31% | 2,579 | 3.12% | 174 | 5,569 |
Electors
Technically the voters of Minnesota heir ballots for electors: representatives to the Electoral College. Minnesota is allocated 10 electors because it has 8 congressional districts and 2 senators. All candidates who appear on the ballot or qualify to receive write-in votes must submit a list of 10 electors, who pledge to vote for their candidate and his or her running mate. Whoever wins the majority of votes in the state is awarded all 10 electoral votes. Their chosen electors then vote for president and vice president. Following an apparent mishap in the previous election, whereby an elector pledged to Democrat presidential candidate John Kerry instead cast their vote for running-mate John Edwards and thus became a faithless elector, Minnesota amended its statutes and became one of the few states whereby electors are legally required to vote for the candidate they are pledged to. This was the first election where the new laws were effective.[21]
The electors of each state and the District of Columbia met on December 15, 2008, to cast their votes for president and vice president. The Electoral College itself never meets as one body. Instead the electors from each state and the District of Columbia met in their respective capitols.
The following were the members of the Electoral College from the state. All 10 were pledged to Barack Obama and Joe Biden:[22]
- Arthur A. Anderson
- Jim Gremmels
- Dave Lee
- Al Patton
- Joan M. Wittman
- William J. Davis
- Benjamin F. Gross
- Matt Little
- Jackie Stevenson
- Susan Kay Moravec - replaced Donyta J. Wright who did not appear for the ceremony[23]
References
- "Office of the State Of Minnesota Secretary of State". www.sos.state.mn.us. Retrieved 2017-07-22.
- "D.C.'s Political Report: The complete source for campaign summaries". Archived from the original on 2009-01-01. Retrieved 2009-12-20.
- Presidential | The Cook Political Report Archived May 5, 2015, at the Wayback Machine
- Adnaan (2008-09-20). "Track the Electoral College vote predictions". The Takeaway. Archived from the original on April 22, 2009. Retrieved 2009-11-14.
- Electoral-vote.com: President, Senate, House Updated Daily
- Based on Takeaway
- POLITICO's 2008 Swing State Map - POLITICO.com
- RealClearPolitics - Electoral Map
- CQ Politics | CQ Presidential Election Maps, 2008 Archived October 29, 2008, at the Wayback Machine
- "Electoral College Map". The New York Times. Retrieved 2010-05-26.
- "October – 2008 – CNN Political Ticker - CNN.com Blogs". CNN. Retrieved 2010-05-26.
- "Winning the Electoral College". Fox News. 2010-04-27.
- roadto270
- Election 2008: Electoral College Update - Rasmussen Reports™
- "Minnesota: McCain vs. Obama". Retrieved 2009-04-05.
- "Presidential Campaign Finance". Archived from the original on 2009-03-24. Retrieved 2009-08-19.
- "Map: Campaign Ad Spending - Election Center 2008 from CNN.com". CNN. Retrieved 2010-05-26.
- "Map: Campaign Candidate Visits - Election Center 2008 from CNN.com". CNN. Retrieved 2010-05-26.
- "Election Results 2008". The New York Times. Archived from the original on November 3, 2004. Retrieved 2009-04-05.
- "Official General Election Results". Minnesota Secretary of State. Archived from the original on 2008-12-08. Retrieved 2008-12-12.
- "208.08, 2008 Minnesota Statutes". Revisor.leg.state.mn.us. Retrieved 2016-08-21.
- "Archived copy". Archived from the original (PDF) on November 27, 2008. Retrieved April 19, 2009.CS1 maint: archived copy as title (link)
- Citizen Elector
| |||||||||||||||||||||||||||
| |||||||||||||||||||||||||||
| |||||||||||||||||||||||||||
| |||||||||||||||||||||||||||