2008 United States presidential election in Oregon
The 2008 United States presidential election in Oregon took place on November 4, 2008, and was part of the 2008 United States presidential election. Voters chose seven representatives, or electors to the Electoral College, who voted for president and vice president.
| ||||||||||||||||||||||||||
| ||||||||||||||||||||||||||
 County Results
| ||||||||||||||||||||||||||
| ||||||||||||||||||||||||||
| Elections in Oregon | ||||||||||
|---|---|---|---|---|---|---|---|---|---|---|
 | ||||||||||
|
||||||||||
|
||||||||||
|
||||||||||
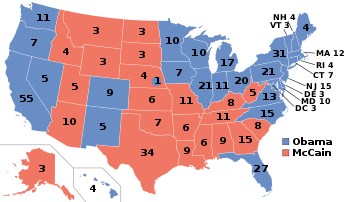
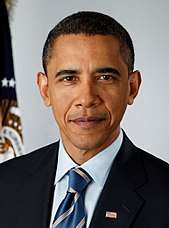
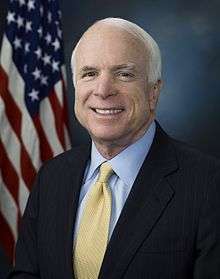
Oregon was won by Democratic nominee Barack Obama with a 16.4% margin of victory. Prior to the election, all 17 news organizations considered this a state Obama would win, or otherwise considered as a safe blue state. Situated on the West Coast, which has become a reliably Democratic stronghold, Oregon is a relatively blue state. The last Republican presidential nominee to carry Oregon was Ronald Reagan in his 1984 landslide reelection. Although George W. Bush came close in both 2000 and 2004 (with Al Gore winning by 0.54 percentage points in 2000 and John Kerry by 4.16 percentage points in 2004), and the Republicans have not seriously contested here since. This is also the first time that a presidential candidate won more than a million votes in Oregon.
Primaries
- 2008 Oregon Democratic primary
- 2008 Oregon Republican primary
Campaign
Predictions
There were 16 news organizations who made state-by-state predictions of the election. Here are their last predictions before election day:
- D.C. Political Report: Democrat[1]
- Cook Political Report: Solid Democrat[2]
- Takeaway: Solid Obama[3]
- Electoral-vote.com: Strong Democrat[4]
- Washington Post: Solid Obama[5]
- Politico: Solid Obama[6]
- Real Clear Politics: Solid Obama[7]
- FiveThirtyEight.com: Solid Obama[8]
- CQ Politics: Safe Democrat[9]
- New York Times: Solid Democrat[10]
- CNN: Safe Democrat[11]
- NPR: Solid Obama[12]
- MSNBC: Solid Obama[13]
- Fox News: Democrat[14]
- Associated Press: Democrat[15]
- Rasmussen Reports: Safe Democrat[16]
Polling
Obama won every single pre-election poll. Since September 22, Obama won each by a double-digit margin of victory and at least 52% of the vote. The final 3 polls showed Obama leading 55% to 41%.[17]
Fundraising
McCain raised a total of $1,258,426 in the state. Obama raised $6,660,622.[18]
Analysis
Voters in Oregon have a strong penchant for advancing the protection of civil liberties and individual freedoms, liberal values that have given Democrats a big edge in the state in recent years. The state once leaned Republican, like most of the Pacific Northwest. It only went Democratic once from 1948 to 1984—during Lyndon Johnson's 44-state landslide of 1964. However, the state has gone Democratic in every election since 1988, and along with California and Washington it is reckoned as forming a solid bloc of blue states along the Pacific Coast.
On Election Day, Obama carried the state by 16.35 points. Most rural counties favored McCain, though Obama performed much better in this region than John Kerry had in 2004. However, Obama's strong support in the more urban Willamette Valley, home to two-thirds of the state's population, would have allowed him to win the state decisively in any event. The state remains geographically and politically divided by the Cascade Mountains, with eastern Oregon and the southwest being more rural, less populated and therefore strongly Republican, while the Willamette Valley is more urbanized and therefore strongly Democratic. These two areas compose the core of each party's votes: rural Oregon is strongly Republican and very similar culturally to Idaho, while the Willamette Valley—especially the cities of Portland and Eugene—heavily favors the Democrats. While Republicans typically win more counties due to running up large margins in the east and southwest, Democrats typically win the state because the Willamette Valley has more people. In 2008, Obama's overwhelming margins in Portland and Eugene, combined with strong support from Portland's suburbs (which function as swing counties), enabled him to win a landslide in a structurally liberal state. Although Obama broke no long Republican county streaks, he came with 0.49 percent of winning Polk County and 1.36% of winning Yamhill County, neither of which have voted for a Democratic presidential candidate since 1968.[21]
During the same election, Democratic Speaker of the Oregon House of Representatives Jeff Merkley defeated incumbent Republican U.S. Senator Gordon Smith by a narrow 3.35% margin. Merkley received 48.90% of the vote while Smith took in 45.55% with the remaining 5.24% going to Dave Brownlow of the Constitution Party. At the state level, Democrats picked up five seats in the Oregon House of Representatives while Republicans picked up one seat in the Oregon Senate.
As of the 2016 presidential election, this is the last election in which Marion County, Jackson County, and Wasco County voted for a Democratic presidential candidate.[21]
Results
| 2008 United States presidential election in Oregon | ||||||
|---|---|---|---|---|---|---|
| Party | Candidate | Running mate | Votes | Percentage | Electoral votes | |
| Democratic | Barack Obama | Joe Biden | 1,037,291 | 56.75% | 7 | |
| Republican | John McCain | Sarah Palin | 738,475 | 40.40% | 0 | |
| Peace | Ralph Nader | Matt Gonzalez | 18,614 | 1.02% | 0 | |
| Write-ins | Write-ins | 13,613 | 0.74% | 0 | ||
| Constitution | Chuck Baldwin | Darrell Castle | 7,693 | 0.42% | 0 | |
| Libertarian | Bob Barr | Wayne Allyn Root | 7,635 | 0.42% | 0 | |
| Pacific Green | Cynthia McKinney | Rosa Clemente | 4,543 | 0.25% | 0 | |
| Totals | 1,827,864 | 100.00% | 7 | |||
| Voter turnout (Voting age population) | 62.9% | |||||
Results by county
| County | Barack Hussein Obama Democratic |
John Sidney McCain III Republican |
Ralph Nader Peace |
Charles Obadiah Baldwin Constitution |
Robert Laurence Barr Jr. Libertarian |
Cynthia Ann McKinney Pacific Green |
Various candidates Write-ins |
Margin | Total votes cast | ||||||||
|---|---|---|---|---|---|---|---|---|---|---|---|---|---|---|---|---|---|
| # | % | # | % | # | % | # | % | # | % | # | % | # | % | # | % | ||
| Baker | 2,805 | 31.96% | 5,650 | 64.37% | 106 | 1.21% | 55 | 0.63% | 51 | 0.58% | 23 | 0.26% | 87 | 0.99% | -2,845 | -32.41% | 8,777 |
| Benton | 29,901 | 64.33% | 15,264 | 32.84% | 427 | 0.92% | 169 | 0.36% | 214 | 0.46% | 169 | 0.36% | 334 | 0.72% | 14,637 | 31.49% | 46,478 |
| Clackamas | 103,476 | 53.93% | 83,595 | 43.57% | 1,750 | 0.91% | 692 | 0.36% | 717 | 0.37% | 284 | 0.15% | 1,364 | 0.71% | 19,881 | 10.36% | 191,878 |
| Clatsop | 10,701 | 57.69% | 7,192 | 38.78% | 249 | 1.34% | 70 | 0.38% | 101 | 0.54% | 68 | 0.37% | 167 | 0.90% | 3,509 | 18.92% | 18,548 |
| Columbia | 13,390 | 54.06% | 10,413 | 42.04% | 307 | 1.24% | 202 | 0.82% | 123 | 0.50% | 74 | 0.30% | 259 | 1.05% | 2,977 | 12.02% | 24,768 |
| Coos | 14,401 | 46.53% | 15,354 | 49.61% | 422 | 1.36% | 204 | 0.66% | 163 | 0.53% | 103 | 0.33% | 304 | 0.98% | -953 | -3.08% | 30,951 |
| Crook | 3,632 | 35.09% | 6,371 | 61.54% | 157 | 1.52% | 37 | 0.36% | 55 | 0.53% | 24 | 0.23% | 76 | 0.73% | -2,739 | -26.46% | 10,352 |
| Curry | 5,230 | 42.41% | 6,646 | 53.89% | 174 | 1.41% | 83 | 0.67% | 57 | 0.46% | 26 | 0.21% | 116 | 0.94% | -1,416 | -11.48% | 12,332 |
| Deschutes | 38,819 | 48.66% | 39,064 | 48.96% | 702 | 0.88% | 259 | 0.32% | 305 | 0.38% | 129 | 0.16% | 504 | 0.63% | -245 | -0.31% | 79,782 |
| Douglas | 20,298 | 38.34% | 30,919 | 58.41% | 561 | 1.06% | 320 | 0.60% | 217 | 0.41% | 128 | 0.24% | 494 | 0.93% | -10,621 | -20.06% | 52,937 |
| Gilliam | 430 | 38.74% | 648 | 58.38% | 16 | 1.44% | 6 | 0.54% | 2 | 0.18% | 2 | 0.18% | 6 | 0.54% | -218 | -19.64% | 1,110 |
| Grant | 1,006 | 25.74% | 2,785 | 71.25% | 30 | 0.77% | 39 | 1.00% | 15 | 0.38% | 2 | 0.05% | 32 | 0.82% | -1,779 | -45.51% | 3,909 |
| Harney | 950 | 25.79% | 2,595 | 70.46% | 51 | 1.38% | 21 | 0.57% | 29 | 0.79% | 10 | 0.27% | 27 | 0.73% | -1,645 | -44.66% | 3,683 |
| Hood River | 6,302 | 64.11% | 3,265 | 33.21% | 112 | 1.14% | 44 | 0.45% | 31 | 0.32% | 21 | 0.21% | 55 | 0.56% | 3,037 | 30.90% | 9,830 |
| Jackson | 49,090 | 48.58% | 49,043 | 48.53% | 844 | 0.84% | 601 | 0.59% | 425 | 0.42% | 224 | 0.22% | 820 | 0.81% | 47 | 0.05% | 101,047 |
| Jefferson | 3,682 | 44.27% | 4,402 | 52.92% | 100 | 1.20% | 37 | 0.44% | 22 | 0.26% | 21 | 0.25% | 54 | 0.65% | -720 | -8.66% | 8,318 |
| Josephine | 17,412 | 41.41% | 22,973 | 54.63% | 492 | 1.17% | 379 | 0.90% | 234 | 0.56% | 135 | 0.32% | 424 | 1.01% | -5,561 | -13.23% | 42,049 |
| Klamath | 9,370 | 31.87% | 19,113 | 65.01% | 300 | 1.02% | 178 | 0.61% | 174 | 0.59% | 68 | 0.23% | 196 | 0.67% | -9,743 | -33.14% | 29,399 |
| Lake | 957 | 25.95% | 2,638 | 71.53% | 38 | 1.03% | 19 | 0.52% | 11 | 0.30% | 11 | 0.30% | 14 | 0.38% | -1,681 | -45.58% | 3,688 |
| Lane | 114,037 | 62.35% | 63,835 | 34.90% | 1,836 | 1.00% | 590 | 0.32% | 754 | 0.41% | 534 | 0.29% | 1,324 | 0.72% | 50,202 | 27.45% | 182,910 |
| Lincoln | 14,258 | 59.68% | 8,791 | 36.80% | 334 | 1.40% | 83 | 0.35% | 127 | 0.53% | 73 | 0.31% | 223 | 0.93% | 5,467 | 22.89% | 23,889 |
| Linn | 22,163 | 42.64% | 28,071 | 54.00% | 625 | 1.20% | 287 | 0.55% | 237 | 0.46% | 134 | 0.26% | 465 | 0.89% | -5,908 | -11.37% | 51,982 |
| Malheur | 2,949 | 28.27% | 7,157 | 68.60% | 85 | 0.81% | 81 | 0.78% | 57 | 0.55% | 28 | 0.27% | 76 | 0.73% | -4,208 | -40.33% | 10,433 |
| Marion | 61,816 | 49.63% | 59,059 | 47.41% | 1,257 | 1.01% | 551 | 0.44% | 528 | 0.42% | 328 | 0.26% | 1,024 | 0.82% | 2,757 | 2.21% | 124,563 |
| Morrow | 1,410 | 34.75% | 2,509 | 61.83% | 43 | 1.06% | 33 | 0.81% | 23 | 0.57% | 9 | 0.22% | 31 | 0.76% | -1,099 | -27.08% | 4,058 |
| Multnomah | 279,696 | 76.69% | 75,171 | 20.61% | 4,166 | 1.14% | 904 | 0.25% | 1,195 | 0.33% | 1,207 | 0.33% | 2,371 | 0.65% | 204,525 | 56.08% | 364,710 |
| Polk | 17,536 | 48.43% | 17,714 | 48.92% | 320 | 0.88% | 184 | 0.51% | 116 | 0.32% | 79 | 0.22% | 258 | 0.71% | -178 | -0.49% | 36,207 |
| Sherman | 385 | 36.77% | 634 | 60.55% | 8 | 0.76% | 6 | 0.57% | 5 | 0.48% | 1 | 0.10% | 8 | 0.76% | -249 | -23.78% | 1,047 |
| Tillamook | 7,072 | 53.18% | 5,757 | 43.30% | 197 | 1.48% | 59 | 0.44% | 58 | 0.44% | 42 | 0.32% | 112 | 0.84% | 1,315 | 9.89% | 13,297 |
| Umatilla | 9,484 | 37.16% | 15,254 | 59.77% | 245 | 0.96% | 166 | 0.65% | 113 | 0.44% | 56 | 0.22% | 205 | 0.80% | -5,770 | -22.61% | 25,523 |
| Union | 4,613 | 36.63% | 7,581 | 60.20% | 119 | 0.94% | 85 | 0.67% | 63 | 0.50% | 23 | 0.18% | 110 | 0.87% | -2,968 | -23.57% | 12,594 |
| Wallowa | 1,492 | 33.42% | 2,836 | 63.52% | 35 | 0.78% | 30 | 0.67% | 24 | 0.54% | 6 | 0.13% | 42 | 0.94% | -1,344 | -30.10% | 4,465 |
| Wasco | 5,906 | 51.90% | 5,103 | 44.84% | 140 | 1.23% | 61 | 0.54% | 46 | 0.40% | 31 | 0.27% | 93 | 0.82% | 803 | 7.06% | 11,380 |
| Washington | 141,544 | 59.82% | 89,185 | 37.69% | 1,892 | 0.80% | 895 | 0.38% | 1,148 | 0.49% | 379 | 0.16% | 1,589 | 0.67% | 52,359 | 22.13% | 236,632 |
| Wheeler | 281 | 34.61% | 498 | 61.33% | 11 | 1.35% | 5 | 0.62% | 9 | 1.11% | 1 | 0.12% | 7 | 0.86% | -217 | -26.72% | 812 |
| Yamhill | 20,797 | 47.78% | 21,390 | 49.14% | 463 | 1.06% | 258 | 0.59% | 186 | 0.43% | 90 | 0.21% | 342 | 0.79% | -593 | -1.36% | 43,526 |
| Totals | 1,037,291 | 56.75% | 738,475 | 40.40% | 18,614 | 1.02% | 7,693 | 0.42% | 7,635 | 0.42% | 4,543 | 0.25% | 13,613 | 0.74% | 298,816 | 16.35% | 1,827,864 |
Results by congressional district
Barack Obama carried four of the state’s five congressional districts in Oregon, all held by Democrats.
| District | Obama | McCain | Representative |
|---|---|---|---|
| 1st | 61.03% | 36.27% | David Wu |
| 2nd | 43.21% | 53.86% | Greg Walden |
| 3rd | 71.39% | 25.78% | Earl Blumenauer |
| 4th | 53.79% | 43.08% | Peter DeFazio |
| 5th | 53.95% | 43.33% | Darlene Hooley (110th Congress) |
| Kurt Schrader (111th Congress) |
Electors
Technically the voters of Oregon cast their ballots for electors: representatives to the Electoral College. Oregon is allocated 7 electors because it has 5 congressional districts and 2 senators. All candidates who appear on the ballot or qualify to receive write-in votes must submit a list of 7 electors, who pledge to vote for their candidate and his or her running mate. Whoever wins the majority of votes in the state is awarded all 7 electoral votes. Their chosen electors then vote for president and vice president. Although electors are pledged to their candidate and running mate, they are not obligated to vote for them.[22] An elector who votes for someone other than his or her candidate is known as a faithless elector.
The electors of each state and the District of Columbia met on December 15, 2008, to cast their votes for president and vice president. The Electoral College itself never meets as one body. Instead the electors from each state and the District of Columbia met in their respective capitols.
The following were the members of the Electoral College from the state. All 7 were pledged to Barack Obama and Joe Biden:[23]
- Michael Bohan
- Shirley Cairns
- Joe Smith
- John McColgan
- Meredith Wood Smith
- Frank James Dixon
- Bernard Gorter
References
- "D.C.'s Political Report: The complete source for campaign summaries". www.dcpoliticalreport.com. Archived from the original on 2009-01-01. Retrieved 2016-09-25.
- "Archived copy". Archived from the original on May 5, 2015. Retrieved January 14, 2015.CS1 maint: archived copy as title (link)
- Adnaan (2008-09-20). "Track the Electoral College vote predictions". The Takeaway. Archived from the original on April 22, 2009. Retrieved 2009-11-14.
- "Electoral-vote.com: President, Senate, House Updated Daily". electoral-vote.com. Retrieved 2016-09-25.
- Based on Takeaway
- "POLITICO's 2008 Swing State Map - POLITICO.com". www.politico.com. Retrieved 2016-09-25.
- "Electoral Map". RealClearPolitics. Archived from the original on 5 June 2008.
- Based on Takeaway
- "CQ Presidential Election Maps, 2008". CQ Politics. Archived from the original on June 14, 2009. Retrieved December 20, 2009.
- Nagourney, Adam; Zeleny, Jeff; Carter, Shan (2008-11-04). "The Electoral Map: Key States". The New York Times. Retrieved May 26, 2010.
- "October – 2008 – CNN Political Ticker - CNN.com Blogs". CNN. October 31, 2008. Retrieved May 26, 2010.
- Based on Takeaway
- Based on Takeaway
- "Winning The Electoral College". Fox News. April 27, 2010.
- "roadto270". hosted.ap.org. Retrieved 2016-09-25.
- "Election 2008: Electoral College Update - Rasmussen Reports™". www.rasmussenreports.com. Retrieved 2016-09-25.
- "Election 2008 Polls". Dave Leip's Atlas of U.S. Presidential Elections.
- "Archived copy". Archived from the original on 2009-03-24. Retrieved 2009-08-18.CS1 maint: archived copy as title (link)
- "Map: Campaign Ad Spending - Election Center 2008 from CNN.com". CNN. Retrieved May 26, 2010.
- "Map: Campaign Candidate Visits - Election Center 2008 from CNN.com". CNN. Retrieved May 26, 2010.
- Sullivan, Robert David; ‘How the Red and Blue Map Evolved Over the Past Century’; America Magazine in The National Catholic Review; June 29, 2016
- "Electoral College". California Secretary of State. Archived from the original on October 30, 2008. Retrieved 2008-11-01.
- "U. S. Electoral College 2008 Election - Certificates".