Iberia Parish, Louisiana
Iberia Parish (French: Paroisse de l'Ibérie, Spanish: Parroquia de Iberia) is a parish located in the U.S. state of Louisiana. As of the 2010 census, the population was 73,240.[1] The parish seat is New Iberia.[2]
Iberia Parish | |
|---|---|
Parish | |
| Parish of Iberia | |
 Historic House and Garden Shadows-on-the-Teche | |
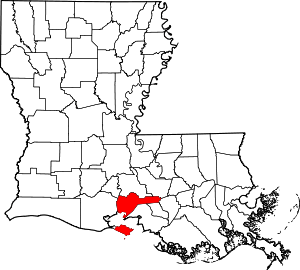 Location within the U.S. state of Louisiana | |
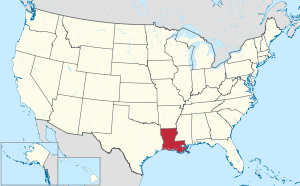 Louisiana's location within the U.S. | |
| Coordinates: 29°47′N 91°47′W | |
| Country | |
| State | |
| Founded | October 30, 1868 |
| Named for | Iberian Peninsula |
| Seat | New Iberia |
| Largest city | New Iberia |
| Area | |
| • Total | 1,031 sq mi (2,670 km2) |
| • Land | 574 sq mi (1,490 km2) |
| • Water | 456 sq mi (1,180 km2) 44% |
| Population (2010) | |
| • Total | 73,240 |
| • Estimate (2018) | 70,941 |
| • Density | 71/sq mi (27/km2) |
| Time zone | UTC−6 (Central) |
| • Summer (DST) | UTC−5 (CDT) |
| Congressional district | 3rd |
| Website | iberiaparishgovernment |
The parish was formed in 1868 during the Reconstruction era and named for the Iberian Peninsula.[3][4] It is part of the 22-parish Acadiana region of the state, with a large Francophone population. Some of its ethnic French residents had ancestors who settled here after being expelled in the 18th century by the British from Acadia in present-day Canada. Historically, it has also been a center for sugar cane cultivation and produces the most sugar of any parish in the state.
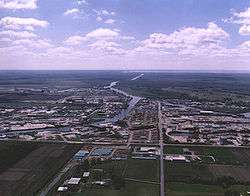
Iberia Parish is part of the Lafayette, Louisiana, Metropolitan Statistical Area. The Port of Iberia has a waterway with access to the Gulf Coast.
History
Iberia Parish was created from parts of St. Martin Parish and St. Mary Parish in 1868. It was part of an effort by the Reconstruction-era government to create parishes in which there would be large Republican-majority populations, composed primarily of freedmen in those years.[5]
This territory was part of the sugar parishes, where sugar cane plantations were developed along the waterways before and after the Civil War, dependent on labor of high numbers of enslaved African Americans before the war. Sugar cane was a lucrative commodity crop for planters. Relations between whites and blacks were troubled after the Civil War, as whites sought to dominate freedmen, by violence and intimidation if necessary.
The period after the Reconstruction era was one of increasing violence, especially at the turn of the century and into the early 20th century. In this period, Iberia Parish had 26 lynchings of African Americans by whites, part of racial terrorism. This was the fifth-highest total of any parish in Louisiana, and tied with the total number of lynchings in Bossier Parish.[6]
There was intense political factionalism in Sugarland, as southern Louisiana was called. Iberia Parish had factions split among conservative whites and those who were more moderate about the status of African Americans. Moderates sometimes allied with the Creoles of color in the parish. But in 1884 white Democrats murdered more than 20 African Americans (most of the total noted above), in a kind of political lynching, and arrested white Republicans to regain power in Iberia Parish. In contrast to northern Louisiana, residents otherwise seemed to rely more on the formal legal system, with fewer mob lynchings. But African Americans suffered here, too, making up 88 percent of the persons legally executed in the late 19th century.[7]
In the late 19th century, there was often a labor shortage on the sugar plantations. Planters recruited thousands of Italian immigrants as temporary laborers, many Sicilians who had first settled in New Orleans. They were needed during the fall harvest and processing season, which extended from October to January. The Italians became part of the volatility of social relations, struggling to make their way between planters and African-American workers, and competing with other workers for jobs.[8]
The parish economy changed markedly in the 20th century after the discovery of oil. The Port of Iberia was developed into an industrial center. New types of jobs became available but discriminatory segregation was used against African Americans. Sugar continues to be an important commodity crop, however, and Iberia produces the most sugar of any parish in the state.
Geography
According to the U.S. Census Bureau, the parish has a total area of 1,031 square miles (2,670 km2), of which 574 square miles (1,490 km2) is land and 456 square miles (1,180 km2) (44%) is water.[9] This includes Marsh Island.
Major highways
.svg.png)


Adjacent parishes
- St. Martin Parish (north, south)
- Iberville Parish (northeast)
- Assumption Parish (east)
- St. Mary Parish (southeast)
- Vermilion Parish (west)
- Lafayette Parish (northwest)
Protected areas
The parish has both national and state protected areas within its borders.
National protected area
State protected areas
Part of the Attakapas Wildlife Management Area is located within Iberia Parish, as well as in St. Mary and St. Martin parishes.[10]
Demographics
| Historical population | |||
|---|---|---|---|
| Census | Pop. | %± | |
| 1870 | 9,042 | — | |
| 1880 | 16,676 | 84.4% | |
| 1890 | 20,997 | 25.9% | |
| 1900 | 29,015 | 38.2% | |
| 1910 | 31,262 | 7.7% | |
| 1920 | 26,855 | −14.1% | |
| 1930 | 28,192 | 5.0% | |
| 1940 | 37,183 | 31.9% | |
| 1950 | 40,059 | 7.7% | |
| 1960 | 51,657 | 29.0% | |
| 1970 | 57,397 | 11.1% | |
| 1980 | 63,752 | 11.1% | |
| 1990 | 68,297 | 7.1% | |
| 2000 | 73,266 | 7.3% | |
| 2010 | 73,240 | 0.0% | |
| Est. 2018 | 70,941 | [11] | −3.1% |
| U.S. Decennial Census[12] 1790-1960[13] 1900-1990[14] 1990-2000[15] 2010-2013[1] | |||
As of the census[16] of 2000, there were 73,266 people, 25,381 households, and 19,162 families residing in the parish. The population density was 127 people per square mile (49/km²). There were 27,844 housing units at an average density of 48 per square mile (19/km²). The racial makeup of the parish was 65.08% White, 30.81% Black or African American, 0.31% Native American, 1.93% Asian, 0.02% Pacific Islander, 0.60% from other races, and 1.25% from two or more races. 1.50% of the population were Hispanic or Latino of any race. 11.99% reported speaking French or Cajun French at home, while 1.48% speak Lao and 1.29% Spanish.[17]
There were 25,381 households out of which 39.50% had children under the age of 18 living with them, 53.20% were married couples living together, 17.20% had a female householder with no husband present, and 24.50% were non-families. 21.10% of all households were made up of individuals and 8.70% had someone living alone who was 65 years of age or older. The average household size was 2.82 and the average family size was 3.28.
In the parish the population was spread out with 30.00% under the age of 18, 9.60% from 18 to 24, 28.40% from 25 to 44, 20.60% from 45 to 64, and 11.40% who were 65 years of age or older. The median age was 33 years. For every 100 females there were 92.80 males. For every 100 females age 18 and over, there were 89.80 males.
The median income for a household in the parish was $31,204, and the median income for a family was $36,017. Males had a median income of $32,399 versus $18,174 for females. The per capita income for the parish was $14,145. About 20.20% of families and 23.60% of the population were below the poverty line, including 31.50% of those under age 18 and 20.20% of those age 65 or over.
Education
Iberia Parish School System serves the parish. Iberia parish also has several private schools. These include Catholic High New Iberia, Acadiana Christian School and Highland Baptist School.
National Guard
E Company 199th Forward Support Battalion is stationed in Jeanerette, Louisiana, and B Company 2-156th is stationed in New Iberia, Louisiana. Both units have deployed twice to Iraq, 2004-5 and 2010, as part of the 256TH IBCT.
Communities

Cities
- Jeanerette
- New Iberia (parish seat and largest municipality)
Town
- Delcambre (part)
Village
Census-designated place
Unincorporated communities
Politics
| Year | Republican | Democratic | Third parties |
|---|---|---|---|
| 2016 | 64.4% 20,903 | 33.0% 10,698 | 2.6% 853 |
| 2012 | 62.6% 20,892 | 36.3% 12,132 | 1.1% 373 |
| 2008 | 60.7% 20,127 | 37.7% 12,492 | 1.7% 549 |
| 2004 | 60.2% 19,420 | 38.5% 12,426 | 1.3% 427 |
| 2000 | 57.4% 17,236 | 39.2% 11,762 | 3.4% 1,022 |
| 1996 | 40.1% 12,014 | 50.4% 15,087 | 9.6% 2,864 |
| 1992 | 39.0% 11,905 | 42.7% 13,040 | 18.3% 5,585 |
| 1988 | 54.5% 15,438 | 42.9% 12,166 | 2.6% 727 |
| 1984 | 62.1% 17,727 | 35.7% 10,170 | 2.2% 629 |
| 1980 | 57.0% 14,273 | 38.7% 9,681 | 4.3% 1,074 |
| 1976 | 50.1% 10,392 | 48.1% 9,984 | 1.8% 377 |
| 1972 | 65.8% 11,812 | 28.7% 5,143 | 5.5% 985 |
| 1968 | 28.6% 5,448 | 29.0% 5,510 | 42.4% 8,071 |
| 1964 | 50.2% 8,196 | 49.8% 8,141 | |
| 1960 | 23.0% 3,551 | 59.7% 9,235 | 17.4% 2,684 |
| 1956 | 63.4% 6,733 | 33.4% 3,544 | 3.2% 338 |
| 1952 | 58.4% 5,669 | 41.6% 4,040 | |
| 1948 | 47.3% 2,910 | 16.5% 1,015 | 36.3% 2,232 |
| 1944 | 23.8% 1,141 | 76.2% 3,661 | |
| 1940 | 29.4% 1,706 | 70.6% 4,091 | |
| 1936 | 32.2% 1,234 | 67.8% 2,595 | |
| 1932 | 24.9% 798 | 75.1% 2,412 | |
| 1928 | 13.9% 413 | 86.1% 2,561 | |
| 1924 | 47.9% 679 | 52.2% 740 | |
| 1920 | 74.4% 1,275 | 25.6% 438 | |
| 1916 | 7.5% 134 | 44.9% 802 | 47.6% 850 |
| 1912 | 17.1% 222 | 51.4% 666 | 31.5% 408 |
See also
- National Register of Historic Places listings in Iberia Parish, Louisiana
- William S. Patout III, Iberia Parish sugar grower
References
- "State & County QuickFacts". United States Census Bureau. Archived from the original on June 6, 2011. Retrieved August 9, 2013.
- "Find a County". National Association of Counties. Archived from the original on 2011-05-31. Retrieved 2011-06-07.
- "Iberia Parish". Center for Cultural and Eco-Tourism. Retrieved September 4, 2014.
- Gannett, Henry (1905). The Origin of Certain Place Names in the United States. Govt. Print. Off. pp. 164.
- http://stmartinparishclerkofcourt.com/history.aspx
- Lynching in America, Third Edition: Supplement by County Archived 2017-10-23 at the Wayback Machine, p. 6, Equal Justice Initiative, Mobile, AL, 2017
- Michael James Pfeifer, Rough Justice: Lynching and American Society, 1874-1947, University of Illinois Press, 2004; pp.79-80
- Jean Ann Scarpaci, "Immigrants in the New South: Italians in Louisiana's sugar parishes, 1880–1910", Labor History, Vol. 16, 1975- Issue 2
- "2010 Census Gazetteer Files". United States Census Bureau. August 22, 2012. Archived from the original on September 28, 2013. Retrieved August 20, 2014.
- Attakapas WMA- Retrieved 2017-02-19
- "Population and Housing Unit Estimates". Retrieved October 29, 2019.
- "U.S. Decennial Census". United States Census Bureau. Retrieved August 20, 2014.
- "Historical Census Browser". University of Virginia Library. Retrieved August 20, 2014.
- "Population of Counties by Decennial Census: 1900 to 1990". United States Census Bureau. Retrieved August 20, 2014.
- "Census 2000 PHC-T-4. Ranking Tables for Counties: 1990 and 2000" (PDF). United States Census Bureau. Retrieved August 20, 2014.
- "U.S. Census website". United States Census Bureau. Retrieved 2008-01-31.
- "Language Map Data Center". www.mla.org. Retrieved 2018-03-06.
- Leip, David. "Dave Leip's Atlas of U.S. Presidential Elections". uselectionatlas.org. Retrieved 2018-03-06.
External links
| Wikimedia Commons has media related to Iberia Parish, Louisiana. |
Geology
- Heinrich, P. V., and W. J. Autin, 2000, Baton Rouge 30 x 60 minute geologic quadrangle. Louisiana Geological Survey, Baton Rouge, Louisiana.
Places adjacent to Iberia Parish, Louisiana | ||||||||||
|---|---|---|---|---|---|---|---|---|---|---|
| ||||||||||
Municipalities and communities of Iberia Parish, Louisiana, United States | ||
|---|---|---|
Parish seat: New Iberia | ||
| Cities | | |
| Town | ||
| Village | ||
| CDP | ||
| Unincorporated communities | ||
| Footnotes | ‡This populated place also has portions in an adjacent parish or parishes | |
| Authority control |
|
|---|